


Abstract
Molecular analyses suggest that myeloma is composed of distinct sub-types that have different molecular pathologies and various response rates to certain treatments. Drug responses in multiple myeloma (MM) are usually recorded as a multi-level ordinal outcome. One of the goals of drug response studies is to predict which response category any patients belong to with high probability based on their clinical and molecular features. However, as most of genes have small effects, gene-based models may provide limited predictive accuracy. In that case, methods for predicting multi-level ordinal drug responses by incorporating biological pathways are desired but have not been developed yet.
We propose a pathway-structured method for predicting multi-level ordinal responses using a two-stage approach. We first develop hierarchical ordinal logistic models and an efficient quasi-Newton algorithm for jointly analyzing numerous correlated variables. Our two-stage approach first obtains the linear predictor (called the pathway score) for each pathway by fitting all predictors within each pathway using the hierarchical ordinal logistic approach, and then combines the pathway scores as new predictors to build a predictive model. We applied the proposed method to two publicly available datasets for predicting multi-level ordinal drug responses in MM using large-scale gene expression data and pathway information. Our results show that our approach not only significantly improved the predictive performance compared with the corresponding gene-based model but also allowed us to identify biologically relevant pathways.
The proposed approach has been implemented in our R package BhGLM, which is freely available from the public GitHub repository https://github.com/abbyyan3/BhGLM.
1 Introduction
Multiple myeloma (MM) is a malignant plasma cell disorder with approximately 30 770 new cases are expected to be diagnosed and 12 770 deaths are expected to occur in the United States in 2018 (American Cancer, 2018; Kyle and RajKumar, 2008; Terragna et al., 2016). One of the major advances in the treatment regimen of MM patients has been the introduction of novel agents, such as the proteasome inhibitors (e.g. bortezomib) and immunomodulatory drugs (e.g. thalidomide), leading to the significant improvement in both overall survival and progression-free survival in MM in the last decade (Fonseca et al., 2017; Hofman et al., 2017). However, the heterogeneity exists in the patients’ response to those new treatments, and molecular features responsible for the variability in response remain undefined (Kumar et al., 2008; Malek et al., 2017; Rajkumar, 2011). Molecular analyses suggest that myeloma is composed of distinct sub-types that have different molecular pathologies and various response rates to certain treatments (Mulligan et al., 2007). Previous studies found that gene expression profiling is associated with the drug response variability of bortezomib, resulting in various disease prognoses (Mulligan et al., 2007; Terragna et al., 2016). However, most of the discovered genes have small effects, and thus contribute a trivial portion to complex drug response (Geeleher et al., 2014). It urges more efforts to develop predictive models using multiple molecular markers of MM patients to provide more precise prognostic and predictive classifiers for a specific therapy (Kumar et al., 2008).
Drug responses in MM are usually recorded as a multi-level ordinal outcome (Mulligan et al., 2007; Terragna et al., 2016). According to European Group for Bone Marrow Transplantation criteria, drug responses in MM were classified as achieving complete response (CR), partial response (PR), minimal response (MR), no change (NC) and progressive disease (PD; Blade et al., 1998). One of the goals of drug response studies is to predict which response category any patients belong to with high probability based on their clinical and molecular features. However, previous analyses, as in Mulligan et al. (2007) and Terragna et al. (2016), combined the five-level ordinal drug responses to form a binary outcome and only predicted two response categories. Such analyses fail to use full data information and can be arbitrary in selecting the recode strategy (Warner, 2008). To avoid these problems and obtain more informative and accurate prediction, therefore, it is desirable to directly analyze the multi-level drug response, rather than a simplified binary outcome.
Predictive modeling with molecular profiling requires statistical methods to properly handle at least thousands of molecular predictors. Since most of the genes have small effects on drug responses, gene-based models may provide limited predictive accuracy. One possible way to improve drug response prediction is to incorporate valuable biological information. It has been noted that the genetic nature of cancer is pathway-based, that is, oncogenes can be grouped into pathways based on biological functions such as cell survival, proliferation and metastatic dissemination (Barillot, 2012; Huang et al., 2014). Therefore, incorporating pathway information into predictive modeling could allow us to combine weak signals from a number of genes within each pathway and thus increase the power in prediction and prognosis.
Various pathway-based models for predicting censored survival outcomes have been proposed and widely used (Abraham et al., 2010; Eng et al., 2013; Huang et al., 2014; Lee et al., 2008; Reyal et al., 2008; Teschendorff et al., 2010). Especially, we have proposed an efficient two-stage approach to incorporate pathway information into the prognostic models using large-scale gene expression data for cancer survival prediction, which can be directly applicable in MM survival prediction (Zhang et al., 2017). However, methods for predicting multi-level ordinal drug responses by incorporating biological pathways have not been developed yet.
In this article, we propose a pathway-structured method for predicting multi-level ordinal responses by extending our two-stage approach for cancer survival prediction. We first develop hierarchical ordinal logistic models and an efficient quasi-Newton algorithm for jointly analyzing numerous correlated variables. Our two-stage approach first obtains the linear predictor (called the pathway score) for each pathway by fitting all predictors within each pathway using the proposed hierarchical ordinal logistic approach, and then combines the pathway scores as new predictors to build a predictive model. We applied the proposed method to two publicly available datasets for predicting multi-level ordinal drug responses in MM using large-scale gene expression data and pathway information (Mulligan et al., 2007; Terragna et al., 2016). Our results show that our two-stage approach not only significantly improved the predictive performance compared with the corresponding gene-based model but also identified biologically relevant pathways.
2 Materials and methods
2.1 Hierarchical ordinal logistic models
2.1.1 The model
2.1.2 The algorithm
We use the quasi-Newton algorithm, called BFGS, to estimate the posterior mode () by iteratively maximizing the log posterior density. The quasi-Newton algorithm is an extension of the Newton–Raphson algorithm, which requires the vector of derivatives and matrix of second derivatives of the log posterior density. The BFGS algorithm forms an approximation of matrix of second derivatives using only gradient information, thus avoiding costly computation and storage. We develop the quasi-Newton algorithm by adding the derivatives and second derivatives of the log Cauchy priors to those of the log posterior density. The derivatives and second derivatives of the log Cauchy priors cane easily calculated explicitly. We implement our algorithm by altering the commonly used function polr in the R package MASS, which fits classical ordinal logistic regressions using the quasi-Newton algorithm.
The quasi-Newton algorithm also can return covariance matrix . Thus, we can test the hypothesis H0: βj = 0 by using the statistic , which approximately follows the standard normal distribution. The proposed quasi-Newton algorithm is stable and fast, usually taking seconds for fitting a hierarchical ordinal logistic model with hundreds of covariates.
2.1.3 Model assessment
After fitting a hierarchical ordinal logistic model, we obtain the estimate () and then can estimate the probabilities: . Denote yik = I(yi = k) as the binary indicator response for the k-th category. With the estimated probabilities pik, we can evaluate the fitted model using the following measures:
Deviance: . Deviance measures the overall quality of a fitted model.
AUC (area under the ROC curve). We can calculate AUC for the k-th category using yik and pik, i = 1, ···, n, as usual. Then the AUC for all the categories is defined as .
MSE (mean squared error). MSE is defined as .
Mis-classification. The mis-classification is defined as: , where if , and if .
To evaluate the predictive performance of the model, we use a cross-validation procedure to calculate the values of the above measures (called the cross-validated measures; Hastie et al., 2015; Tibshirani and Efron, 2002). For an H-fold cross-validation, we randomly split the data into H subsets of roughly the same size. Using the (H – 1) subsets excluding the h-th subset, we obtain the estimate and then calculate the probabilities, for all individuals of the h-th subset. Cycling through H parts, we obtain the probabilities pik for all individuals and then can calculate the measures defined above. To get more stable results, we can run H-fold cross-validation multiple times and use the average of the measure over the repeats to assess the predictive performance. We also can use leave-one-out cross-validation (LOOCV; i.e. H = n) to obtain unique result.
2.1.4 Selecting an optimal scale value
The performance of the hierarchical ordinal model can depend on the scale parameter in Cauchy prior. We fit a sequence of models with different scales covering reasonable values, from which we can choose an optimal one based on the cross-validated deviance (i.e. the lowest deviance) as described above.
2.2 Two-stage approach for incorporating pathway information
In principle, we can directly fit all available genes to build a predictive model with the above hierarchical modeling approach. However, it can be more efficient to use a two-stage approach that incorporates pathway information (Zhang et al., 2017). We propose the two-stage approach for predicting multi-level ordinal outcomes based on the hierarchical ordinal logistic models. Suppose that genes are assigned into G pathways, with the g-th pathway Gg containing Jg genes, and denote the vector of predictors in the g-th pathway by Xg. Overlapping is common in pathways analysis, that is, a gene could belong to multiple pathways. The two-stage approach can easily deal with overlapping.
We also use the quasi-Newton algorithm to fit the above second-stage hierarchical ordinal regression. The quasi-Newton algorithm can calculate the P-value for testing the hypothesis H0: αg = 0. Thus, this hierarchical ordinal model can be used to not only predict the multi-level response but also identify important pathways. The predictive performance of the second-stage hierarchical ordinal model is evaluated using the cross-validation procedure as described earlier.
3 Computer software
We have implemented the proposed approach in our R package BhGLM, which is freely available from the public GitHub repository https://github.com/abbyyan3/BhGLM. The function bpolr sets up and fits the proposed hierarchical ordinal logistic models, predict.bh calculates the measures for evaluating the fitted model and cv.bh performs the cross-validation to assess the prediction accuracy. BhGLM also includes functions to numerically and graphically summarize the fitted model. The function bpolr is an alteration of polr in the R package MASS for fitting classical ordinal logistic regressions using the quasi-Newton algorithm.
4 Real data applications
4.1 Data summary and pathway analysis
We applied the two-stage approach to two publicly available datasets for predicting multi-level ordinal drug responses in MM. Both datasets were acquired from GEO under accession number [GEO: GSE9782] and [GEO: GSE68871]. These two datasets were generated from two independent clinical trials originally published in Mulligan et al. (2007) and Terragna et al. (2016). Mulligan et al. (2007) recruited patients with relapsed myeloma enrolled in phase 2 and phase 3 clinical trials of bortezomib. There were 169 samples with a total of 22 283 gene expression probes. Terragna et al. (2016) recruited 118 new MM patients with the induction therapy of VTD and measured a total of 54 677 gene expression probes with the Affymetrix Human Genome U133 Plus 2.0 Array. A gene represents a covariate. In our analyses, we standardized each gene expression covariate to have a mean of 0 and a SD of 1. It is important to standardize the predictors to a common and interpretable scale in hierarchical modeling (Gelman and Hill, 2007; Gelman et al., 2008).
To construct the pathways, we used genome annotation tools, KEGG (Kanehisa and Goto, 2000), to map genes to pathways. We mapped all the probes to KEGG pathways using the Bioinformatics tool DAVID (Huang et al., 2009; Huang da et al., 2009). For Mulligan et al. (2007), 7692 genes were mapped to 170 pathways. For Terragna et al. (2016), 12 036 genes were mapped to 146 pathways. The data summary and the pathways of the two studies are presented in Table 1. We used the genes that were mapped into pathways to build predictive models for multi-level ordinal outcomes.
Data summary and pathways of the two studies used in the analyses
| Study | Mulligan et al. (2007) | Terragna et al. (2016) |
|---|---|---|
| Treatment | Bortezomib | VTD |
| Patients population | Relapsed MM | New-diagnosis |
| Number of samples | 169 | 118 |
| Number of genes | 22 283 | 54 677 |
| Number of genes in pathways | 7692 | 12 036 |
| Number of pathways | 170 | 146 |
4.2 Definitions of multi-level ordinal drug responses
According to European Group for Bone Marrow Transplantation criteria (Blade et al., 1998), patients were classified as achieving CR, PR, MR, NC and PD in Mulligan et al. (2007). In Terragna et al. (2016), patients’ drug responses were also classified as five categories: CR, near complete response (nCR), very good partial response (VGPR), PR and stable disease (SD). The five-level ordinal drug responses and their proportions in these two studies are summarized in Table 2.
The five-level drug ordinal outcomes, their numbers and proportions in the two datasets used in the analyses
| Response level | Number of patients (Proportion) | |
|---|---|---|
| Mulligan et al. (2007) | ||
| Five-level outcome | PD | 13 (7.70%) |
| NC | 60 (35.50%) | |
| MR | 12 (7.10%) | |
| PR | 43 (25.44%) | |
| CR | 41 (24.26%) | |
| Terragna et al. (2016) | ||
| Five-level outcome | SD | 7 (5.93%) |
| PR | 42 (35.59%) | |
| VGPR | 40 (33.90%) | |
| nCR | 14 (11.87%) | |
| CR | 15 (12.71%) | |
We mainly analyzed the original five-level ordinal drug responses. However, it can be seen that some categories have low frequencies, for example, PD and MR in in Mulligan et al. (2007), SD, nCR and CR in Terragna et al. (2016). To avoid low frequencies in some levels and to compare with the analysis of five-level responses, we combined the five-level drug response to construct a new three-level drug response and analyzed the new three-level drug response. We kept CR as one level, the worst two response groups as one level and the middle two levels as the third level. In Mulligan et al. (2007), we combined PD and NC as a new level, and PR and MR as another new level. Thus, the new three-level ordinal outcome consisted of 73 patients having a response as PD or NC, 55 patients having a response as MR or PR and 41 patients having CR. In Terragna et al. (2016), we combined SD and PR as a new level, and VGPR and nCR as another new level. Thus, the new three-level ordinal outcome consisted of 49 patients having a response as SD or PR, 54 patients having a response as VGPR or nCR and 15 patients having CR.
4.3 Building pathway-structured predictive model with two-stage approach
We used the proposed two-stage approach to build pathway-structured predictive models using gene expression covariates for the five- and three-level ordinal drug outcomes. For our real data analysis, it took an average of 1–1.5 min to generate LOOCV pathway score for each pathway. In total, it took 2.99 and 3.59 h in a desktop for the two datasets, respectively.
In the first stage, we calculated the LOOCV pathway score for each pathway and each patient by fitting all the genes in that pathway using a hierarchical ordinal logistic model. The procedure was then repeated for all the pathways. In the second stage, we used pathways with cross-validated AUC greater than 0.5 obtained in the first stage to build a predictive model. We found that nearly 65% of the pathways had the cross-validated AUC lower than (or very close to) 0.5. The second-stage predictive model was built with the LOOCV pathway scores as new predictors with the hierarchical ordinal model approach. A 10-fold cross-validation with 10 replicates was carried out to validate the predictive performance of the final predictive model.
The cross-validated deviance, AUC, MSE and mis-classification for the two-stage approach are presented in Table 3. For the original five-level ordinal drug response outcome in Mulligan et al. (2007), the cross-validated deviance of the final predictive model was 472.600 (± 4.483), AUC was 0.585 (± 0.013), MSE was 0.142 (± 0.001) and mis-classification was 0.193 (± 0.004). For the combined three-level ordinal drug response outcome in Mulligan et al. (2007), the cross-validated deviance of the final predictive model was 335.801 (± 3.879), AUC was 0.652 (± 0.009), MSE was 0.199 (± 0.002) and mis-classification was 0.287 (± 0.006).
Measures of predictive performance for the two-stage and gene-based model approaches from 10-fold cross-validation with 10 replicates
| Deviance | AUC | MSE | Mis-classification | ||
|---|---|---|---|---|---|
| Mulligan et al. (2007) | |||||
| Five-level ordinal outcome | Two-stage approach | 472.600 (4.483) | 0.585 (0.013) | 0.142 (0.001) | 0.193 (0.004) |
| Gene-based model | 540.712 (8.214) | 0.584 (0.014) | 0.153 (0.002) | 0.216 (0.006) | |
| Three-level ordinal outcome | Two-stage approach | 335.801 (3.879) | 0.652 (0.009) | 0.199 (0.002) | 0.287 (0.006) |
| Gene-based model | 433.340 (8.695) | 0.593 (0.011) | 0.244 (0.004) | 0.391 (0.007) | |
| Terragna et al. (2016) | |||||
| Five-level ordinal outcome | Two-stage approach | 264.827 (6.176) | 0.799 (0.012) | 0.117 (0.003) | 0.166 (0.011) |
| Gene-based model | 402.730 (8.526) | 0.670 (0.012) | 0.153 (0.002) | 0.225 (0.008) | |
| Three-level ordinal outcome | Two-stage approach | 163.405 (7.289) | 0.834 (0.011) | 0.134 (0.006) | 0.186 (0.012) |
| Gene-based model | 262.964 (6.490) | 0.631 (0.016) | 0.211 (0.005) | 0.314 (0.010) | |
Note: The values in parentheses are the standard errors over the replicates.
For the original five-level ordinal drug response outcome in Terragna et al. (2016), the cross-validated deviance of the final predictive model was 264.827 (± 6.176), AUC was 0.799 (± 0.012), MSE was 0.117 (± 0.003) and mis-classification was 0.166 (± 0.011). For the combined three-level ordinal drug response outcome in Terragna et al. (2016), the cross-validated deviance was 163.405 (± 7.289), AUC was 0.834 (± 0.011), MSE was 0.134 (± 0.006) and mis-classification was 0.186 (± 0.012).
4.4 Pathway-structured predictive model superior to gene-based model in prediction performance
We compared the two-stage approach with the gene-based model analysis that ignores the pathways information. For the gene-based model analysis, we simultaneously fit all the genes that were used in the two-stage approach using the hierarchical ordinal logistic model. We also used 10-fold cross-validation with 10 repeats to validate the predictive performance of the gene-based model. The cross-validated deviance, AUC, MSE and mis-classification for the gene-based model approach are presented in Table 3. We can see that the two-stage approach provided much lower deviance, MSE and mis-classification rate, and higher AUC than the gene-based models and thus significantly outperformed the gene-based models for both datasets.
4.5 Identified significant pathways and their biological relevance
Our two-stage approach is capable of identifying associated relevant pathways. Figure 1 shows the estimated effects and P-values of the identified significant pathways with the two-stage approach for the five-level ordinal outcome and gene expression data from Terragna et al. (2016). Four associated pathways have been identified with the significance level of 0.05. Among them, ErbB signaling pathway has been found to be frequently overexpressed by carcinoma cells (Lu and Kang, 2010; Normanno et al., 2006). Resistance to EGFR inhibitors (ErbB family of receptors) could be induced by frequent mutations within the EGFR pathway in MM (Chen et al., 2015). Aggarwal et al. (Aggarwal et al., 2006) discussed the role that chemokines and chemokine receptors play in the pathogenesis of MM and concluded that addition of chemokine antagonists to current treatment regimens for myeloma could result in better therapeutic responses. Podar et al. (Podar and Anderson, 2007) found that VEGF inhibitors could improve patient outcome in MM. On the other hand, five associated pathways have been identified with the significance level of 0.05 with the two-stage approach for the three-level ordinal outcome in Terragna et al. (Terragna et al., 2016). They are MAPK signaling pathway, Chemokine signaling pathway, Epithelial cell signaling pathway in Helicobacter pylori infection, influenza A pathway and Herpes simplex infection pathway, among which only one pathway is overlapped with the results from the five-level ordinal outcome.
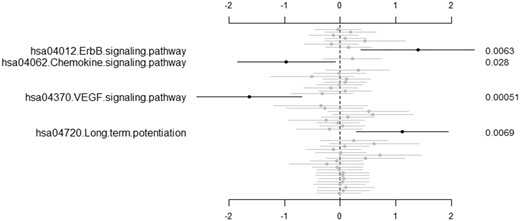
The second-stage predictive model for the five-level ordinal outcome and gene expression data from Terragna et al. (Terragna et al., 2016): estimated values of pathway effects (points), 95% confidence intervals (short lines) and P-values (right side). Only significant pathways with P-value lower than 0.05 are labeled
5 Discussion
We present a two-stage approach to incorporate the functional structure of pathways to predict response to drugs in cancer treatment. It is considered highly important to predict drug response for cancer patients, since the response to treatments, such as chemotherapeutic agents, are variable with potentially lethal side effects (Geeleher et al., 2014; Jiang and Wang, 2010). Our proposed method builds a predictive model based on an informative pathway-based data matrix, which is reduced from a high-dimensional large-scale gene matrix. There are two remarkable features in reducing the large-scale molecular matrix to a predictable pathway-based matrix: (i) it incorporates the correlation with drug response in calculating risk scores for each pathway; (ii) LOOCV was used to calculate the risk score, which not only prevents overfitting but also gives an unbiased summary of the contribution from different pathways to build the final pathway-structured prediction model.
An issue that rises in predicting cancer drug response is that the multi-level ordinal drug response will commonly be combined into a simplified binary variable. As we know, one major goal in drug response prediction is to determine the probability that a patient belongs to a certain response category based on their clinical and molecular features. Thus, the strategy to reduce the number of categories is considered to not only risk the loss of information in the data but also cannot provide informative accurate prediction (Warner, 2008). To address this issue, we employed a hierarchical ordinal regression model in our two-stage approach. It allows the direct modeling of the original multi-level ordinal drug response.
We propose to use Cauchy priors on coefficients in the hierarchical ordinal logistic models. Cauchy distributions have a peak at zero and long tails, thus performing weak shrinkage for large coefficients and strong shrinkage for irrelevant coefficients (Gelman et al. 2008, 2014), and also allow for easy and stable computation with the quasi-Newton algorithm. Some other priors can be used in the hierarchical ordinal logistic models. Possible choices may be the normal and double-exponential priors, which lead to the popular penalization approaches, ridge and lasso regressions, respectively (Hastie et al., 2015). The normal prior equally shrinks large and small coefficients and thus is not appropriate for identifying important predictors in high-dimensional settings. A remarkable feature of the double-exponential prior is that coefficients can be estimated exactly to zero if the model is fitted by the coordinate decent algorithm (Friedman et al., 2010; Simon et al., 2011). However, the coordinate decent algorithm has not been developed for ordinal logistic models. With the quasi-Newton algorithm, the double-exponential prior has no particular advantage.
We applied our two-stage approach in two publicly available datasets, which assessed responses to bortezomib in relapsed MM patients (Mulligan et al., 2007) and VTD in newly diagnosed MM patients (Terragna et al., 2016). Unlike the original papers which combined the five-level ordinal outcome as a binary outcome, we analyzed the datasets by using the original ordinal drug responses without reducing the number of categories for prediction. Our analysis results show that the predictive performance from VTD in new MM patients (Terragna et al., 2016) can be much improved than treating relapsed MM patients with bortezomib alone (Mulligan et al., 2007). To avoid low frequencies in several levels of ordinal five-level outcomes, we re-defined the five-level drug response as a three-level ordinal drug response in both datasets. For either original or re-defined outcome, the pathway-structured predictive models perform consistently better than the gene-based models using the hierarchical ordinal logistic regression model, in terms of much lower deviance, MSE, mis-classification rate and higher AUC, in both datasets. It is also noteworthy that AUC increased and deviance decreased with a trade-off in increased MSE and mis-classification rate in the analysis results using reduced three-level ordinal drug response, when compared with the results from the original outcome. It implies that combining ordinal outcome could result in higher MSE and mis-classification rate. Thus, it infers that combining ordinal outcome could lead to inaccurate informative prediction and mis-leading interpretation with possible arbitrary choices of recoding. These findings could also be supported by our identified associated pathways in VTD treated new MM patients (Terragna et al., 2016). Four associated pathways have been identified with the significance level of 0.05 using the five-level drug response in our two-stage approach, including ErbB signaling pathway, chemokines signaling pathway, VEGF signaling pathway and long-term potentiation pathway. Among them, the first three pathways have been widely investigated for their significant roles played in the pathogenesis of MM. On the other hand, there are five associated pathways identified with the significance level of 0.05 using the two-stage approach for the re-defined three-level ordinal outcome in VTD treated new MM patients (Terragna et al., 2016). They are MAPK signaling pathway, Chemokine signaling pathway, Epithelial cell signaling pathway in Helicobacter pylori infection, influenza A pathway and Herpes simplex infection pathway. There is only one pathway overlapped with the results from the five-level ordinal outcome. The differences between two outcomes also show that arbitrary recoding of ordinal response could be mis-leading in biological interpretation, thus severe incorrect information in the clinical application.
We note that only gene expression data have been used to build the pathway-structured model in this study. Our two-stage approach is directly applicable to include other clinical and molecular factors which may contribute to the predictive classifier of drug response in MM. Due to the limitations of the public datasets available, we did not incorporate those in real data analysis. We consider this matter as a subject for further work. It is also necessary to perform further research to assess the relevance of certain biomarkers in those associated pathways. Relevant biomarkers may provide extraordinary opportunities to elucidate the mechanisms of therapies in MM and to develop new diagnostics and therapeutic targets.
Funding
This work was supported in part by research grants from USA National Institutes of Health (R03-DE025646), National Natural Science Foundation of China (81673448, 81670191), Natural Science Foundation of Jiangsu Province China (BK20161218, BK20161223) and The Applied Basic Research Programs of Suzhou City (SYS201546). A Project Funded by the Priority Academic Program Development of Jiangsu Higher Education Institutions.
Conflict of Interest: none declared.
References
Author notes
The authors wish it to be known that, in their opinion, the Xinyan Zhang and Bingzong Li authors should be regarded as Joint First Authors.

