


Abstract
Intracellular signalling is realized by complex signalling networks, which are almost impossible to understand without network models, especially if feedbacks are involved. Modular Response Analysis (MRA) is a convenient modelling method to study signalling networks in various contexts.
We developed the software package STASNet (STeady-STate Analysis of Signalling Networks) that provides an augmented and extended version of MRA suited to model signalling networks from incomplete perturbation schemes and multi-perturbation data. Using data from the Dialogue on Reverse Engineering Assessment and Methods challenge, we show that predictions from STASNet models are among the top-performing methods. We applied the method to study the effect of SHP2, a protein that has been implicated in resistance to targeted therapy in colon cancer, using a novel dataset from the colon cancer cell line Widr and a SHP2-depleted derivative. We find that SHP2 is required for mitogen-activated protein kinase signalling, whereas AKT signalling only partially depends on SHP2.
An R-package is available at https://github.com/molsysbio/STASNet.
Supplementary data are available at Bioinformatics online.
1 Introduction
Cells constantly receive external cues that are integrated by signalling networks in the cell to direct their cell fates. The topology of those signalling networks is understood to a great extend (Caron et al., 2010; Oda et al., 2005). However, the complexity of these networks makes it difficult to predict what the outcome of a perturbation would be, as feedbacks and cross-talk render intuitive reasoning impossible.
During the last years, several approaches have been developed that apply computational models to tackle this problem. These approaches range from Boolean models that use logical rules to abstract the interactions between the elements of the network (Grieco et al., 2013) to complex models based on differential equations that model details of the reaction kinetics (Raue et al., 2015) or more phenomenological stimulus-response kinetics (Korkut et al., 2015). Boolean approaches have proven useful to predict the outcome in response to major alterations such as mutations or copy number alterations, but they fail to explain more subtle differences between cells and have problems to describe dynamic processes or effects of feedbacks (Saadatpour and Albert, 2013). On the other side of the spectrum, differential equations can be used to describe the system in details. However, fitting those models requires a tremendous amount of data, limiting them to a very small scale. Intermediate approaches typically require a limited amount of data and model quantitative responses of the signalling networks to perturbations. Those methods have the major advantage of providing a way of simulating complex networks with relatively little data. Modular Response Analysis (MRA) is an example of such approaches, where the individual phosphorylation and dephosphorylation events of kinases and phosphatases are abstracted as influences between modules (Kholodenko et al., 2002). MRA was first formulated as a matrix inversion problem, and the corresponding singular value decomposition approach has been used to study the activation of the MAPK cascade by nerve growth factor (NGF) and epidermal growth factor (EGF) (Santos et al., 2007). A maximum-likelihood formulation has been developed to study regulatory interactions between signalling, proteins and mRNA (Stelniec-Klotz et al., 2012), and refined to predict drug combinations to overcome resistance mechanisms (Klinger et al., 2013). MRA has been extended using Bayesian methods to integrate prior information (Halasz et al., 2016).
In this article, we describe an R-package that implements an augmented version of MRA that extends a method that we previously developed (Klinger et al., 2013). This package contains a number of features not described previously that make it particularly suited to model networks using perturbation data and apply it to data from (isogenic) cell line panels. These include, (i) estimates of the confidence intervals for the estimated response coefficients allowing to compare models; (ii) semi-automatic network extension and reduction to refine literature networks; (iii) improved numerical methods for response coefficient estimation and (iv) visualization of the results and networks.
We benchmark our approach using data from a public modelling challenge and illustrate how the approach can be applied by modelling the role of PTPN11 (SHP2) in epidermal growth factor receptor (EGFR) signalling. To this end we modelled the networks of a colon cancer cell line and a PTPN11 knock-out (KO) derivative, which shows that PTPN11 is required to activate mitogen-activated protein kinase (MAPK) signalling, but has little influence on PI3K/AKT signalling, which contradicts previous literature (Wu et al., 2001). Our results show how modelling perturbation data of isogenic cell lines can help to uncover the role of individual proteins in signalling networks. We provide our method as an open-source R-package called STeady-STate Analysis of Signalling Networks (STASNet).
2 Materials and methods
2.1 STASNet implementation and availability
The core functions of STASNet are implemented in C++ which are accessible via wrapper functions in R. STASNet is available as an R-package under https://github.com/molsysbio/STASNet. It requires GiNaC for symbolic computation. STASNet provides dedicated analysis functions to perform (i) profile likelihood computations to estimate confidence intervals, (ii) pre-estimation of local response coefficients to reduce the exploration space using linear regression, (iii) semi-automatic network extension, (iv) automatic pruning of the network and (v) visualization of the network, the response coefficients and the confidence intervals. For details, see below.
2.2 Modular response analysis
MRA allows to infer the direct interaction strengths between pairs of nodes in a network, termed local response coefficients, from the changes in steady-state induced by perturbations, termed global response coefficients. STASNet incorporates non-linear effects of inhibitions as described in Klinger et al. (2013) and computes the global response coefficient matrix R as , where s and i are coefficients of stimulation and inhibition, respectively, and is the local response coefficient matrix, scaled to accommodate the non-linear effect of the inhibitors. The derivation and definition of the matrices/coefficients are detailed in Supplementary Material S1.
2.3 (Semi-)automatic network refinement
We use the likelihood-ratio test to perform (semi-)automatic network refinement. For network extension, we exhaustively add all possible links individually to the network and refit the data. For the network(s) having the best likelihood, we calculate P-values using the likelihood-ratio test that is based on the χ2-distribution between the log-likelihoods under the null hypothesis. Typically, there are a number of equivalent networks that all improve the likelihood to the same level. Therefore, at each step the modeller has to choose one link (e.g. which is best supported by literature). For network reduction, we test how removal of each link decreases the likelihood, and automatically reduce the network iteratively by removing the link which results in the best likelihood until removal of any link results in only significant decreases in likelihood, as quantified by a likelihood-ratio test.
2.4 Model fitting and coefficient pre-estimation
Numerical estimation of the local response and perturbation coefficients was performed by minimizing the log-likelihood that is given by the sum of squared differences between data and model fit, scaled by the measurement error (see Supplementary Material S1). Numerical optimization is done using multiple runs of the Levenberg–Marquardt algorithm which is initialized using Latin hypercube sampling from a normal distribution (default: μ = 0, σ = 2). For local response coefficients between incoming and outgoing nodes that are both measured, STASNet optionally uses pre-estimations derived from a linear log-fold-change relationship as starting values (Supplementary Material S5). Data of incoming nodes that were inhibited are disregarded for pre-estimation.
2.5 Profile likelihood analysis
STASNet implements profile likelihood calculation for the local response and perturbation coefficients as described in Raue et al. (2009). Briefly, for each coefficient a likelihood profile is generated by refitting the model with one coefficient kept constant at different values around its optimum. These profiles are used to detect non-identifiable coefficients, which correspond to an over-parametrization of the model relative to the data available and to assess the reliability of parametrization by calculating the pointwise confidence interval (see e.g. Fig. 5C).
2.6 Visualization
STASNet uses Rgraphviz to visualize the final networks including numerical coefficients and the experimental design (i.e. perturbed and measured nodes, see e.g. Fig. 4). It also contains functions to display the coefficients and their confidence intervals as well as data, model fits and simulations.
2.7 Generation of perturbation data
All cell lines are derived from the colon cancer cell line Widr. Cell lines were cultured in RPMI Medium 1640 (Gibco, Life Technologies) with indicator, L-glutamine 20 nM, 100 U/ml Penicillin and Streptomycin, and 10% FCS. After serum starving for 24 h, the cells were treated 90 min before harvesting with an inhibitor (MEK: AZD6244 1 μM, PI3K: GDC0941 1 μM, pan-RAF: Sorafenib 10 μM, BRAF600E: Vemurafenib 10 μM; all SelleckChem) or DMSO, and 30 min before harvesting with a ligand (EGF 20 ng/ml, NRG1 25 ng/ml, HGF 25 ng/ml; all R&D System) or BSA. The cells were then lysed with Bio-Plex Pro Cell Signalling Reagent Kit (Bio-Rad) and multiplexed by incubating with antibody-coated magnetic beads as described previously (Klinger et al., 2013) detecting the signals: , , , , , and . The plates were read using Bio-Plex Protein Array system (Bio-Rad, Hercules, CA) and the resulting .lxb files were processed using the R-package lxb and a custom script to generate MIDAS-formatted files (Supplementary Material S3).
2.8 DREAM4 challenge 3 availability
All input files (i.e. literature network, training and prediction data) as well as evaluation scripts, description and leader board tables are available at https://www.synapse.org/#Synapse:syn2825304/wiki/71129.
3 Results
3.1 A pipeline to model signal transduction networks from perturbation data
We developed a computational pipeline called STASNet to model signalling networks from perturbation data using MRA. It is based on a previously established maximum-likelihood formulation of MRA (Stelniec-Klotz et al., 2012), and extensions that cover the effects of inhibitors on interactions and a path computation to account for non-identifiable coefficients (Klinger et al., 2013); for details confer Materials and methods, and Supplementary Material S1.
In the following we describe the typical steps to model and analyse the data (see also Fig. 1): given a (prior knowledge) structure of the signalling pathway and the experimental layout (i.e. which nodes are stimulated or inhibited, and which nodes are measured), our algorithm constructs an MRA-based model. Briefly, the algorithm constructs a symbolic local response matrix (i.e. a normalized Jacobian matrix), inverts this matrix and then computes symbolic expressions for the global response matrix. Next, data on signalling node activity (such as phosphorylation of kinases) before and after perturbation by e.g. ligands and inhibitors are used to estimate the coefficients using a maximum-likelihood approach. By iteratively probing if addition of links significantly increases fit quality, or removal of links does not alter fit quality significantly, the network can be refined. Once a model with reasonable fit quality is generated, its coefficients can be analysed (and confidence intervals computed) using profile likelihood. Models that were generated for different cell lines can be compared, and model simulations can be used to predict unseen perturbations.
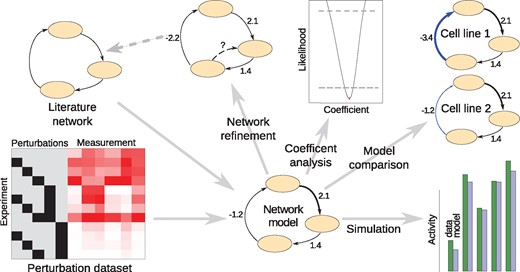
Features of the STASNet package STASNet uses network structure, experimental design and perturbation data as inputs to generate a signalling network model. This model can then be used to suggest modifications in the network structure that are necessary to explain the data (network refinement), analysed with profile likelihood (Raue et al., 2009) (coefficient analysis), compared to models from other cells (model comparison) or used to simulate the response of the network to—also novel—perturbations (simulation)
3.2 STASNet model derivation example
We will next illustrate the computations of STASNet on a small example consisting of a cascade of three nodes (A, B and C), where the last node (C) inhibits the first (A), and a ligand S stimulates A. We further presume node A can be inhibited and that node B is not measured (Fig. 2A). From this scenario we can derive four different conditions: control, stimulation of A by S, inhibition of A and a combination of the two perturbations. Our STASNet pipeline requires three input files (Fig. 2C) containing (i) the perturbation data in Minimum Information for Data Analysis in Systems Biology (MIDAS) format (.csv) (described in Saez-Rodriguez et al., 2008), (ii) the network structure as a two-columned table describing the links (.tab) and (iii) the nodes with basal activity (.dat). The latter file lists all signalling nodes in the network that have basal activity, i.e. those nodes where inhibition alone leads to decreased activity in downstream nodes, as discussed below. From these input files, STASNet derives the symbolic local response matrix, from which, after inversion, it computes the symbolic global response coefficients which are then used to model the data. They represent the log-fold-changes for each measured node in response to the perturbations.
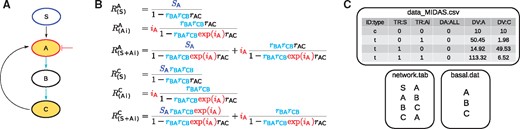
Example of STASNet inputs and the underlying symbolic equations. (A) Perturbation scheme: stimulation of S (blue outline), inhibition of A (red outline) and measurement of A and C (yellow highlight). (B) Symbolic equations of selected global responses generated by the package. As node B is neither measured nor perturbed, rBArCB is treated as one structurally identifiable coefficient by STASNet. The inhibitory coefficients are depicted in red. (C) Input files for STASNet: data_MIDAS.csv specifies the experimental layout in (A), network.tab contains the network structure and basal.dat the nodes that have basal activity
Examples of such global response coefficients are shown in Figure 2B. The first equation describes the global response of node A to stimulation S. It should be noted that the two local response coefficients rBA and rCB, that describe the strength of signalling between A and B, and B and C, respectively, cannot be inferred from the data separately, as node B is not measured. STASNet analyses the equations to re-parameterize the model using Gaussian elimination, as described previously (Klinger et al., 2013). In brief, the algorithm detects coefficients that only occur together in products or ratios, and defines new identifiable coefficient combinations (or paths, see Supplementary Material S1). In our example, the re-parametrization defines a new path that represents the product .
The second equation in Figure 2B shows the global response of A to the inhibition of A. Here we assume that A has basal activity, i.e. the inhibitor perturbs downstream signalling with a coefficient iA independently of upstream activation of A. Without basal activity of A, this response would be 0. In addition to being a perturbation on downstream nodes, inhibition of A also alters the local response coefficients, which we model by multiplying the respective control coefficients with . This altered response coefficient is visible in the effect of feedbacks (subtracted in the denominator).
3.3 Benchmark on signalling network DREAM challenge
To evaluate the STASNet pipeline on an experimental dataset we decided to apply our methodology to data of the Dialogue on Reverse Engineering Assessment and Methods (DREAM) project (round 4, challenge 3, Prill et al., 2011). The task of this challenge was to predict seven phosphosignal responses in HepG2 liver cells by a minimal network model. The participants were supplied with a generic prior knowledge network and a training dataset consisting of a combination of single inhibitions and single stimulations for 30 and 180 min (Fig. 3A and B top). From this, a set of dual inhibitions/stimulations (at 30 min) had to be predicted (Fig. 3B bottom) and the prediction quality together with network size was evaluated.
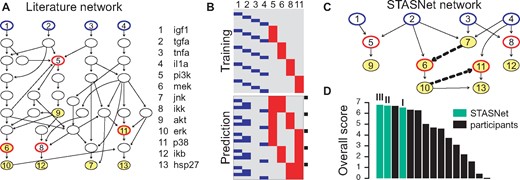
STASNet performance on DREAM signalling prediction challenge LEFT Input provided by challenge organizers (A) prior knowledge network with measured and perturbed nodes indicated as in Figure 2. (B) Perturbation scheme for provided datasets to train and predict. Perturbations in prediction marked by black squares were additionally given. Numbers indicate nodes in A. RIGHT Performance of STASNet (C) optimal network derived by STASNet using repetitively the features reduction, extension (dashed links), profile likelihood and non-identifiability analysis. (D) STASNet scores ranked amongst original participants. Overall score is second best when modelling the above network on training data (I). By refitting the inhibitor strengths (II) or all coefficients (III) to the disclosed subset of the prediction data STASNet ranks first. Details in Supplementary Material S6
We trained a STASNet model on the provided literature network using the training data provided for 30 min single stimulation. Using STASNet’s network refinement feature, we removed insignificant and redundant links using likelihood-ratio tests and profile likelihood, respectively, reducing the network by 21 links. Next, we searched for significantly contributing missing links (χ2, q ≤ 0.05) and extended the network by two edges (Fig. 3C, dashed links). Afterwards, we shrunk the combinations of coefficients termed identifiable by our method to be represented by a single link, further reducing the network by 21 links. In a subsequent reduction and extension round two more links were removed. Thus, using STASNet we adapted the literature network from 58 to 16 edges (Fig. 3C).
We then simulated the combinatorial perturbations and submitted these to the scoring functions of the challenge providers. Among the 12 original participants, the STASNet prediction ranks second (Fig. 3DI). However, the DREAM challenge participants were also given some part of the test data to re-calibrate their methods, as training and test data were from different batches. When we also used this data to refit either the inhibitor strength or all link coefficients to the pre-given part of the prediction dataset, STASNet predictions were ranked first (Fig. 3DII and III). Thus, constructing a MRA-based model using the functions of the STASNet package allowed to make predictive models that can compete with other, more complex approaches such as ODE-based strategies that require more data and can integrate time-series data (Prill et al., 2011, see an exhaustive description in Supplementary Material S6).
3.4 Perturbation data for RTK signalling in a colorectal carcinoma cell line
Having confirmed the validity of STASNet in signal transduction modelling, we used the pipeline to study a specific biological question by investigating the role of PTPN11, a phosphatase that is important in receptor tyrosine kinase (RTK) signalling and has been implicated in feedback control of EGFR signalling and drug resistance (Prahallad et al., 2015). To do so, we chose to generate a model of RTK signalling in the colorectal cancer cell line Widr containing an activating BRAFV600E mutation, and then to compare this model with a model of the same cell line, where PTPN11 is inactivated using CRISPR/Cas9.
We generated a time series after stimulation with EGF, to assess at which time point the signalling networks are in quasi steady-state (see Supplementary Material S5), which is a pre-requisite for applying MRA. We noticed that after 30 min, the initial strong transient response has passed and signalling reaches some stable plateau, and chose 30 min as an appropriate time point for stimulation. To parameterize the model, we measured the phosphorylation state of seven kinases involved in MAPK and PI3K signalling, and their response to three ligands (EGF, HGF and NRG1) and two inhibitors (MEK and PI3K inhibitors), alone and in combination (see Fig. 4A). We performed linear regression between those nodes that were directly connected and measured (see Materials and methods and Supplementary Material S5), and confirmed that these network responses were locally linear in logarithmic space, complying with MRA requirement.
![Building and adapting a network model using STASNet (A) experimental data of human CRC Widr cell line and simulation results from the initial literature-derived network [depicted in (B)]. Grey squares indicate missing values. (B) Kinase interaction network, including experimental design with measured (yellow), stimulated (blue) and inhibited (red) nodes. Updates from the initial network are indicated by bold links: removal of RAS→PI3K, and addition of ERK→mTOR. (C) Profile likelihood of paths containing a link between receptors and AKT computed for the initial network. Red marks indicate the fitted value of the primary coefficient. (D) Top links suggestion with equal improvement from the network extension feature. (E) Data (middle) to model comparison of mTOR response with (right) or without (left) the ERK →mTOR link](https://oup.silverchair-cdn.com/oup/backfile/Content_public/Journal/bioinformatics/34/23/10.1093_bioinformatics_bty473/2/m_bioinformatics_34_23_4079_f5.jpeg?Expires=1716325756&Signature=RmN-0TMjqdzxvLKlq9NSUiNYqWyavDtNdlskzsZQ-7Yg3rviQJjZdzHu-luVILWkBDjv4VEWSLZZQ7f3CuKxatXSkh~-Q0-DeiEZ~Nz9TFHGYVruefY5V7tnMWiutcO8fo~kBp043mZRu2OdJ87kH~N33S4qTfNksK9fyH58aMr25uX8VIH4z4Uoz4RcoEvVpb1X6aXPljHJbG~Ex~jiCh3bxmlJCCL16SjuQwhn62-WHmEWq689p7WetXUSnK20KNTswJv-5lprsc9O16op903SN67WXOFgXkIfSVQ87I35FXFF0lPM~5vuGl1agtA~r9bcmXDlLxVnnY7t-MQbqg__&Key-Pair-Id=APKAIE5G5CRDK6RD3PGA)
Building and adapting a network model using STASNet (A) experimental data of human CRC Widr cell line and simulation results from the initial literature-derived network [depicted in (B)]. Grey squares indicate missing values. (B) Kinase interaction network, including experimental design with measured (yellow), stimulated (blue) and inhibited (red) nodes. Updates from the initial network are indicated by bold links: removal of RAS→PI3K, and addition of ERK→mTOR. (C) Profile likelihood of paths containing a link between receptors and AKT computed for the initial network. Red marks indicate the fitted value of the primary coefficient. (D) Top links suggestion with equal improvement from the network extension feature. (E) Data (middle) to model comparison of mTOR response with (right) or without (left) the ERK →mTOR link
3.5 Adapting the literature signalling network
Apart from the perturbation data, our modelling framework requires the signalling network topology as input. The MAPK and PI3K pathways are well studied, which allowed us to generate a literature-derived interaction network (Fig. 4B). The network consists of the three ligands, their receptors, RAS, PI3K and RAF as unmeasured signalling intermediates, the measured pathway components of AKT and MAPK signalling and pathway targets that include mTOR (as an AKT target) and GSK3, p90RSK and RPS6 as common targets of both signalling pathways. In addition, we included two well-studied feedback loops in MAPK signalling (ERK→RAF and ERK→EGFR) that are known to play a role in drug resistance (Fritsche-Guenther et al., 2011; Klinger et al., 2013).
The model contained 19 coefficients that represent either entries of the local response matrix (or lumped combinations of them), or inhibitor strengths. When estimating these 19 coefficients using a maximum-likelihood procedure, the weighted sum of squared residuals was 52, which is compatible with the 74 measurements. An interesting aspect of the network are the different modes of activation of the two pathways: while the MAPK pathway is solely activated through RAS, AKT is activated both in a RAS-independent and -dependent way (Hemmings and Restuccia, 2012). However, as we neither measure nor perturb elements of these two pathways leading to AKT activation, their coefficient values cannot be estimated independently. This is known as structural non-identifiability. Our pipeline allows to calculate the profile likelihood for the model, which shows the change in maximum-likelihood when one (primary) coefficient is varied (Raue et al., 2009). When plotting the profile likelihoods and the optimized coefficients, this structural non-identifiability is directly visible by flat profiles and compensatory changes in related (secondary) coefficients (Fig. 4C). To resolve this, the model can be reduced by removing one of the links HER2→PI3K, RAS→PI3K, Met→PI3K or EGFR→PI3K without changes in the likelihood (Supplementary Material S2). As all three models have the same likelihood, we decided to remove the link RAS→PI3K as it separates the PI3K and RAF cascades (Fig. 4B) and allows for more straight forward interpretation of the coefficients. It also leads to a numerically more stable model and results in a network model where all links are identifiable.
When comparing the data and the model fit, we noticed that although in general the data can be reproduced reasonably well, there are some discrepancies for mTOR upon PIK3 inhibition (see Fig. 4E model versus data). To investigate if any additional links can resolve these discrepancies, we use the extension suggestion feature of STASNet (Supplementary Material S2). Briefly, this feature tests all possible links, ranks them according to their likelihood and evaluates their significance. We noticed that adding a link to mTOR from any of the nodes MEK, ERK, p90RSK or RPS6 does improve fit quality equally well (Fig. 4D). Since the experimental setup did not permit us to discriminate these links we searched the literature and could only find a proof for ERK activation of mTOR by inhibiting mTOR inhibitory complex protein TSC2 via phosphorylation of serine 664 (Rolfe et al., 2005). We thus updated the network to include this link (Fig. 4B), which led to an improved fit (Fig. 4E).
3.6 Assessing the effect of SHP2 knock-out with STASNet
After having established a model for the cell line with wild-type SHP2, we next aimed to model the network when SHP2 is inactivated. For this, we used a SHP2 KO cell line derived from the Widr cell line using CRISPR/Cas9 (Prahallad et al., 2015). SHP2 (PTPN11) is a phosphatase that binds to the tyrosine kinase receptors through adaptors such as GAB1 and participates in the activation of the MAPK cascade by relieving inhibitions on RAS and RAF. SHP2 has been shown to be re-activated in BRAF inhibition resistant cell lines (Prahallad et al., 2015) (Fig. 5A).
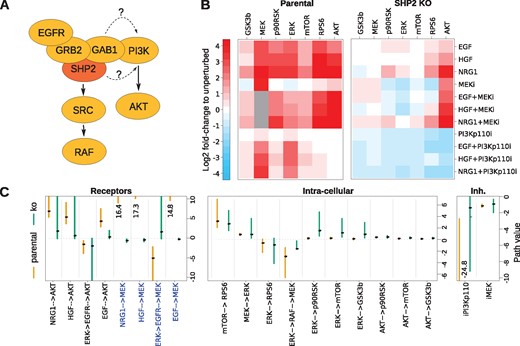
Comparative analysis of SHP2 KO with parental cell line (A) literature knowledge of the role of SHP2 in EGFR signalling. (B) Perturbation data for the parental and SHP2 KO cell lines. (C) Model coefficients (black dots) with pointwise confidence interval of the respective models. Note that all receptor-MEK links are disabled by SHP2 KO (blue)
We applied the same perturbation experiments to the SHP2 KO cells and compared the response to the parental cell line (Fig. 5B). It is evident that the KO led to a reduction of phosphorylation response throughout the network. We then generated a signalling model for the SHP2 KO cell line, using the network derived for the parental cell line, and obtained a maximum-likelihood fit sufficiently complying with the experimental error. We then quantitatively compared the coefficients fitted for the SHP2 KO to those fitted for the parental cell line using confidence intervals obtained by profile likelihood (Fig. 5C). For intracellular paths and inhibitors the values between parental and KO cell lines did not significantly differ (Fig. 5C middle and right panel). For the receptor connecting paths we found several coefficients that were significantly (and qualitatively) different between the two cell lines. Four of these coefficients correspond to all paths in the network that connect the receptors to MAPK signalling. While these coefficients are numerically large in the parental cell line, they are close to zero in the SHP2 KO (Fig. 5C, indicated in blue). This confirms the known role of SHP2 as being between the receptor and the activation of RAF (Fig. 5A). Accordingly, the ERK→RAF→MEK feedback is still functional in the SHP2 KO. Surprisingly however, the coefficients corresponding to the activation of AKT by two of the three ligands are not significantly altered, suggesting that SHP2 is only partly required for the activation of the PI3K/AKT pathway (Fig. 5C). Interestingly, the ERK→EGFR→AKT crosstalk is also still functional which indicates that ERK regulation of EGFR does not depend on SHP2.
3.7 Predicting the impact of RAF inhibition
Having generated specific models for the parental and SHP2 KO cells, we can then ask how other perturbations would affect the networks. RAF is an important therapeutic target for which two main classes of inhibitors exist. Some inhibitors, such as Vemurafenib, target specifically mutant BRAF (BRAFV600E,Bollag et al., 2010), whereas others, such as Sorafenib, are pan-RAF inhibitors that inhibit all RAF isoforms (Wilhelm et al., 2004). The Widr cell system that we study harbours the BRAFV600E so we could investigate the effects of these two inhibitor classes in our model and experimentally validate them afterwards.
As we calibrated our model on data where RAF activity was neither directly measured nor perturbed, the RAF→MEK link is only fitted as a part of an identifiable path. We therefore had to augment our model, by including a new node, BRAFV600E mutation that is connected to MEK and receives no upstream signal (Fig. 6A), as the BRAFV600E mutation renders BRAF insensitive to upstream and feedback signals (Friday et al., 2008). Note that since we had to give a reasonable but arbitrary value for the inhibition strength for both RAF inhibitors (set to 3), the resulting predictions can only be understood qualitatively.
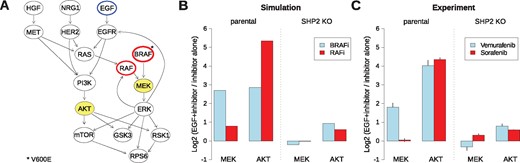
Predicting effects of RAF inhibitors (A) localization of RAF and BRAF inhibition in the network derived for the Widr cell line; predicted nodes are highlighted. (B) STASNet simulation of the impact of BRAFV600E and pan-RAF inhibitors on both cell lines (C) experimental measurements of the impact of Vemurafenib (BRAFV600E inhibitor) and Sorafenib (pan-RAF inhibitor) on the parental and SHP2 KO cell lines (error bars in SD, n = 2)
One of the resistance mechanisms for RAF inhibition is the re-activation of the RAF-MEK-ERK signalling pathway and the activation of AKT by loss of feedback inhibition of the EGF receptor (Klinger et al., 2013; Prahallad et al., 2012). We therefore decided to simulate to what extend EGF stimulation rescues MEK and AKT phosphorylation upon RAF inhibition. In our simulation for the wild type model, we noticed qualitative differences between the two inhibitors (Fig. 6B). While EGF stimulation hyperactivates AKT for both inhibitors, it only rescues MEK phosphorylation after treatment with the BRAFV600E -specific inhibitor. This is consistent with the idea that this inhibitor specifically blocks the mutant allele, while the non-mutated allele and other isoforms can still relay the signal. When comparing the simulations of the two different cell line models it can be noted that in the parental model, both MEK and AKT are upregulated with EGF, whereas under SHP2 KO this upregulation is completely blocked for MEK, and is attenuated for AKT (Fig. 6B).
To confirm our model prediction, we performed experiments in which we pre-incubated the cells with either Vemurafenib (BRAFV600E inhibitor) or Sorafenib (pan-RAF inhibitor) for 60 min, then stimulated the cells with EGF for 30 min, and measured AKT and MEK phosphorylation (Fig. 6C). These data are in qualitative agreement with our model predictions, confirming the disruption of the EGF→MEK path and the attenuation of the EGF→AKT path in the SHP2 KO.
4 Discussion
Perturbation-response datasets are key for the analyses of signalling networks and many different approaches have been developed to generate computational models from such systematic datasets. Most of these methods binarize data and use logic approaches to describe the data (Morris et al., 2010), or alternatively, use dynamic information to fit quantitative data (Raue et al., 2015). In this article, we describe an approach that uses an augmented version of MRA (Kholodenko et al., 2002; Klinger et al., 2013), that allows the generation of semi-quantitative models from snapshot perturbation data. We developed an R-package called STASNet, that implements this approach and provides analysis functions to improve and compare models.
In this article, we applied STASNet to model the effect of a SHP2 KO on the MAPK and PI3K signalling network. By comparing the coefficients of the MRA models for the two isogenic cell lines we could recover the known role of SHP2 in mediating MAPK signalling. However, it was unclear if SHP2 is required to activate PI3K/AKT signalling in RTK/EGFR signalling. We found that PI3K/AKT signalling triggered by the receptors HER2 and HGF is largely independent of SHP2, whereas it is partly dependent on SHP2 when triggered by EGFR.
SHP2 has been implicated in resistance of BRAF mutant colorectal carcinoma, where loss of feedback to SHP2/EGFR leads to re-activation of MAPK signalling after treatment with BRAF inhibitors (Prahallad et al., 2015). Our study confirms that SHP2 has a major role in re-activation of MAPK signalling, as our model predictions show and the data confirm that MEK phosphorylation cannot be recovered in SHP2 KO with EGF. The data further confirms the model prediction that with functional SHP2, pan-RAF inhibitors also prevent activation of the MAPK pathway, and may be considered an alternative treatment option to prevent resistance.
When we applied STASNet to a dataset of the DREAM challenge, it ranked first compared to the 12 DREAM challenge participants. This confirms that modelling using the MRA methodology is a working compromise between complexity and prediction quality, as scoring was done using network size and prediction quality. It also shows that using quasi steady-state data at 30 min for growth factor signalling is a valid approach to parameterize efficient network models. It furthermore shows that the linearity assumption inherent to MRA is not hampering the potential to make quantitative predictions.
Only few other approaches exist to deal with single time point steady-state signalling perturbation data. CellNOptR (Terfve et al., 2012) can be applied to such data after discretization or normalization of the data, which implies to define thresholds and might require external data. Other more precise approaches like CNORode (Terfve et al., 2012) or Data2Dynamics (Raue et al., 2015) rely on ordinary differential equations and require more data to be parametrized, limiting their application to small networks.
To conclude, STASNet provides a convenient R-package to generate MRA-models using a maximum-likelihood approach for single time point signalling data.
Funding
This work was supported by the Federal Ministry of Education and Research of Germany (BMBF) through grants ZiSS-Trans (02NUK047E), ColoSys and MapTorNet (031A426A), as well as through funding by the Berlin Institute of Health.
Conflict of Interest: none declared.
References

