


Abstract
The recent rise of long read sequencing technologies such as Pacific Biosciences and Oxford Nanopore allows to solve assembly problems for larger and more complex genomes than what allowed short reads technologies. However, these long reads are very noisy, reaching an error rate of around 10–15% for Pacific Biosciences, and up to 30% for Oxford Nanopore. The error correction problem has been tackled by either self-correcting the long reads, or using complementary short reads in a hybrid approach. However, even though sequencing technologies promise to lower the error rate of the long reads below 10%, it is still higher in practice, and correcting such noisy long reads remains an issue.
We present HG-CoLoR, a hybrid error correction method that focuses on a seed-and-extend approach based on the alignment of the short reads to the long reads, followed by the traversal of a variable-order de Bruijn graph, built from the short reads. Our experiments show that HG-CoLoR manages to efficiently correct highly noisy long reads that display an error rate as high as 44%. When compared to other state-of-the-art long read error correction methods, our experiments also show that HG-CoLoR provides the best trade-off between runtime and quality of the results, and is the only method able to efficiently scale to eukaryotic genomes.
HG-CoLoR is implemented is C++, supported on Linux platforms and freely available at https://github.com/morispi/HG-CoLoR.
Supplementary data are available at Bioinformatics online.
1 Introduction
Since a few years, long read sequencing technologies are being developed, and allow the solving of assembly problems for large and complex genomes that were, until then, hard to solve with the use of short reads sequencing technologies alone. The two major actors of these long read sequencing technologies are Pacific Biosciences and Oxford Nanopore. The latter, with the release of the MinION device, that can be run from a simple laptop, allows a low-cost and easy long read sequencing.
Even though long reads can reach lengths of tens of kbps, they also reach a very high error rate of around 10–15% for Pacific Biosciences, and up to 30% for Oxford Nanopore. Due to this high error rate, correcting long reads before using them in downstream problems is mandatory. Many methods are available for short read error correction, but they are not applicable to long reads for two major reasons. First, these methods do not scale to the much higher error rate of the long reads. Second, most of these methods focus on substitution errors, the main error type in Illumina data, whereas insertions and deletions are more frequent in long reads.
1.1 Related works
Recently, several methods for long read error correction have been developed. These methods can be divided into two main categories: either the long reads are self-corrected by aligning them against each other [PBDAG-Con (Chin et al., 2013), PBcR (Berlin et al., 2015)], or either a hybrid strategy, using complementary short reads is adopted. In this case, the short reads can either be aligned to the long reads [Nanocorr (Goodwin et al., 2015), CoLoRMap (Haghshenas et al., 2016)], or be assembled into contig on which the long reads are aligned [HALC (Bao and Lan, 2017)]. De Bruijn graph based methods, where the long reads are corrected by traversing the paths of the graph, also started to develop recently, in the hybrid case [LoRDEC (Salmela and Rivals, 2014), Jabba (Miclotte et al., 2016)], as well as in the non-hybrid case [LoRMA (Salmela et al., 2017), Daccord (Tischler and Myers, 2017, unpublished)]. NaS (Madoui et al., 2015), instead of using short reads to correct the long reads, uses the long reads as templates in order to recruit short reads and assemble them into contigs, used as corrected sequences. This approach requires to align the short reads to the long reads, in order to find seeds, which are short reads that aligned to the long reads. The seeds are then compared to all the other short reads, in order to recruit new short reads, corresponding to low quality regions of the long read.
1.2 Contribution
We introduce HG-CoLoR, a new long read hybrid error correction method that combines two ideas from the state-of-the art: the alignment of the short reads to the long reads (as in CoLoRMAp), and the use of a de Bruijn graph, built from the short reads (as in LoRDEC and Jabba). Unlike these methods, HG-CoLoR however uses a variable-order de Bruijn graph, instead of a classical one. HG-CoLoR thus focuses on a seed-and-extend approach where the seeds, found by aligning the short reads to the long reads, are used as anchors on the variable-order de Bruijn graph. The graph is then traversed, in order to link the seeds together, and thus correct regions of the long reads that are not covered by short reads. Our experiments show that, when compared to state-of-the-art hybrid and non-hybrid long read error correction methods, HG-CoLoR provides the best trade-off between runtime and quality of the results, and is the only method able to efficiently scale to eukaryotic genomes. They also show that the efficiency of HG-CoLoR’s error correction implies satisfying assembly results.
2 Variable-order de Bruijn graph
2.1 de Bruijn graphs
The de Bruijn graph is a data structure that is widely used in assembly tools. Its nodes are defined as the k-mers of the reads, and its edges represent prefix-suffix overlaps of length k − 1 between the k-mers represented by the nodes. However, despite its usefulness, it is known that the de Bruijn graph faces difficulties, due to the fact that the k-mer size is fixed at construction time. On the one hand, choosing a large k will allow the graph to better deal with repeated regions, but will lead to missing edges in insufficiently covered regions. On the other hand, choosing a small k will allow to correctly retrieve the edges of the graph in insufficiently covered regions, but will lead to more branches, and thus more difficulties, in repeated regions.
To overcome these problems, modern assemblers usually build multiple de Bruijn graphs of different orders. Although this approach allows to increase the quality of the assemblies, it also greatly increases both runtime and memory consumption, as multiple graphs need to be built and stored.
More recently, a few methods were developed to allow the representation of all the de Bruijn graphs, up to a maximum order K, in a single data structure. The manifold de Bruijn graph (Lin and Pevzner, 2014), for example, associates arbitrary substrings with nodes, instead of associating k-mers. This structure is however mainly of theoretical interest, as it has not been implemented yet. Another implementation of a variable-order de Bruijn graph has been proposed by Boucher et al. (2015). It relies on the succinct representation of the de Bruijn graph by Bowe et al. (2012), and supports additional operations that allow to change the order of the graph on the fly. However, the current implementation only supports construction up to an order of 64, which is too restrictive, as we do not want to limit the maximum order.
As a result, we introduce a new implementation of the variable-order de Bruijn graph. It relies on PgSA (Kowalski et al., 2015), an index structure allowing to answer various queries about a set of reads.
2.2 PgSA overview
PgSA is a data structure that allows the indexing of a set of reads, in order to answer the following queries, for a given string f:
In which reads does f occur?
In how many reads does f occur?
What are the occurrences positions of f?
What is the number of occurrences of f?
In which reads does f occur only once?
In how many reads does f occur only once?
What are the occurrences positions of f in the reads where it occurs only once?
In these queries, f can be given either as a sequence of DNA symbols, or as a pair of numbers, representing, respectively, a read ID, and the start position of f in this read.
As previously mentioned, in order to answer these queries, an index of the reads has to be built. PgSA builds it as follows. First, all reads with overlaps are concatenated with respect to these overlaps, in order to obtain a pseudogenome. If some reads for which no overlaps have been found are left after the pseudogenome creation, they are simply concatenated at the end of it. Then, a sparse suffix array of the pseudogenome is computed, along with an auxiliary array allowing to retrieve the reads from the original set in the pseudogenome. Each record of this auxiliary array associates a read ID in the original set of reads to a read offset in the pseudogenome, and also contains flag data that bring complementary information about the read and that is used in order to handle the queries. The queries are processed by a simple binary search over the suffix array, coupled with the use of this complementary information.
As the reads are overlapped during the pseudogenome computation, and as PgSA does not record any information about their lengths, it only allows to index and query a set of reads of constant length. However, the length of the query strings is not set at compilation time, and PgSA therefore supports queries for strings f of variable length.
2.3 Variable-order de Bruijn graph representation
A maximum order K is chosen, and the K-mers of the reads are indexed with PgSA, to be able to represent the nodes of all the de Bruijn graphs up to this maximum order. The edges of a given node, for any de Bruijn graph of order k ≤ K, are retrieved by querying the index, using the third query (i.e. what are the occurrences positions of f?), with the suffix of length k − 1 of the k-mer represented by the node. The query returns a set of pairs of numbers, each pair representing a K-mer ID and the occurrence position of the query string in that K-mer. The pairs are then processed, and only those whose position component does not represent the suffix of length k − 1 of the associated K-mer are retained (so that the occurrence can be extended to the right into a k-mer). These extended occurrences represent the k-mers that have a prefix-suffix overlap of length k − 1 with the k-mer represented by the currently considered node, and thus define the edges of this node.
As the edges are retrieved by querying the index, it is also easy to traverse the graph backward. For a given order k, instead of being queried with suffixes of the k-mers represented by the nodes, the index is simply queried with their prefixes. The returned sets of pairs are then processed in the same fashion as for forward traversal, except that only the pairs whose position component does not represent the prefix of length k − 1 of the associated K-mer are retained to define the edges. For better understanding, the algorithm allowing to retrieve the edges of any given node, forward or backward, in the de Bruijn graph of any order k ≤ K, is given in Supplementary Algorithm S1.
3 Materials and Methods
3.1 Overview
As previously mentioned, HG-CoLoR combines two ideas from the state-of-the art: the alignment of short reads to the long reads, and the use of a de Bruijn graph, which has the particularity of being of variable order. To do so, it focuses on a seed-and-extend approach where the seeds are discovered by aligning the short reads to the long reads. A seed is defined as a 5-tuple (id, pos, len, score, seq), where: id is the id of the long read the seed is associated to, pos is the start position of the alignment on the long read, len is the length of the alignment, score is the score of the alignment, and seq is the actual consensus sequence of the short reads which align to the long read at this position. Once the seeds have been retrieved, they are linked together by extending their sequences, with the help of the previously described variable-order de Bruijn graph. This graph is built from the short reads, by choosing a maximum order K and indexing their K-mers with PgSA, and is traversed by querying the index, as previously described. For each long read, the graph is traversed in order to link together the associated seeds, which are used as anchors. The path of the graph that was followed to link two seeds together thus dictates a corrected sequence for the uncovered region of the long read. Finally, once all the seeds have been linked, the tips of the obtained sequence are extended by further traversing the graph, to reach the extremities of the original long read. HG-CoLoR’s workflow is summarized in Figure 1, and its four main steps are described below.
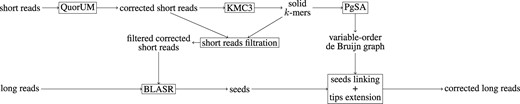
HG-CoLoR’s workflow. First, the short reads are corrected with QuorUM in order to get rid of as much sequencing errors as possible. Then, a maximum order K is chosen for the graph, and the K-mers from the corrected short reads are obtained with KMC3. To further reduce the error rate, a filtration step is applied to the corrected short reads, and those containing weak K-mers are removed. For the same reason, only the solid K-mers from the corrected short reads are indexed with PgSA, to represent the variable-order de Bruijn graph. The previously filtered corrected short reads are then aligned to the long reads with the help of BLASR in order to find seeds. Each long read is then processed independently. For each of them, the graph is traversed in order to link together the associated seeds, used as anchors, in order to retrieve corrected sequences for the uncovered regions of the long read. Then, the tips of the sequence obtained after linking together all the seeds are extended in both directions by traversing the graph, to reach the initial long read’s extremities. Finally, the corrected long read is output
Despite high similarities with other graph based methods, in particular with LoRDEC, using sequences originating from the seeds as anchors on the graph is quite different from using solid k-mers (i.e. k-mers that occur more frequently than a certain threshold) from the long reads. Indeed, in the case of highly erroneous long reads, even short, solid k-mers have a high chance of being erroneous. Such erroneous k-mers would therefore lead to the use of erroneous anchors, and thus to unsatisfying correction results. However, as short reads are accurate, the seeds they yield can be used as reliable anchors, with little to no chance of being erroneous. Moreover, using these seeds as anchors also allows to directly build the graph with large values of k, without needing to perform multiple rounds of correction, and increase the value of k at each step, in the same fashion as LoRMA.
3.2 Short reads correction and graph construction
Even though short reads are already accurate prior to any correction, they still contain a small fraction of errors. As HG-CoLoR seeks to build a variable-order de Bruijn graph of high maximum order from the short reads, as much errors as possible have to be removed from this data, to avoid erroneous paths in the graph. To do so, the short reads are corrected with the help of QuorUM (Marçais et al., 2015), which provides the best trade-off between runtime and quality of the correction, among all the short read error correction tools we tested.
A maximum order K is then chosen for the graph, and the K-mers from the corrected short reads are extracted with KMC3 (Kokot et al., 2017). To further reduce the error rate of the short reads, and thus avoid erroneous seeds and chimeric paths on the graph, short reads containing weak K-mers (i.e. K-mers that appear less than a certain threshold) are filtered out and not used in the following steps, and only the solid K-mers are used to build the graph.
3.3 Seeds retrieving and merging
To retrieve the seeds, the short reads are aligned to the long reads with the help of BLASR (Chaisson and Tesler, 2012). Although it was originally designed to align long reads dominated by insertion and deletion errors to a reference genome, BLASR also manages to nicely deal with this type of errors when aligning short reads to long reads. Each long read is then processed independently, and two phases of analysis are applied to the associated seeds.
First, the seeds are processed by pairs, in ascending order of their alignment start position on the long read. If the alignment positions and alignment lengths of a given pair of consecutive seeds indicate that they overlap over a sufficient length, their assumed overlapping sequences are compared, and the two seeds are merged accordingly. If the assumed overlapping sequences do not coincide, or if the alignment positions and alignment lengths indicate that the two seeds do overlap, but over an insufficient length, only the seed with the best alignment score is kept. The algorithm of this first merging phase is given in Supplementary Algorithm S2.
Second, once all the seeds with overlapping alignment positions have been merged or filtered out, the seeds are again processed by pairs, in ascending order of their alignment start position on the long read, and sequence overlaps between consecutive seeds having close alignment positions are computed. As in the previous step, if a given seed perfectly overlaps the following one over a sufficient length, the two seeds are merged. This step allows to take into account small insertion errors in the long reads that were not detected during the alignment step, and that could lead to difficult linkings in the next step. The algorithm of this second merging phase is given in Supplementary Algorithm S3.
We chose to always align all of the short reads, instead of only a subset of them, because such an approach allows to discover more seeds. Therefore, more long reads, and larger regions of these long reads can be corrected, and smaller parts of the graph need to be explored. Moreover, the proportion of time spent during the alignment step only represents 20–40% of the runtime of the whole method on average, and tends to decrease as the size of the dataset increases. Therefore, aligning only a subset of the short reads instead of aligning them all would not significantly reduce the overall runtime of the method.
3.4 Seeds linking
Once the seeds have been found and merged for all the long reads, HG-CoLoR processes each of the long reads independently and attempts to link together their associated seeds by considering them as pairs, and traversing the graph. For a given pair, the seed that has the leftmost alignment position is called the source, and the one that has the rightmost alignment position is called the target. To link a pair of seeds together, the rightmost K-mer of the source and the leftmost K-mer of the target are used as anchors on the graph. The graph is then traversed, in order to find a path between the two anchors. When such a path is found, the sequence it dictates is used as a correction for the uncovered region of the long read. The search for a path between two seeds is first performed from the source toward the target, and if no path can be found, the search is performed again, from the target toward the source. The search is performed in both directions, because according to the starting point of the traversal, different parts of the graph might be explored, and thus lead to different traversals.
HG-CoLoR traverses the variable-order de Bruijn graph starting from its highest order. The order is decreased at a given node only if this node does not have any edge for the current order, or if all its edges for the current order have already been explored and did not allow to reach the target. When the order of the graph is decreased, the size of the k-mers from the source and from the target is decreased accordingly, so that they can still be used as anchors. A minimum order is also set, so that HG-CoLoR does not traverse de Bruijn graphs representing short, and probably meaningless overlaps.
When facing branching paths for a given order k, HG-CoLoR performs a greedy selection. The edge leading to the node representing the k-mer having the highest number of occurrences is always explored first. This greedy selection allows to avoid traversing too many nodes representing k-mers having low frequencies, that, despite the correction and filtration steps, may contain a sequencing error. Moreover, following the exploration of an edge from a de Bruijn graph of order k < K, due to the fact that no edge was found for larger orders, the order of the graph is always reset to the maximum order K before resuming the traversal, in order to avoid exploring too many branching paths.
When a path between two seeds is found, it is considered as optimal due to the greedy selection and to the fact that the order of the graph is only locally decreased. It is thus chosen as the correction for the uncovered region of the long read. We voluntarily select the optimal path this way, instead of exploring multiple ones and selecting the one that aligns the best to the long read as the correction, in order to avoid prohibitive runtimes.
We also set a mismatches threshold t when linking two seeds together. We therefore consider that the source and the target can be linked together if a path starting from the anchor K-mer of the source (resp. target) reaches a K-mer having less than t mismatches with the anchor K-mer of the target (resp. source). Such a threshold allows to overcome the few mismatches errors that can still be present on the seeds, despite the correction and filtration steps. The case where the two seeds contain an error, however, cannot be properly handled.
Moreover, HG-CoLoR might attempt to link together two seeds that appear in unconnected regions of the graph. For instance, this situation could arise in the case a short read originating from another chromosome was wrongly aligned to the long read. In this case, linking these seeds together would be impossible, as there would exist no path between them. Therefore, to avoid costly explorations of the graph in such cases, a limit on the maximum number of branches explorations is set. If this limit is reached, and no path has been found to link the source and the target, the current linking iteration is given up, and HG-CoLoR attempts to skip the target that could not be reached. In other words, the source remains the same, the target that could not be reached is ignored, the target is redefined as the following seed, and a new linking iteration is performed. An illustration of this process is given in Supplementary Figure S1.
As skipping seeds could however lead to an important number of failed linking attempts, i.e, an impossibility to link two seeds together within the allowed maximum number of branches exploration, a limit on the maximum number of seeds that can be skipped is also set. Once this limit is reached, as none of the linking attempts succeeded, HG-CoLoR fills in the uncovered region of the long read, between the source and the first seed that was skipped, with bases from the original long read. The graph is then traversed again, in order to link together the remaining seeds, starting from the first seed that was skipped, and correct the remaining parts of the long read.
3.5 Tips extension
Finally, it is obvious that the seeds do not always align right at the beginning and at the end of the long reads. Thus, in order to get as close as possible to its original length, once all the seeds of a given long read have been linked, HG-CoLoR keeps on traversing the graph to extend the tips of the produced corrected long read. In the same fashion as in the previous step, the traversal starts from the highest order of the variable-order de Bruijn graph, and the order is decreased at a given node only if this node does not have any edge for the current order. The tips of the corrected long read are thus extended until the original long read’s extremities or a branching path are reached. Indeed, in the case of tips extension, when facing a branching path, HG-CoLoR has no clue as to which path to choose and continue the extension with, nor any anchors, unlike when it attempts to link two seeds together. Therefore, greedy selection and exploration of multiple branches are useless, and the extension is simply stopped when such a situation occurs. In this case, the tips of the corrected long read are further extended with bases from the original long read, until the extremities of the original long read are reached. Moreover, we chose to always stop the extension when the extremities of the original long read are reached, even in cases where the graph could be further traversed, as we seek to perform error correction, and not assembly. Extending the long reads further would indeed make the method closer to a contig assembly process than to an actual error correction pipeline.
3.6 Output
Filling regions uncovered by seeds, and extending the tips of the corrected long reads with bases from the original long reads allows to keep the connectivity of the long reads, which can be useful for applications such as scaffolding. For other applications where the importance of corrected bases prevails, a classical trim and/or split output is also proposed. Indeed, at the end of the correction process, each base of a corrected long read can be considered as corrected if it comes from a seed or from the variable-order de Bruijn graph, and as uncorrected if it comes from the original long read. HG-CoLoR outputs corrected bases in uppercase, and uncorrected bases in lowercase. Three versions of each corrected long read can thus be output by HG-CoLoR. A first version, where all the uncorrected bases are kept, a trimmed version where the uncorrected bases from the extremities of the long read are removed, and a split version, where all the uncorrected bases are removed, and only the regions of the long read that could be corrected are output as separate sequences.
4 Results and discussion
We ran experiments on both Pacific Biosciences simulated data, and real Oxford Nanopore data. In both cases, datasets from A. baylyi, E. coli and S. cerevisiae were included, and complementary real short Illumina reads were used. For real Oxford Nanopore data, a fourth dataset from the larger, eukaryotic genome of C. elegans was included. As no real Illumina reads of satisfying quality were available for this organism, the complementary Illumina short reads were simulated with ART (Huang et al., 2012). Simulated Pacific Biosciences long reads were obtained with the help of SimLord (Stöcker et al., 2016), a state-of-the-art simulator based on an error model developed from real Pacific Biosciences data. The following parameters were used, to obtain an error rate around 15%: –prob-ins 0.22, –prob-del 0.08 and –prob-sub 0.02. All details on the different datasets are given in Supplementary Table S1.
We compare HG-CoLoR against hybrid error correction tools CoLoRMap, HALC, Jabba, LoRDEC, Nanocorr and NaS, and also against three self-correction tools, namely Daccord, LoRMA, and the method used in the assembler Canu (Koren et al., 2017). Due to its large runtime, NaS was only ran in fast mode. As methods such as Jabba and Daccord only propose a split output, we also did split the output of all the other tools marking the bases that were not corrected, to allow fair comparison. Unless otherwise specified, all experiments were run on a 32 GB RAM machine equipped with 16 cores.
4.1 Parameters
We ran multiple rounds of correction with HG-CoLoR on the real S. cerevisiae dataset to experiment with the parameters. Thereby, we found that using a variable-order de Bruijn graph of maximum order K = 100 yielded the best compromise between runtime, number of corrected long reads, proportion of split long reads, average length and number of corrected bases (see Supplementary Figure S2). For both merging phases, the minimum overlap length to allow the merging of two seeds was set to 99, accordingly to the maximum order K chosen for the graph. The maximum distance of the alignment positions between two consecutive seeds was set to 10 for the second merging phase. The minimum order of the graph was set to k = 40, as setting it to larger values resulted in greater proportions of split, and thus shorter long reads, due to local drops of coverage. Setting it to smaller values also resulted in more split, and shorter long reads, due to the exploration of meaningless edges, especially in repeated regions, in addition to larger runtimes (see Supplementary Figure S3). The maximum number of branches explorations was set to 1250, as decreasing it also resulted in more split, and shorter long reads, and increasing it more barely yielded better results, but increased the runtime (see Supplementary Figure S4). For similar reasons, the maximum number of seed skips was set to 5, and the mismatches threshold was set to 3. For the alignment of the short reads to the long reads, BLASR was used with default parameters except for bestn, which was set to 50 instead of 10, in order to obtain a greater number of seeds, and therefore correct more long reads. Yet again, increasing this parameter to larger values only impacted the runtime, and did not meaningfully improve the correction results, while decreasing it induced a drop of the number of corrected long reads. As we only used a 50× coverage of short reads in our experiments, the K-mer solidity threshold was set to 1 (i.e. all the K-mers were considered as solid). These last two parameters are highly dependent of the characteristics of the input short reads. In particular, the bestn parameter should be decreased when using a higher coverage of short reads than 50×, and the solid parameter should be increased either when using a higher coverage of short reads than 50×, or when using very accurate short reads, displaying an error rate lower than 1%. Canu was run with parameters -correct, stopOnReadQuality=false, due to the high error rate of the long reads, corOutCoverage = 300, in order to correct as many long reads as possible, and genomeSize set to the exact number of bases of each reference genome. Additionally, -nanopore-raw was used to correct the real Oxford Nanopore long reads, and -pacbio-raw was used to correct the simulated Pacific Biosciences long reads. Other tools were run with default or recommended parameters. To allow better comparison, the short reads were corrected with QuorUM before running Jabba, instead of using Karect (Allam et al., 2015), the tool recommended by the authors. All tools were run with 16 processes.
4.2 Comparison on simulated data
To assess the accuracy of the different tools, we first tested them on the simulated Pacific Biosciences long reads. We were thus able to know which errors were introduced, and at which positions, and to precisely measure the accuracy of the correction. For that purpose, we used LRCStats (La et al., 2017), a software specifically designed to measure such accuracy on simulated data. LRCStats output statistics of all the tools on the simulated A. baylyi and E. coli datasets are given in Table 1, and discussed below. The S. cerevisiae dataset was voluntarily excluded from the comparison, as LRCStats reported erroneous statistics. These statistics are given in Supplementary Table S2.
Statistics of the simulated Pacific Biosciences long reads after correction with the different methods, as reported by LRCStats
| Method | Original | CoLoRMap | HALC | HG-CoLoR | Jabba | LoRDEC | Nanocorr | NaS | Canu | Daccord | LoRMA |
|---|---|---|---|---|---|---|---|---|---|---|---|
| A. baylyi | |||||||||||
| Error rate (%) | 17.8534 | 0.1023 | 0.0388 | 0.0310 | 0.0844 | 0.0374 | 0.5777 | 0.2961 | 8.5607 | 0.4967 | 21.7703 |
| Throughput (Mbp) | 71.9 | 62.6 | 63.7 | 64.6 | 61.6 | 61.1 | 64.4 | 48.2 | 59.1 | 64.7 | 0.2 |
| Deletions (%) | 3.8909 | 0.0193 | 0.0134 | 0.0121 | 0.0629 | 0.0092 | 0.1000 | 0.0360 | 1.5961 | 0.0955 | 2.1088 |
| Insertions (%) | 13.9605 | 0.0286 | 0.0184 | 0.0178 | 0.0233 | 0.0200 | 0.4967 | 0.1916 | 6.9289 | 0.4481 | 12.8142 |
| Substitutions (%) | 0.7186 | 0.0700 | 0.0130 | 0.0059 | 0.0111 | 0.0137 | 0.0675 | 0.1138 | 0.7860 | 0.0290 | 8.9844 |
| Split reads (%) | N/A | 13.85 | 3.61 | 0.01 | 2.97 | 15.19 | 0 | 0 | 0 | 1.33 | 42.18 |
| Runtime | N/A | 57 min | 22 min | 47 min | 2 min | 6 min | 2 h 52 min | 24 h 24 min | 10 min | 20 min | 5 min |
| E. coli | |||||||||||
| Error rate (%) | 17.9267 | 0.1036 | 0.0601 | 0.0596 | 0.0462 | 0.0669 | 0.3983 | 0.1935 | 8.8525 | 0.4498 | 32.9756 |
| Throughput (Mbp) | 93.0 | 78.4 | 81.3 | 83.4 | 78.0 | 78.5 | 83.3 | 62.4 | 75.7 | 83.8 | 0.3 |
| Deletions (%) | 3.9091 | 0.0198 | 0.0215 | 0.0280 | 0.0389 | 0.0133 | 0.0680 | 0.0257 | 1.6533 | 0.0866 | 2.8487 |
| Insertions (%) | 14.0186 | 0.0303 | 0.0269 | 0.0347 | 0.0109 | 0.0397 | 0.3360 | 0.1385 | 7.1604 | 0.4019 | 19.3079 |
| Substitutions (%) | 0.7215 | 0.0693 | 0.0209 | 0.0063 | 0.0036 | 0.0240 | 0.0549 | 0.0602 | 0.7997 | 0.0306 | 13.2367 |
| Split reads (%) | N/A | 13.13 | 9.62 | 0.03 | 4.57 | 26.12 | 0 | 0 | 0 | 0.23 | 42.58 |
| Runtime | N/A | 1 h 25 min | 24 min | 45 min | 2 min | 8 min | 3 h 17 min | 28 h 48 min | 12 min | 27 min | 5 min |
Note: The best result for each statistic is highlighted.
LoRMA’s runtimes were quite competitive, but it clearly performed the worst out of all the tools, and displayed the smallest throughputs and highest error rates on both datasets. Actually, the error rates after error correction with LoRMA were even higher than original error rates. Despite the low coverage depth of the long reads, the two other self-correction tools did manage to reduce the error rate, even though Canu only brought it down to about 8% on the two datasets, and would have benefited from a higher coverage. Canu and Daccord also managed to produce a high throughput of corrected bases, Daccord even outperforming all the other methods on this metric. The throughputs of all the hybrid methods but NaS were comparable. This lower throughput does not mean that NaS corrected less bases than the other tools, but rather comes from the fact that the throughput reported by LRCStats is computed from alignments between the original and the corrected reads. As NaS assembles short reads into contigs and uses them as corrected long reads, this indicates that a non-negligible amount of the produced long reads do not realign with the long read they originally come from, but instead do align in another region of the genome. All the hybrid methods also satisfyingly reduced the error rates, always below 1%, the highest coming from the A. baylyi dataset corrected with Nanocorr, and only being of 0.57%. When looking more specifically at the different types of errors, it appears that Jabba faced the most difficulties with deletions, CoLoRMap with substitutions, and all the other tools with insertions, which were the most frequent errors on the analyzed datasets. It is also worth noting that CoLoRMap, HALC and LoRDEC did split an important proportion of the long reads, meaning that large regions of these long reads were not corrected, and thus, that large regions of the reference genomes have a high chance to be uncovered. When looking at the runtimes, Jabba always performed the best, meanwhile Nanocorr and especially NaS displayed prohibitive runtimes. HG-CoLoR did not reach such runtimes, despite being slower than all the other tools but CoLoRMap. HG-CoLoR’s error rates were also lower than those of all the other tools, except for Jabba on the E. coli dataset. On both datasets, the throughput of HG-CoLoR was also higher than that of all the other tools but Daccord. Finally, the proportion of split long reads it yielded was smaller than that of all the other tools for which the reads could be split. Therefore, HG-CoLoR provided the best trade-off between runtime and quality of the results on these two simulated datasets.
4.3 Comparison on real data
Following the results on simulated data, we chose to exclude LoRMA from the comparison on real data, due to its globally unsatisfying results. We also chose to exclude CoLoRMap, HALC and LoRDEC due to the important proportion of split long reads they produced. Finally, as it performed the worst among all the hybrid tools on the real datasets, we also exclude Nanocorr. Results of tools excluded from this comparison are given and commented in Supplementary Tables S3 and S4.
We evaluate the accuracy of the different tools with two different approaches. First, we analyze how well the long reads align to the reference genomes, and second, we investigate the quality of the assemblies that can be generated from the corrected long reads.
4.3.1 Alignment-based comparison
The long reads were aligned with Last (Kielbasa et al., 2011) prior to correction, as it deals better with raw long reads. The different correction tools were then run, and the obtained corrected long reads were aligned with BWA mem (Li and Durbin, 2010) given their high accuracy. Results are given in Table 2 and discussed below.
Statistics of the real Oxford Nanopore long reads, before and after correction with the different methods
| Method | Original | HG-CoLoR | Jabba | NaS | Canu | Daccord |
|---|---|---|---|---|---|---|
| A. baylyi | ||||||
| Number of reads | 89 011 | 25 278 | 16 618 | 24 063 | 8122 | 19 623 |
| Split reads (%) | N/A | 1.01 | 4.90 | 0 | 5.47 | 53.02 |
| Average length | 4284 | 11 157 | 10 260 | 8840 | 9345 | 3244 |
| Number of bases (Mbp) | 381 | 285 | 179 | 213 | 81 | 175 |
| Average identity (%) | 70.09 | 99.75 | 99.40 | 99.82 | 97.79 | 91.92 |
| Genome coverage (%) | 100 | 100 | 99.82 | 100 | 99.79 | 100 |
| Runtime | N/A | 1 h 56 min | 2 min | 94 h 18 min | 32 min | 45 min |
| E. coli | ||||||
| Number of reads | 22 270 | 21 970 | 21 005 | 21 818 | 17 154 | 17 478 |
| Split reads (%) | N/A | 0.07 | 4.98 | 0 | 0.38 | 34.40 |
| Average length | 5999 | 6093 | 5797 | 7926 | 7080 | 4495 |
| Number of bases (Mbp) | 134 | 134 | 128 | 173 | 122 | 119 |
| Average identity (%) | 79.46 | 99.84 | 99.81 | 99.86 | 96.23 | 98.51 |
| Genome coverage (%) | 100 | 100 | 99.43 | 100 | 99.99 | 99.99 |
| Runtime | N/A | 1 h 05 min | 3 min | 72 h 02 min | 36 min | 30 min |
| S. cerevisiae | ||||||
| Number of reads | 205 923 | 72 228 | 33 484 | 71 793 | — | — |
| Split reads (%) | N/A | 5.13 | 11.47 | 0 | — | — |
| Average length | 5698 | 6724 | 6455 | 5938 | — | — |
| Number of bases (Mbp) | 1173 | 512 | 243 | 426 | — | — |
| Average identity (%) | 55.49 | 99.10 | 99.54 | 99.59 | — | — |
| Genome coverage (%) | 99.90 | 99.40 | 93.32 | 98.70 | — | — |
| Runtime | N/A | 8 h 36 min | 12 min | >16 days | — | — |
| C. elegans | ||||||
| Number of reads | 363 500 | 278 614 | 219 840 | — | 340 826 | — |
| Split reads (%) | N/A | 8.85 | 20.46 | — | 0 | — |
| Average length | 5524 | 5127 | 3905 | — | 5408 | — |
| Number of bases (Mbp) | 2008 | 1567 | 1058 | — | 1843 | — |
| Average identity (%) | 71.07 | 98.93 | 99.85 | — | 85.63 | — |
| Genome coverage (%) | 99.99 | 99.95 | 95.40 | — | 99.89 | — |
| Runtime | N/A | 80 h 34 min | 58 min | — | 16 h 38 min | — |
Note: The number of reads column accounts for the number of corrected long reads, not for the number of output fragments. Precise runtime is omitted for NaS on S. cerevisiae because the results did not compute in 16 days, and the execution was therefore stopped. NaS corrected reads for this dataset were obtained from the Genoscope website. Omitted results for a given method mean that the method was not run or did not manage to correct the long reads. The best result for each statistic is highlighted.
Jabba clearly performed the best when it comes to runtime, outperforming all the other tools by several orders of magnitude. It also produced corrected long reads that aligned with a high identity. However, although highly accurate, these corrected long reads did not manage to completely cover any of the reference genomes. These unresolved regions likely come from the important proportion of split long reads that were produced, due to the fact that Jabba uses a de Bruijn graph of fixed order, and therefore faces difficulties with local drops of coverage. Pre-processing the short reads using Karect instead of QuorUM, as recommended by the authors, did not show any significant improvement (see Supplementary Table S5).
Apart from Jabba, the two self-correction tools outperformed the two other hybrid correction methods in terms of runtime. However, the error correction was not very efficient, as the produced corrected long reads still displayed a large proportion of errors, as high as 8% for those produced by Daccord on the A. baylyi dataset, despite a coverage of 106×. The average length of the long reads corrected with Daccord was also smaller than the average length of the original long reads, due to the high proportion of split long reads. On the S. cerevisiae dataset, none of these two tools managed to perform correction. Canu stopped because of an error, caused by the high error rate of the long reads, and Daccord failed because of memory limitations, even when ran on a cluster with large resources, on which we had access to 256 GB of RAM. This underlines the fact that hybrid error correction remains more efficent to correct highly noisy long reads, even from moderately large genomes.
Therefore, only NaS and HG-CoLoR managed to produce corrected long reads that covered the whole reference genomes with a high identity, except for a few regions of S. cerevisiae, due to the fact that neither the original long reads nor the short reads did cover the whole genome. HG-CoLoR however output more corrected long reads, and thus covered the reference genome better. For all the datasets, the long reads corrected with NaS aligned with a slightly higher identity than those corrected with HG-CoLoR. However, despite being run in fast mode, NaS was several orders of magnitude slower than HG-CoLoR on all the datasets.
On the larger C. elegans dataset, NaS was not run due to its prohibitive runtime, and once again, Daccord did not manage to perform correction due to memory limitations, even on the aforementioned cluster. Canu produced the greatest number of corrected long reads. They covered the reference genome well, but still displayed a high error rate, of almost 15%. As mentioned in the experiments on simulated data, this large proportion of errors is due to the weak coverage of long reads that was used, and a better coverage could greatly improve the results of Canu, as seen on the real A. baylyi and E. coli datasets. HG-CoLoR, despite being slower, managed to produce corrected long reads that displayed a high identity, and covered the reference genome well. Moreover, it is worth noting that the memory peak for HG-CoLoR was only of 10GB, making it able to scale to large genomes even on a reasonable setup.
As a result, despite its larger runtimes than self-correction methods, and its slight disadvantage on the alignment identity of the corrected long reads when compared to NaS, HG-CoLoR displayed the best trade-off between runtime and quality of the results, and proved to be the only tool able to efficiently scale to eukaryotic genomes.
4.3.2 Assembly-based comparison
After correction with the different tools, the long reads were assembled using Canu, without performing the correction and trimming steps. We only used Canu and not any other, possibly hybrid, assembly tools, as assembly is not deemed to be a crucial evaluation of the correction, nor the most important outcome. The following parameters were used for all the assemblies: –assemble, OvlMerSize = 17, OvlMerDistinct = 0.9925 and OvlMerTotal = 0.9925. The genomeSize parameter was set independently to the exact number of bases of each reference genome. All the other parameters were set to their default values. We acknowledge that Canu has initially been designed to take as input a whole set of uncorrected reads, and perform both correction and assembly together. However, in practice, the two tasks are independent. The long reads are corrected first, and only the long reads that could be corrected are then assembled. As a result, directly providing the long reads that could be corrected by Canu to its assembly module, instead of providing the whole set of reads and performing all tasks, does not impact the assembly results. Comparisons of the assemblies with the reference genomes were performed with MUMmer (Kurtz et al., 2004). Results are given in Table 3 and discussed below.
Statistics of the assemblies generated from the corrected real Oxford Nanopore long reads
| Method | HG-CoLoR | Jabba | NaS | Canu | Daccord |
|---|---|---|---|---|---|
| A. baylyi | |||||
| Long reads coverage | 79× | 50× | 59× | 22× | 49× |
| Number of contigs | 1 | 14 | 1 | 3 | 1 |
| NG50 | 3 634 461 | 216 679 | 3 629 508 | 2 887 573 | 3 520 381 |
| Genome coverage (%) | 99.99 | 89.03 | 100 | 99.39 | 100 |
| Identity (%) | 99.94 | 99.94 | 99.99 | 97.04 | 97.06 |
| E. coli | |||||
| Long reads coverage | 29× | 28× | 37× | 26× | 26× |
| Number of contigs | 1 | 41 | 1 | 3 | 2 |
| NG50 | 4 659 731 | 138 730 | 4 635 116 | 3 155 369 | 4 558 944 |
| Genome coverage (%) | 100 | 95.81 | 99.90 | 99.82 | 100 |
| Identity (%) | 99.99 | 99.99 | 99.99 | 97.23 | 97.84 |
| S. cerevisiae | |||||
| Long reads coverage | 41× | 20× | 34× | — | — |
| Number of contigs | 67 | 138 | 119 | — | — |
| NG50 | 297 575 | 47 164 | 146 459 | — | — |
| Genome coverage (%) | 97.57 | 68.67 | 97.44 | — | — |
| Identity (%) | 99.92 | 99.99 | 99.95 | — | — |
| C. elegans | |||||
| Long reads coverage | 15× | 10× | — | 18× | — |
| Number of contigs | 352 | 1 369 | — | 1 049 | — |
| NG50 | 458 250 | — | — | 116 510 | — |
| Genome coverage (%) | 98.41 | 53.86 | — | 88.75 | — |
| Identity (%) | 99.86 | 99.97 | — | 95.60 | — |
Note: Reported identities stand for the 1-to-1 alignments. Omitted NG50 size mean that the assembly did not reach half of the reference genome size. The best result for each statistic is highlighted.
In agreement with what we observed in Table 2, the fact that the long reads corrected with Jabba did not manage to cover the whole reference genomes resulted in highly fragmented assemblies, that could not resolve large regions of the reference genomes. As a result, despite their high accuracy, these corrected long reads yielded the most fragmented assemblies, that covered the least the reference genomes, and that displayed the smallest NG50 sizes. In particular, on the C. elegans dataset, the assembly did not reach half of the reference genome size. MUMmer however reported a genome coverage of slightly >50%, which was caused by dual mappings of very small contigs, barely of the size of a long read, in repeated regions.
As previously mentioned, compared to hybrid methods, the two self-correction tools produced a weaker coverage depth of long reads, that displayed higher error rates. Despite this fact, these long reads still assembled into a small number of contigs, that displayed high NG50 sizes, both on the A. baylyi and the E. coli datasets. However, due to the high error rate of the long reads, these assemblies displayed the lowest identities when compared to the reference genomes. Moreover, on these two datasets, Daccord outperformed Canu in terms of contiguity, NG50, and genome coverage of the assemblies. On the A. baylyi dataset, the long reads corrected with Daccord even assembled into a single contig.
On the A. baylyi and the E. coli datasets, NaS and HG-CoLoR produced corrected long reads that assembled into a single contig. The NG50 sizes were thus highly similar, and the two assemblies only displayed two minor differences. First, a small region of E. coli was not covered by the assembly yielded from NaS’s corrected reads. Second, on the A. baylyi dataset, the assembly generated from HG-CoLoR’s corrected reads displayed a slightly lower identity when compared to the reference. However, on the S. cerevisiae dataset, HG-CoLoR outperformed NaS in terms of contiguity, NG50 size, and genome coverage of the assemblies.
On the larger C. elegans dataset, despite the fact that the long reads corrected with Canu covered the reference genome well, the assembly they generated failed to resolve 11% of the reference genome. As previously mentioned, the identity when compared to the reference genome was also quite low. Therefore, only the long reads corrected with HG-CoLoR resulted in an assembly displaying a high identity, and covering the reference genome well. The number of contigs and the NG50 size were also more satisfying than those from the other assemblies, despite the fact that they remained far from those of the actual genome.
4.4 Details on HG-CoLoR results
We further focus on HG-CoLoR results, and analyze more in depth the way correction is performed, by observing where the bases of the corrected long reads originate from, for both the simulated and the real datasets. We also comment on how the length of the short reads impacts the quality of the results.
4.4.1 Origin of the bases
We provide a description indicating whether the bases come from seeds, graph traversals or original long reads in Table 4. It appears that on the three simulated datasets, for which the error rate was around 17%, most bases of the corrected long reads come from the seeds. As the error rate of these long reads was relatively low compared to other datasets, the short reads could indeed align more easily, cover larger regions of the long reads, and less graph traversals were therefore needed. Only very few uncorrected bases remain, the largest proportion only being of slightly >1% on the S. cerevisiae dataset. These observations also apply to the real E. coli dataset, for which the error rate was of slightly >20%.
Proportion of bases coming from seeds, graph traversals and original long reads, in the long reads corrected with HG-CoLoR
| Dataset | Seeds bases (%) | Graph bases (%) | Raw bases (%) |
|---|---|---|---|
| A. baylyi (simulated) | 68.95 | 30.97 | 0.08 |
| E. coli (simulated) | 67.01 | 32.74 | 0.25 |
| S. cerevisiae (simulated) | 63.97 | 34.82 | 1.21 |
| A. baylyi (real) | 36.37 | 60.53 | 3.10 |
| E. coli (real) | 62.61 | 37.04 | 0.35 |
| S. cerevisiae (real) | 24.41 | 60.22 | 15.37 |
| C. elegans (real) | 48.94 | 44.23 | 6.83 |
On the three other real datasets, that displayed a much higher error rate, more bases originate from the traversals of the graph. On the C. elegans dataset, displaying an error rate of 29%, almost as many bases come from the seeds as from the graph traversals. This tendency further accentuates as the error rate rises. On the S. cerevisiae dataset, for which the error rate is higher than 44%, more than twice as many bases come from the graph traversals than from the seeds. In any case, the non-negligible proportion of bases coming from graph traversals, for all the datasets, underlines the usefulness of the graph.
The proportion of uncorrected bases also tends to rise with both the error rate and the genome complexity. Indeed, the largest proportion of such bases can be observed on the highly noisy S. cerevisiae dataset. However, on the C. elegans dataset, which has a lower error rate than that of A. baylyi, almost 7% of the bases could not be corrected. This likely comes from the genome complexity, and from the fact that repeated regions were therefore harder to resolve, even with the high maximum order used for the graph.
4.4.2 Impact of the short reads length
All the short reads used in our experiments are of length 250–300 bp, despite the fact that the vast majority of Illumina reads being produced are shorter, and still in the 100–150 bp range. However, HG-CoLoR does not require the short reads to be that long in order to perform efficient error correction. Results of HG-CoLoR, on both simulated and real datasets, when using a 50× coverage of 125 bp short reads, are given in Supplementary Tables S6–S8, and show that HG-CoLoR actually performs even better with such shorter reads.
4.5 Impact of the variable-order de Bruijn graph
In order to further validate the usefulness of using a variable-order de Bruijn graph over a classical one, we ran another experiment on the real S. cerevisiae dataset. We used the same parameters as in the previous experiments, except for the minimum order of the graph, which we set to the same value as the maximum order, 100, in order to only traverse a classical de Bruijn graph. Results of this experiment, and comparison to the results achieved when using a variable-order de Bruijn graph are given in Table 5.
Impact of the variable-order de Bruijn graph on the results, on the real S. cerevisiae dataset
| Graph | Variable-order | Classical |
|---|---|---|
| Correction | ||
| Number of reads | 72 228 | 72 228 |
| Split reads (%) | 5.13 | 6.89 |
| Average length | 6724 | 6525 |
| Number of bases (Mbp) | 512 | 507 |
| Average identity (%) | 99.10 | 99.06 |
| Genome coverage (%) | 99.40 | 99.40 |
| Runtime | 8 h 36 min | 6 h 13 min |
| Assembly | ||
| Long reads coverage | 41× | 41× |
| Number of contigs | 67 | 107 |
| NG50 | 297 575 | 153 845 |
| Genome coverage (%) | 97.57 | 96.57 |
| Identity (%) | 99.92 | 99.92 |
These results show that using a variable-order de Bruijn graph indeed allows to perform a more efficient error correction, in particular in subgraphs corresponding to regions where the short reads coverage in insufficient. When using a classical de Bruijn graph, these subgraphs result in more uncorrected regions, and thus more split, and shorter long reads, which can actually be properly corrected, without any loss of quality, with a variable-order de Bruijn graph.
Although the type of graph does not affect the genome coverage of the long reads, the quality of the assembly greatly decreases when using a classical de Bruijn graph. Indeed, correcting the long reads with a classical de Bruijn graph resulted in an assembly composed of 40 more contigs, reaching a NG50 two times smaller, and covering the reference genome 1% less than the assembly generated after correcting the long reads with a variable-order de Bruijn graph.
5 Conclusion
We described HG-CoLoR, a new hybrid method for the error correction of long reads that combines two approaches from the state-of-the-art into a seed-and-extend strategy. The short reads are first aligned to the long reads, in order to discover seeds. These seeds are then used as anchors on a variable-order de Bruijn graph, built from the short reads, and linked together by traversing the graph, in order to correct uncovered regions of the long reads.
Our experiments show that, compared against state-of-the-art hybrid and non-hybrid error correction tools, HG-CoLoR provides the best trade-off between runtime and quality of the results, both in terms of quality of the error correction itself, and in terms of quality of the assemblies generated from the corrected long reads. Further experiments also show that our method is the only one able to efficiently scale to eukaryotic genomes.
The development of this method and our experiments underline the fact that, despite already being useful, self-correction methods are still not satisfactorily applicable to highly noisy long reads. Indeed, they do not manage to perform error correction at all on long reads sequenced with early chemistries, which display a very high error rate. They also do not scale to eukaryotic genomes, either completely failing to perform correction, or barely reducing the error rate. Therefore, hybrid approaches remain more efficient to correct long reads, either in the case of eukaryotic genomes, or in the case of very high error rates, as resequencing is not always affordable, and that even recent data still frequently display high error rates.
Our experiments also underline the usefulness of using a variable-order de Bruijn graph instead of a classical one. Indeed, a variable-order de Bruijn graph allows to efficiently correct the long reads, in particular in regions where the short reads coverage is insufficient, and where a classical de Bruijn graphs fails to perform correction due to missing edges. The use of a variable-order de Bruijn graph thus allows to correct larger regions of the long reads, without any loss of quality. This does not only improve the error correction itself, but also benefits the contiguity and overall quality of the downstream assemblies.
As further work, we plan to focus on a new implementation of PgSA, as the current one does not support parallel querying of the index, and therefore forces HG-CoLoR to use mutexes. Getting rid of that need would reduce the runtime of the method. Another index structure allowing to query a set of k-mers with strings of variable length, and supporting parallel querying, could also replace PgSA. Another direction is to try out other aligners for the alignment step of the short reads to the long reads, in order to possibly discover the seeds quicker, or correct more long reads.
Acknowledgements
The authors would like to thank the Genoscope for the availability of most of the data used in this paper. Part of this work was performed using computing resources of CRIANN (Normandy, France).
Funding
This work was supported by Défi MASTODONS C3G project from CNRS.
Conflict of Interest: none declared.
References

