


Abstract
Multi-dimensional NMR spectra are generally used for NMR signal assignment and structure analysis. There are several programs that can achieve highly automated NMR signal assignments and structure analysis. On the other hand, NMR spectra tend to have a large number of noise peaks even for data acquired with good sample and machine conditions, and it is still difficult to eliminate these noise peaks.
We have developed a method to eliminate noise peaks using convolutional neural networks, implemented in the program package Filt_Robot. The filtering accuracy of Filt_Robot was around 90–95% when applied to 2D and 3D NMR spectra, and the numbers of resulting non-noise peaks were close to those in corresponding manually prepared peaks lists. The filtering can strongly enhance automated NMR spectra analysis.
The full package of the program, documents and example data are available from http://bmrbdep.pdbj.org/en/nmr_tool_box/Filt_Robot.html.
Supplementary data are available at Bioinformatics online.
1 Introduction
The modern techniques for NMR signal assignment and structure determination for small proteins in solution have been established using multi-dimensional spectra with isotope-labeled proteins (Sugiki et al., 2017). There are a number of programs to automate these tasks, among which for instance UNIO and FLYA are capable of both NMR signal assignment and structure calculation (Schmidt and Güntert, 2012; Serrano et al., 2012). Such automated programs normally require peak tables from a number of spectra that are obtained using a spectrum viewer program or some other external tools. The biggest burden for the preparation of peak tables is correctness of the identified peak lists. On the other hand, NMR spectra may contain noise signals, for instance from incorrect phasing and sinc type truncation artifacts. The bulk water signal may give severe baseline distortions near the important 1Hα and 1Hβ signals. Noise tends to be a more serious problem in the case of samples with low protein concentration due to a low signal-to-noise ratio. In the last few years, several new peak picking programs have been released (e.g. Klukowski et al., 2015; Würz and Güntert, 2017). However, the concept of our program differs substantially from these since our tool is designed for strong noise elimination. Here, we present a first approach for fully automated noise filtration using convolutional neural networks (CNN), and we demonstrate its robustness in identifying peaks which can be used for the automated assignment program FLYA to obtain NMR signal assignments and 3D structures with high accuracy.
2 Materials and methods
Convolutional neural networks are now available in many neural networks tool kits. For this study, we have chosen CNTK (Cognitive Neural network Tool Kit) version 2.0 developed by Microsoft: https://www.microsoft.com/en-us/research/publication/an-introduction-to-computational-networks-and-the-computational-network-toolkit/. The input peak data, comprising noise and real peaks, are collected from 2D and 3D spectra as described in the Supplementary Material. The peak positions are detected by searching the maximal data point in a square for 2D or cubic for 3D sub-matrix, by quadratic interpolation over the closest three points in each dimension. The submatrix around the detected peak center in the x–y (and y–z for 3D spectra) planes are extracted and interpolated to generate 40 × 40 images. The data intensities are normalized by linearly transforming the intensity of the center point in the submatrix into 0–127 for negative values and 128–255 for positive values. A CNN training data including 2800 noise and 2800 real peaks was collected from 2D and 3D spectra of uniformly 13C/15N-labeled ubiquitin and extended by rotation, mirroring and sign changes to generate ∼58 000 images. The graphical user interface and the network structure of the CNN filter are shown in Figure 1. More details on the preparation of the training data and the network structure can be found in the Supplementary Material. The CNTK script, training/test data and demo toolkits are available from our web-site.
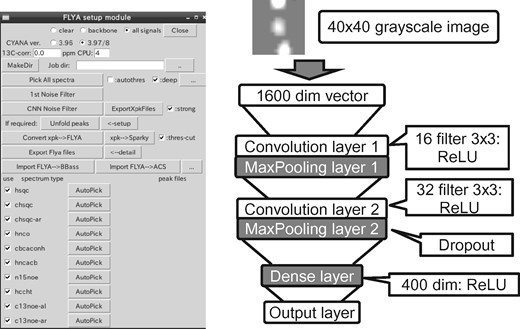
Filt_Robot module (left) and schematic representation of the CNN filter (right)
3 Results
Two benchmarks were performed using 2D and 3D spectra for a uniformly isotope labeled SH3 domain, which is available from the BMRB archive with accession code bmr16647 and Lamin-G465D (a mutant of human lamin A, 147a.a.) The 3D peak tables were roughly filtered by applying a position mask based on the peak positions in the automatically prepared peak tables for 2D 1H–15N HSQC and 1H–13C HSQC before applying the CNN filter. The noise filtration of the peak lists for spectra took about 20–30 min on a standard PC. Statistics are listed in Table 1 and Supplementary Tables S1 and S2. The peak lists were submitted to the FLYA algorithm in CYANA version 3.98 for automated signal assignment, followed by structure calculation with CYANA using the chemical shift table from FLYA, the CNN-filtered NOESY peak lists, and backbone dihedral angle restraints from TALOS+ (Shen et al., 2009) as input. The structures are very close to the deposited NMR structure with PDB-ID 2KRS and 1IFR, respectively (Supplementary Figs S11 and S12).
Results of Filt_Robot noise filter applied to bmr16647 and Lamin-G465D spectra
| NMR experiment | Number of peaks | Accuracy | ||||
|---|---|---|---|---|---|---|
| Initial | HSQC filter | CNN filter | Recalla (%) | Precisionb (%) | F-valuec (%) | |
| bmr16647 | ||||||
| 2D 1H–15N HSQC | 323 | n.a. | 87 | 100.0 | 90.8 | 95.2 |
| 2D 1H–13C HSQCd | 1 332 | n.a. | 334 | 98.8 | 73.4 | 84.8 |
| 3D CBCA(CO)NH | 1023 | 871 | 140 | 97.1 | 97.1 | 98.6 |
| 3D HNCACB | 723 | 681 | 230 | 97.0 | 99 | 98.3 |
| 3D HCCH-TOCSYd | 17 760 | 4484 | 845 | 95.1 | 85.6 | 90.1 |
| 3D 15N-edited NOESY | 2 880 | 1683 | 806 | 99.7 | 95.4 | 97.5 |
| 3D 13C-edited NOESYd | 20 243 | 6935 | 1997 | 99.0 | 84.1 | 91 |
| Lamin-G465D | ||||||
| 2D 1H–15N HSQC | 364 | n.a. | 173 | 95.5 | 98.8 | 97.2 |
| 2D 1H–13C HSQCd | 2144 | n.a. | 815 | 99.4 | 86.7 | 92.7 |
| 3D CBCA(CO)NH | 1862 | 1441 | 292 | 100.0 | 94.9 | 97.4 |
| 3D HNCACB | 1700 | 1285 | 490 | 98.9 | 92.7 | 95.7 |
| 3D HCCH-TOCSYd | 35 280 | 6320 | 1 290 | 97.1 | 85.6 | 93.8 |
| 3D 15N-edited NOESY | 5 776 | 4965 | 2 497 | 99.2 | 97.9 | 98.5 |
| 3D 13C-edited NOESYd | 54 016 | 17 056 | 4 273 | 96.2 | 97 | 96.6 |
Recall = TP/(TP + FN).
Precision = TP/(TP ± FP), with FP = number of noise peaks identified as real peaks, FN = eliminated real peaks, TP = correctly identified real peaks.
F-value = 2 × Recall × Precision/(Recall + Precision). See Supplementary Material for the other spectrum data and details.
Acquired for aliphatic region only.
In conclusion, our tool can be applied to noise elimination in NMR peak lists for obtaining accurate chemical shifts and NMR structures as well as providing quality factors for the identified peaks. The feasibility of our tool strongly depends on the quality of the sample and the spectrum data. The obtained assignments and structures can be assessed with validation tools such as RPF (Huang et al., 2012).
Funding
This work was supported by the Platform Project for Supporting Drug Discovery and Life Science Research from AMED and JSPS KAKENHI grants 15K06970.
Conflict of Interest: none declared.
References

