


Abstract
The analysis of sequence conservation patterns has been widely utilized to identify functionally important (catalytic and ligand-binding) protein residues for over a half-century. Despite decades of development, on average state-of-the-art non-template-based functional residue prediction methods must predict ∼25% of a protein’s total residues to correctly identify half of the protein’s functional site residues. The overwhelming proportion of false positives results in reported ‘F-Scores’ of ∼0.3. We investigated the limits of current approaches, focusing on the so-far neglected impact of the specific choice of homologs included in multiple sequence alignments (MSAs).
The limits of conservation-based functional residue prediction were explored by surveying the binding sites of 1023 proteins. A straightforward conservation analysis of MSAs composed of randomly selected homologs sampled from a PSI-BLAST search achieves average F-Scores of ∼0.3, a performance matching that reported by state-of-the-art methods, which often consider additional features for the prediction in a machine learning setting. Interestingly, we found that a simple combinatorial MSA sampling algorithm will in almost every case produce an MSA with an optimal set of homologs whose conservation analysis reaches average F-Scores of ∼0.6, doubling state-of-the-art performance. We also show that this is nearly at the theoretical limit of possible performance given the agreement between different binding site definitions. Additionally, we showcase the progress in this direction made by Selection of Alignment by Maximal Mutual Information (SAMMI), an information-theory-based approach to identifying biologically informative MSAs. This work highlights the importance and the unused potential of optimally composed MSAs for conservation analysis.
Supplementary data are available at Bioinformatics online.
1 Introduction
The evolutionary conservation of functionally important residues in protein sequences is one of the most fundamental and pervasive assumptions in current biological thinking. Ever since the birth of comparative sequence analysis in the mid-20th century (Braunitzer et al., 1961; Margoliash, 1963; Sanger and Thompson, 1952), sequence conservation has been used to infer structural and functional relationships among homologous proteins. Since then, there has been tremendous progress in the invention of pairwise and multiple sequence alignment techniques (Altschul et al., 1990,, 1997; Chang et al., 2014; Needleman and Wunsch, 1970; Smith and Waterman, 1981; Soding, 2005) as well as an exponential growth in available sequence data (NCBI Resource Coordinators, 2017; UniProt, 2015). Paralleling the increasing volume and complexity of sequence data has been the development of sequence-based conservation analysis methods capable of identifying and distinguishing from each other both usually-considered types of ‘functional’ residues: those that are general-function-granting (e.g. a protease’s catalytic triad) and those that are specificity-determining (e.g. the protease’s substrate-binding residues) (Chakraborty and Chakrabarti, 2015). Development of these conservation analysis tools has most prominently relied on measures derived using residue count statistics (Casari et al., 1995; Lichtarge et al., 1996; Livingstone and Barton, 1993; Zvelebil et al., 1987), and information theory (Capra and Singh, 2007; Hannenhalli and Russell, 2000; Reva et al., 2007). More recent advances in functional residue prediction have focused on using conservation as a feature to be integrated, together with structural and other physicochemical properties, into machine learning approaches (Fajardo and Fiser, 2013; Liu and Hu, 2013; Sun et al., 2016; Taherzadeh et al., 2016,, 2018).
Nevertheless, functional residue prediction remains challenging, as is clear from reported performance metrics of ‘recall’ (true positives/(true positives + false negatives)) and ‘precision’ (true positives/(true positives + false positives)). Although state-of-the-art machine learning methods report on average the correct identification of approximately half of the residues in a given ligand-binding site (a recall of 0.5), this comes at the expense of large numbers of false positives (a precision of 0.2). Such imprecise predictions are impractical for further experimental testing. For example, for a 100-residue protein with a 10-residue binding site, correct identification of 5 binding residues (a recall of 0.5) would require prediction of 25 residues (at a precision of 0.2): one-fourth of the protein. This is suggestive of the fundamental class imbalance problem that arises in functional residue prediction: for any protein, the functional residues are a small fraction of the total residues, so true negatives far outnumber true positives. Appraising the quality of functional residue prediction methods is therefore complicated by the practice of reporting performance metrics that heavily reward true negatives, such as the ‘specificity’ and the ‘accuracy’, which are less appropriate for this application than ones that do not, such as the ‘F-Score’ (Witten et al., 2011), or ones that do so minimally, such as the ‘Matthews Correlation Coefficient’ (MCC) (Matthews, 1975).
An additional issue that arises in benchmarking ligand-binding site prediction in proteins is the ambiguity of binding site definition. These are often defined using distance cutoffs between protein and ligand atoms based on a protein-ligand complex structure. Several databases exist that compile these binding site definitions for thousands of proteins (Dessailly et al., 2007; Maietta et al., 2014; Yang et al., 2012), with considerable differences. In addition, residues outside the borders of these distance-defined binding sites can be critical to ligand binding. A biomedically-impactful example of this is the difference between abatacept and belatacept, which are immunosuppressive drugs used in the clinical management of autoimmune diseases and organ transplantation, respectively (Vincenti and Luggen, 2007). Both abatacept and belatacept are CTLA4-Ig fusion proteins and bind CD80/CD86 to inhibit costimulatory signaling necessary for the immune response. However, belatacept binds to CD80/CD86 with a binding affinity tenfold stronger than that of abatacept, increasing its suitability for the large-scale immunosuppression needed for organ transplantation (Larsen et al., 2005). Belatacept differs from abatacept only by two mutations in residues just outside the rim of CTLA4’s atomic-distance-defined binding site for CD80/CD86 (Larsen et al., 2005). Given all these uncertainties in binding site definition, one cannot expect binding site prediction approaches to perfectly match database-annotated binding sites.
In the present work, we survey the sequence conservation of annotated ligand-binding residues for a large, diverse cross-section of the proteome consisting of 1023 proteins binding diverse ligand types derived from BioLiP, a semi-manually curated protein-ligand interaction database (Yang et al., 2012). We show that the potential of accurate functional residue identification by conservation analysis is far from exhausted and posit that the most important factor to be explored is the search for an optimally composed multiple sequence alignment (MSA). The importance of feeding a ‘high-quality’ MSA into conservation analysis methods has been stressed for decades (Casari et al., 1995). However, ‘quality’ is usually taken to mean the minimization of alignment errors (‘alignment accuracy’) rather than the more biologically relevant question of the specific choice of included homologs in MSAs, which we refer to as ‘informativeness’. Early studies on this topic have emphasized the need for ensuring diversity in the set of homologs included in MSAs to have confidence in functional residue predictions (Valdar and Thornton, 2001a,b). In this study, we demonstrate that ‘informativeness’ of MSAs is a surprisingly impactful and neglected topic with enormous potential for sequence-based functional residue identification. We also showcase the utility of a recently-developed MSA assessment pipeline called Selection of Alignment by Maximal Mutual Information (SAMMI) (Gil and Fiser, 2018), which is a possible step in the right direction.
2 Materials and methods
We performed conservation analysis on a diverse collection of 1023 small-molecule-binding proteins (Supplementary Table S2) with the aim of predicting their ligand-binding residues as annotated by the January 25, 2017 version of the BioLiP database. These proteins were 100–300 residues long, sharing at most 40% sequence identity with each other, and had a single annotated binding site with a size between 10 and 25 residues. The 1023 proteins were grouped into three datasets: 482, 266 and 275 proteins that bind oligopeptides, oligonucleotides and ‘miscellaneous’ small molecules (enzyme-substrate interactions) in BioLiP, respectively (Gil and Fiser, 2018).
For each query protein, a PSI-BLAST (Altschul et al., 1997) search was performed with three iterations and an e-value cutoff of 10−10 which returned up to 20 000 hits. We then sampled 264 alternative MSAs from this search consisting of subsets of all hits using combinations of three sequence parameters: the minimum (set at 20, 25, 30, 35, 40, 45, 50, 55 and 60%), and maximum (set at 50, 70, 90, 99%) sequence identity between query and hits, and the maximum sequence identity (level of clustering) between hits (set at 40, 50, 60, 70, 80, 90, 95 and 99%). Sequence identities were defined as reported by default in the PSI-BLAST output. The hits were also required to cover at least 70% of the query.
For each of the 264 MSAs, we analyzed the conservation of positions using a score based on the Jensen-Shannon Divergence (JSD) (Capra and Singh, 2007), considering residue positions with relative solvent-accessibility exceeding zero using a sequence-based approach (Magnan and Baldi, 2014). We ranked each MSA query residue position by its JSD conservation score and considered the top N ranked residue positions as the functional residue prediction, where N is the number of BioLiP-annotated functional residues for the query protein. The success of a functional residue prediction was assessed by the F-Score, the harmonic mean of precision and recall (2*precision*recall/(precision + recall)), where precision is the ratio of true positives to the sum of true and false positives and recall is the ratio of true positives to the sum of true positives and false negatives. The MSA whose conservation pattern yielded the highest F-Score out of the 264 sampled was termed the ‘Max Sampled MSA’.
We also predicted the ‘informativeness’ of each MSA by applying a recently developed algorithm, SAMMI (Gil and Fiser, 2018). SAMMI calculates a mutual-information-based score (MI-Score) that represents the structural and functional signals unique to the three-dimensional fold of a protein family that is encoded in a biologically relevant MSA. Briefly, the MI-Score is calculated by computing the mutual information (MI) (Cover and Thomas, 2006) between all pairs of columns in an MSA that are occupied by a query protein residue and at least 10 homologous protein residues, and between shuffled versions of those columns. The top 5% of the differences between the ‘raw’ and ‘column-shuffled’ MI values are then averaged to obtain the MI-Score. The MSA with the highest MI-Score of the 264 sampled was termed the ‘SAMMI MSA’. The logic behind SAMMI is that the most informative MSA is the one that contains the most diverse set of sequences of homologous proteins, but without mixing in unrelated subfamilies. It is hypothesized that high MI-Scores will reflect the structurally consistent conformations among sequentially similar inputs that are connected to the same function.
3 Results and discussion
3.1 Uncertainty in residue-level definition of ligand-binding sites in proteins
To estimate a practical upper limit for the accuracy of binding site identification, we explored the agreement between binding site residue annotations in BioLiP versus those obtained through other approaches. We calculated F-Scores treating BioLiP annotations as the ‘true’ binding sites and cross referencing them with alternative definitions (Fig. 1). FireDB (Maietta et al., 2014) is a protein-ligand interaction database that uses almost identical criteria as BioLiP to define binding site residues, the only minor difference being that FireDB spatially clusters binding site residues from proteins that are at least 97% sequence identical. Despite the almost identical binding site definition criteria, the ‘agreement F-Score’ between BioLiP and FireDB for the subset of 249/275 proteins binding miscellaneous-small-molecules present in both databases has a left-skewed distribution with a mean of 0.86 and a median of 0.93. This indicates that although many BioLiP and FireDB annotations match perfectly as expected from the almost identical binding site criteria used, there is significant disagreement in a substantial fraction of cases.
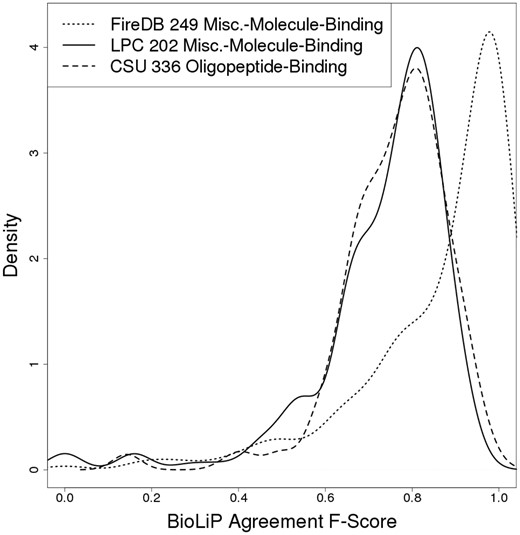
Agreement between functional sites defined using different methods. This plot shows the agreement between BioLiP and two different approaches, FireDB (red line) and Ligand Protein Contacts (LPC; blue line, solid), in defining ligand-binding site residues for miscellaneous-molecule-binding proteins. Also shown is the agreement between BioLiP and Contacts of Structural Units (CSU; blue line, dashed) in defining the ligand-binding residues of oligopeptide-binding proteins
Ligand Protein Contacts (LPC) (Sobolev, 1999) provides a different approach to binding site definition that considers both distances and physicochemical compatibilities between protein and ligand atoms. Applying LPC to a subset of 202/275 miscellaneous-molecule-binding proteins, we observed an agreement F-Score distribution with BioLiP that has a mean and median of 0.73 and 0.77, respectively (Fig. 1). Like in the FireDB case, this distribution is left-skewed, with a peak at ∼0.8. The skewness arises from several factors: (i) LPC identifying greater numbers of binding residues in general as compared to BioLiP (mean 20.4 for LPC versus 12.4 for BioLiP in cases with F-Score < 0.8), (ii) LPC identifying opposite sides of binding pockets as annotated in BioLiP (possibly indicating BioLiP misannotations), (iii) LPC failing to recognize contacts involving nonstandard amino acid residues. The few cases with complete disagreement are due to LPC recognizing ligands that BioLiP does not recognize as ‘biologically relevant’. Applying Contacts of Structural Units (CSU) (Sobolev, 1999), which uses the same principles as LPC to define residues involved in protein-protein interactions, to a subset of 336/482 oligopeptide-binding proteins produces a similar distribution to that seen when using LPC, with a mean and median of 0.76 and 0.78, respectively and a peak at ∼0.8. These results suggest that the practical maximum F-Score a binding site residue prediction algorithm can possibly aim to achieve is ∼0.8.
3.2 Conservation patterns of optimally composed MSAs are predictive of nearly all functional sites
We examined the distributions of conservation analysis F-Scores obtained for the Max Sampled and SAMMI MSAs in each of the datasets, together with those of two types of controls representing random/naïve MSA selection and random residue prediction (Fig. 2, Supplementary Table S2). Random residue selection, which represents the likelihood of identifying functionally important residues by chance, produces a narrow F-Score distributions peaking at ∼0.1, with essentially no density above 0.2. The rest of the distributions confirm the power of using sequence conservation for functional residue identification: for most proteins, even an MSA composed of a random subset of sequences from a PSI-BLAST search will have a conservation pattern that produces a prediction statistically significantly different from random residue selection. Notably, the F-Score distributions of randomly-selected MSAs peak at ∼0.3; this represents the background conservation signal averaged over all MSAs sampled (Fig. 2, red line).
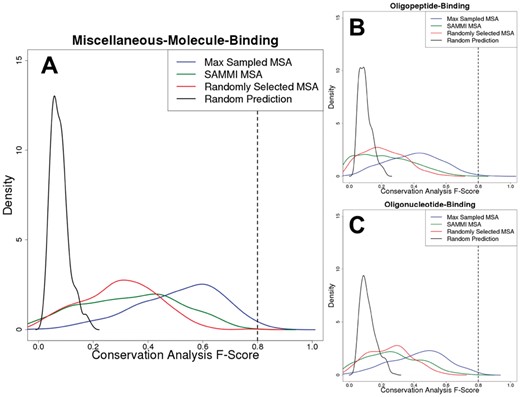
Sequence conservation-based binding site residue predictions can approach the practical upper limit of binding site definition. Conservation analysis F-Score distributions for the three datasets used in this work (A: miscellaneous-molecule-binding, B: oligopeptide-binding, C: oligonucleotide-binding) are plotted for the Max Sampled MSAs (blue), SAMMI MSAs (green) and randomly selected MSAs (red). Specifically, the red curve was obtained by plotting the distribution of average F-Scores resulting from conservation analysis of 100 randomly selected sampled MSAs for each protein. In addition, a background F-Score distribution (black) representing the likelihood of selecting functional residues by chance was obtained by randomly selecting a number of residues (with relative solvent-accessibility greater than zero) equal to the number of annotated functional residues for each protein and averaging the resulting F-Score over 264 trials. The dashed lines at F-Scores of ∼0.8 indicate the approximate theoretical upper limit that was established by analysis of the agreement between different databases. The plotted density functions are accurate representations of the underlying data (Supplementary Fig. 2)
The most important finding in these distributions is that using correct MSA selection (the optimally composed ‘Max Sampled MSA’, i.e. selecting the best-performing MSA out of all 264 sampled ones), one would consistently identify over half of binding site residues, with few false positives [F-Score distributions peak at ∼0.6, (Fig. 2, blue line)]. This value approaches the practical upper limit of ∼0.8 that was established in Figure 1. The Max Sampled MSA F-Score distributions do not change statistically significantly whether BioLiP or FireDB are used as sources of functional residue annotation (Supplementary Fig. S1), suggesting that the upper limit on performance is independent of benchmark dataset.
The signal for functional residue conservation is generally strongest for miscellaneous-small-molecule-binding proteins (Fig. 2A), with its Max Sampled MSA F-Score having a median of 0.54. This could be due to this dataset being enriched in enzymes, whose catalytic residues are under greater evolutionary pressure to stay invariant than general ligand-binding residues. The conservation signals appear weakest for the oligopeptide-binding proteins (Fig. 2B), with its median Max Sampled MSA F-Score being 0.41, while that of the oligonucleotide-binding proteins (Fig. 2C) is slightly stronger at 0.45. This may suggest that although protein-nucleotide interactions are similar to protein-protein interactions, they may be slightly more conserved in general due to the necessity of interacting with negatively charged DNA molecules (Ahmad, 2008).
Nevertheless, there is a non-negligible overlap between the F-Score distributions of random MSA selection and random residue prediction (Supplementary Table S1). Specifically, the 30% overlap between random MSA selection and random residue prediction for the oligopeptide-binding set may explain the conflicting conclusions reported in the literature with respect to protein binding site conservation; some studies state that conservation is non-existent or weak at best (Caffrey et al., 2004; Grishin and Phillips, 1994), while others find they can be well predicted by conservation (Guharoy and Chakrabarti, 2005; Valdar and Thornton, 2001a,b). A similar 33% overlap is observed for the oligonucleotide-binding set, which may point to the fundamental similarity between protein-protein and protein-nucleotide interactions (Ahmad, 2008; Pujato et al., 2014).
3.3 Focusing on methods to select optimally composed MSAs could greatly contribute to functional residue identification
Selecting an optimal MSA for conservation analysis has the potential to achieve F-Scores of above 0.6 for ∼30% of the proteins (depending on the dataset); at this F-Score we have demonstrated that the main question to consider becomes one of binding site definition rather than identification. Optimal MSAs exclude proteins, which had evolutionarily diverged in function or ligand specificity despite having met a rigorous PSI-BLAST search e-value cutoff. Indeed, attempting to predict functional residues based on all the sequences in such a PSI-BLAST profile results in performance similar to that of randomly selecting MSAs (Supplementary Fig. S3), but with more cases completely failing to predict the annotated binding site, reflecting the mixing of different functional site conservation signals. Furthermore, only an average of 9% of the sequences in the full PSI-BLAST profile are included in the theoretically optimal, Max Sampled MSAs (Supplementary Fig. S4). Attempts exist to automatically assign functional specificities of homologs in MSAs using statistical and information-theoretic approaches (Reva et al., 2007; Sankararaman and Sjölander, 2008)—these may help provide better starting points for sampling sets of included homologs than a raw PSI-BLAST match set. Regardless of the initial MSA sampling, information-theoretic ideas can be adapted to identify optimal MSAs from among those sampled.
SAMMI, an information-theory-based method, was recently introduced to rank and choose an optimally composed MSA from a large set of sampled alternative input MSAs (Fig. 2, green line). SAMMI clearly provides an advantage for the miscellaneous-molecule-binding dataset, but its benefit for the oligopeptide-binding and oligonucleotide-binding sets appears tenuous at best. However, the benefit of SAMMI is strong in all datasets when considering the subset of proteins with Max Sampled F-Scores greater than 0.5 (Supplementary Fig. S5). The difference between the SAMMI-selected MSA and randomly selected MSA F-Score distributions is more pronounced in this subset at values near 0, as well: although it appears that a greater proportion of SAMMI-selected MSAs have ‘random’ residue predictions than those from randomly selected MSAs, we infer that this is in fact due to the detection of unannotated functional sites, as has been shown previously with the miscellaneous-molecule-binding dataset (Gil and Fiser, 2018).
Diversity of Protein Scores (DOPS) is an approach to assessing the reliability of functional site predictions obtained from conservation analysis—this method calculates an information-theoretic entropy of conservation scores obtained by the ‘scorecons’ approach, with the hypothesis that only MSAs with sufficiently diverse conservation scores along their lengths are considered ‘reliable’. Interestingly, although DOPS was originally intended to provide a cutoff value for reliability, selecting the single MSA with highest DOPS score appears to result in functional site prediction performance equivalent to that of MSAs selected by SAMMI on 126/275 proteins from miscellaneous-molecule-binding dataset (median F-Score of 0.35 for DOPS versus 0.36 for SAMMI; Supplementary Fig. 6). A drawback of the approach is that DOPS has a high computational cost that makes it impractical for assessing MSAs that include several thousand homologs.
3.4 Current functional site prediction methods appear to be limited by naïve MSA selection
Conservation analysis on randomly selected MSAs produces an F-Score distribution with a median value of 0.30 for the miscellaneous-molecule-binding dataset. To put this observation into context, this approximately matches what is reported by a number of current state-of-the-art non-template-based functional residue prediction methods applied to enzyme catalytic and ligand-binding residue datasets (Fig. 3; Table 1) (Amitai et al., 2004; Chen et al., 2014; Fajardo and Fiser, 2013; Sankararaman et al., 2010; Sun et al., 2016; Wong et al., 2013; Youn et al., 2007; Zhang et al., 2008). It should be noted that to date no functional residue prediction method exists that was benchmarked on a ligand set as diverse as the one used in this study. Regardless, results shown in Figure 3 and Table 1 are taken directly as reported in the original publications, and therefore the variations among these also reflect the different choices of benchmark datasets. Several of these methods use PSI-BLAST profiles as a raw input to machine learning approaches, suggesting that they identify a ‘baseline’ conservation signal similar to the one in this work represented by random MSA selection. However, this signal is typically the most dominant among all inputs (Fajardo and Fiser, 2013). When comparing performances of each of the machine learning methods developed over the last decade, the advances in functional residue prediction have been remarkably small, especially given the pace of sequence database growth. As we have shown here, conservation analysis of a correctly selected, ‘most informative’ MSA can have dramatic effect in improving the accuracy of the approaches. In fact, a straightforward conservation analysis alone using the most informative MSA would not only potentially double the accuracy of current functional site prediction methods, but would also approximate the practical upper limit of these approaches, due the ambiguity of functional site definitions (Fig. 3).
Summary of state-of-the-art non-template-based functional residue prediction approaches
| Method | Reference | Description | F-Score |
|---|---|---|---|
| Sarig Server | Amitai et al. (2004) | Structure-based network analysis | 0.137 |
| Youn et al. | Youn et al. (2007) | Support vector machine (SVM) using sequence and structural features | 0.279 |
| CRPred | Zhang et al. (2008) | SVM using sequence features | 0.282 |
| DISCERN | Sankararaman et al. (2010) | Logistic regression model using phylogenomic and structural inputs | 0.286 |
| Conservation-distance-aa | Fajardo and Fiser (2013) | Artificial neural network (ANN) using sequence and structural features | 0.269 |
| Wong et al. | Wong et al. (2013) | SVM to find ligand-binding pockets based on structure and sequence properties | 0.342 |
| LigandRFS | Chen et al. (2014) | Random forest (RF) classifier using sequence features | 0.344 |
| CRHunter (non-template- based portion) | Sun et al. (2016) | SVM using sequence and structural features generated by Delaunay triangulation and Laplacian transformation of protein structures | 0.350 |
Note: F-Scores are taken as reported in the original publications or calculated from reported precision and recall values. The exception is Sarig Server, which does not report F-Score in its original publication; the listed F-Score is taken from the ‘Conservation-distance-aa’ publication, where Sarig Server was also benchmarked.
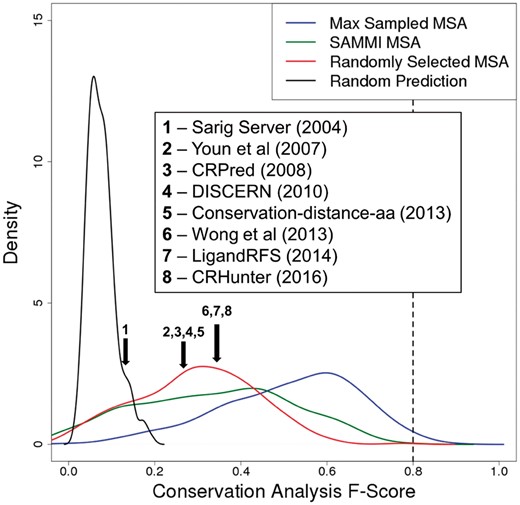
Modern functional residue prediction methods are equivalent to conservation analysis on a randomly selected MSA. Reported F-Scores of representative state-of-the-art methods for predicting enzyme catalytic and ligand-binding residues, overlain on the F-Score distributions obtained for the miscellaneous-molecule-binding dataset in this work. The mean reported F-Scores of methods 2, 3, 4 and 5 are all between 0.25 and 0.30, while that of methods 6, 7 and 8 are ∼0.35. Although the performances of each method were calculated based on different benchmark datasets, they exhibit similar results and appear roughly equivalent to using conservation analysis on a randomly selected MSA. All methods involve statistical analysis of sequence and/or structural features, mostly by using machine learning approaches. Brief descriptions the methods and their reported performances are listed in Table 1
Machine learning methods have also been recently developed for the specialized task of predicting the more challenging peptide binding (Taherzadeh et al., 2016,, 2018; Zhang and Kurgan, 2017) and nucleotide-binding (Liu and Hu, 2013; Yan et al., 2016) residues. The median values of the randomly selected MSA F-Score distributions for the oligopeptide-binding and oligonucleotide-binding datasets were 0.20 and 0.26, respectively. The machine learning methods corresponding to these ligand types offer a small benefit compared to random MSA selection, but conservation analysis of the ‘correct’ MSA would again provide superior performance. Our results suggest that advances in functional residue prediction should focus on de veloping methods for optimizing sequence profiles rather than blindly relying on machine learning approaches from the start of a prediction pipeline.
3.5 Statistical significance of functional residue predictions
In order to facilitate the statistical interpretation of F-Scores in protein functional residue prediction, we constructed a background distribution of F-Scores for every individual protein in each of the datasets. To calculate the P-value for each protein functional residue prediction F-Score, we first calculate ‘background’ F-Score distributions by randomly sampling N residues (with relative solvent accessibility greater than zero) 264 times, where N is the number of annotated functional residues in the protein. This gives an approximately normal distribution with mean ‘Fbackground’ along with a standard deviation ‘S’. For each F-Score F, we then calculate a Z-Score by Z = (F – Fbackground)/S. Z-Scores have one-to-one correspondence to P-values by p = 2*Φ(-Z), where Φ is the cumulative distribution function for a standard normal random variable (Fig. 4, Supplementary Table S2). These calculations show that P-values drop sharply for the miscellaneous-molecule-binding proteins upon the F-Score reaching 0.20, suggesting this F-Score value should be used as a cutoff to ensure statistical significance. The corresponding P-value plots for the oligopeptide-binding and oligonucleotide-binding proteins would show a similar drop at an F-Score value of approximately 0.25.
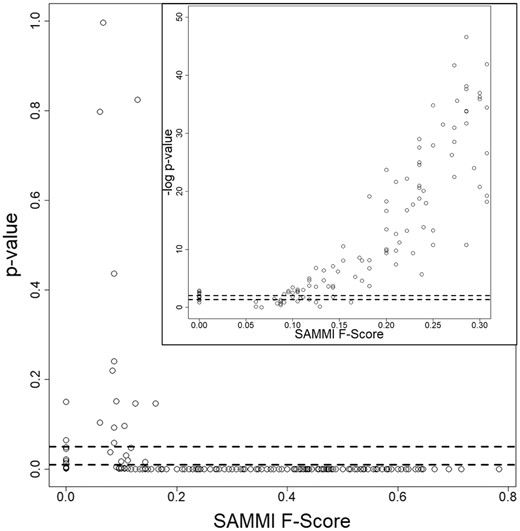
Statistical significance of SAMMI MSA F-Scores obtained for the set of 275 misc.-molecule-binding proteins. Each point represents the P-value obtained for an individual protein’s SAMMI F-Score. The plot shows that P-values drop sharply after the F-Score reaches 0.20. The inset shows the negative base 10 logarithm of the P-values and demonstrates a corresponding monotonically rising trend. The cluster of P-values at F-Scores of 0 indicates the statistical significance of these predictions as well; for these cases, it is likely that the SAMMI MSA conservation pattern detects a secondary binding site or unannotated functional residues. The dashed lines indicate P-values of 0.05 and 0.01 (-log10 applied in inset). Similar plots were obtained for the oligopeptide-binding and oligonucleotide-binding datasets. Plotting the P-values of random MSA selection F-Scores would also show a similar drop at an F-Score value of 0.25
These findings are notable because of the aforementioned performances of state-of-the-art non-template-based functional residue prediction methods: their average F-Scores just barely satisfy statistical significance. This also highlights the importance of using the F-Score as a benchmarking measure for functional residue prediction as opposed to traditional sensitivity/specificity ROC plots or the accuracy; since true negatives far outnumber true positives in this application, the specificity (ratio of true negatives to sum of true negatives and false positives) and accuracy (ratio of sum of true positives and true negatives to total number of protein residues) can inappropriately reward methods and make high values of these measures misleading even though they are statistically significant. For example, for a 100-residue protein with 10 annotated functional residues, a 10-residue prediction that completely misses the functional residues would have an accuracy of 0.80. Similarly, reported ROC analyses in state-of-the-art functional residue prediction methods become uninformative because they explore only a horizontally narrow portion of the ROC curve, due to sensitivity values being universally high. This again results from the class imbalance problem of functional residue prediction.
3.6 Practical significance of F-score improvements
We illustrate the practical significance of attaining improvements in F-Scores by showing three predictions of the ligand-binding residues of human CD38 extracellular domain (PDB 3dzhA) (Liu et al., 2008), which in addition to being a lymphocyte surface antigen normally catalyzes the conversion of nicotinamide adenine dinucleotide (NAD) into cyclic adenine diphosphate ribose (cADPR). Guanosine triphosphate (GTP) can act as a competitive inhibitor of this enzyme, fitting well into the 10-residue BioLiP-annotated active site (Fig. 5). The conservation analysis of an ‘average-performing’ MSA, representing random MSA selection, correctly identifies just 3 functional site residues, with 7 false positive residues being scattered across the CD38 structure, yielding an F-Score of 0.3 (Fig. 5A). In contrast, conservation analysis of the SAMMI-selected correctly identifies 5 functional site residues, which surround the guanine group of GTP, giving an F-Score of 0.5 (Fig. 5B). For this case, the performance of the SAMMI-selected MSA approaches that of the Max Sampled MSA, which correctly identifies 6 active site residues for an F-Score of 0.6, with its 4 false positive residues surrounding the active site (Fig. 5C).
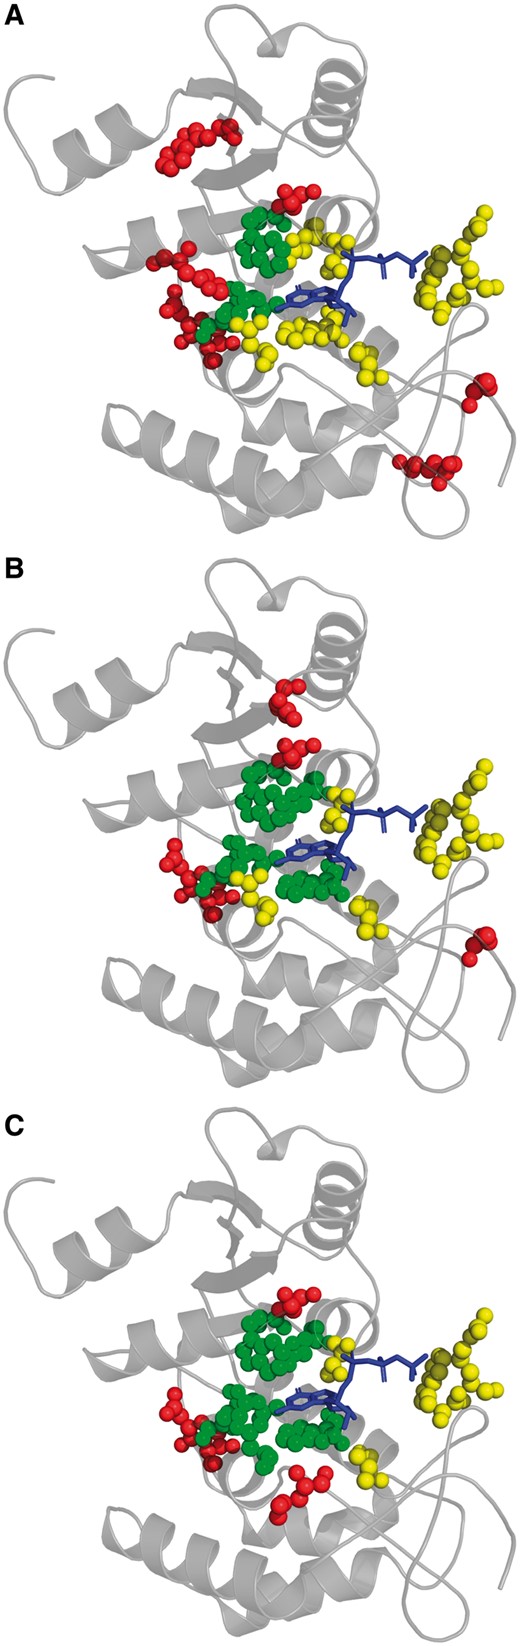
Example of functional residue prediction of CD38 extracellular domain (PDB 3dzhA; gray cartoon) using an ‘average-performing’ MSA representing random MSA selection (A; F-Score = 0.3), the SAMMI-selected MSA (B; F-Score = 0.5) and the Max Sampled MSA (C; F-Score = 0.6). Balls represent residues that either are BioLiP-annotated to bind or are predicted to bind to the GTP (blue stick model), an inhibitory ligand of CD38. True positive, false negative and false positive residue atoms are respectively represented by green, yellow and red balls
This example demonstrates the substantial impact that selecting an MSA including an optimal set of sequence homologs can have on functional residue prediction. A naively-selected MSA clearly produces a minimally useful result that precludes any functional characterization of CD38. On the other hand, the conservation pattern of an optimally informative MSA allows for the identification of the most important active site residues of CD38—those that interact with the guanine group of GTP—from sequence information alone.
Funding
This work was supported by National Institutes of Health (NIH) grant R01 GM118709, and the Extreme Science and Engineering Discovery Environment (XSEDE) project (NSF grant ACI-1053575). NG was supported by the National Research Service Award (NRSA) individual fellowship F31GM116570 and the Medical Scientist Training Program (MSTP) grant T32GM007288.
Conflict of Interest: none declared.
References

