


Abstract
Kmer-db is a new tool for estimating evolutionary relationship on the basis of k-mers extracted from genomes or sequencing reads. Thanks to an efficient data structure and parallel implementation, our software estimates distances between 40 715 pathogens in <7 min (on a modern workstation), 26 times faster than Mash, its main competitor.
https://github.com/refresh-bio/kmer-db and http://sun.aei.polsl.pl/REFRESH/kmer-db.
Supplementary data are available at Bioinformatics online.
1 Introduction
Large volumes of data generated during the course of sequencing thousands of different organisms [100 K Pathogen Genome Project (Weimer et al., 2017), NCBI Pathogen Detection (https://www.ncbi.nlm.nih.gov/pathogens)], require fast analysis methods. Short substrings of nucleotide sequences, called k-mers, are commonly used in this area as they can be extracted either from genomes or sequencing reads, allowing assembly free approach. They enable accurate approximation of evolutionary distances between organisms, thus are used for phylogeny reconstruction (Mash; Ondov et al., 2016), bacteria identification (StrainSeeker; Roosaare et al., 2017) or metagenomic classification (MetaCache; Müller et al., 2017). Importantly, if genomes are closely related, small subsets of k-mers are sufficient for obtaining acceptable accuracy, significantly reducing processing time. Nevertheless, as the number and the diversity of sequenced genomes continuously increases, the throughput of existing algorithms will soon become a bottleneck.
We introduce Kmer-db, a tool for k-mer-based analysis of large collections of sequenced samples. Thanks to a novel compressed k-mers representation and parallel implementation, our software is able to process thousands of bacteria genomes in minutes on a modern workstation.
2 Materials and methods
The main analysis starts from build step, i.e. the construction of a database for a set of samples, either from assembled genomes or sequencing reads. At the beginning, all k-mers are extracted analogously as in KMC (Kokot et al., 2017). This can be optionally followed by minhash filtering (Broder, 1997) which saves memory and time at the cost of accuracy. Samples are processed independently by threads (for efficiency, disk operations are serialized, though). In contrast to some existing solutions, instead of selecting fixed-size subset of k-mers (referred to as a sketch), Kmer-db retains assumed fraction of them. As values of the hash function are uniformly distributed, this can be done straightforwardly by thresholding. This simplifies the procedure of k-mers filtering (immediate decision whether k-mer is accepted) providing similar accuracy as fixed-sized sketches.
A basic data representation could rely on storing for each sample the corresponding k-mer set. Excessive time and memory requirements make this approach prohibitive for large sample sets, unless k-mer filtering method is used. Presented strategy is different. It is based on k-mer templates, i.e. lists of sample ids (). Such a list is defined for each k-mer. The idea behind is that multiple k-mers may occur in exactly same samples, thus they share a template. Moreover, templates are often similar which allows further compression. As a result, Kmer-db consists of two basic structures: (i) a hashtable mapping k-mers to corresponding template ids (), (ii) a table of compacted templates.
Samples are added to the database incrementally, with increasing identifiers. Let S indicate analyzed sample identified by . For each k-mer from S, we record corresponding template identifier, , from in an auxiliary array A (k-mers not present in are inserted with special value ). Array A is used to determine whether all k-mers with particular are present in sample S. If so, template from is extended with . If not, a new template is added to and corresponding entries in are updated. The new template should contain all samples from considered and additionally . To reduce redundancy, is a hierarchical structure—a new template stores only on its list together with an identifier to its parental template. For this reason is referred to as compacted templates. Since samples are added to the database with increasing identifiers, lists of in table are also increasing, thus they can be stored with a use of Elias gamma code (Elias, 1975), with about an order of magnitude space reduction compared with storing plain ids. The state of Kmer-db structures after adding five samples is presented in Figure 1. The intermediate states can be found in Supplementary Figures S1–S5. Incremental addition of samples to the database imposes parallelization at the level of a single sample. In particular, following operations are distributed among CPU threads: (i) searching k-mers in dictionary, (ii) sorting A array and (iii) extension of templates in .
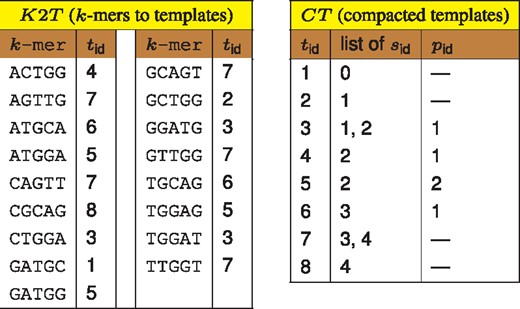
Database state (k = 5) after adding samples: ACTGGATGCAG, GCTGGATGGAG, ACTGGATGGAG, ATGCAGTTGGT, CGCAGTTGGT. The structures can be used for obtaining list of samples for given k-mer. For example, k-mer GGATG is assigned with template () 3, whose parent () is template 1. Thus, GGATG is present in all samples () from templates {3, 1}, which are {0, 1, 2}
The complete database can be further used for estimating evolutionary relationship between samples by determining numbers of common k-mers. One of the available Kmer-db modes is all2all which determines matrix of common k-mer counts for all samples in a database. When tens of thousands of samples are analyzed, matrix M of common k-mers counts requires gigabytes of memory. Therefore, maintaining cache locality when updating M elements is of crucial importance. For each template from , the algorithm iterates over its list and generates a collection of pairs, stored in a cache-fitting buffer. Then, groups of pairs with same first element are identified by generating histograms. Note, that each group corresponds to a single M row: first element of a pair () is a row number, while second element () points to a template, whose entries indicate columns. The groups can be used to increment corresponding elements of M by template cardinality. Multithreading in all2all mode concerns: (i) decompression of Elias gamma templates, (ii) histogram generation, (iii) update of distance matrix rows. Additionally, when incrementing M elements, vectorization based on AVX CPU extensions is employed.
An alternative mode is one2all which produces vector V of common k-mer counts between new sample and all samples in a database. For all k-mers from the algorithm selects corresponding templates, using hashtable, and increments V elements accordingly. Also this mode takes advantage of parallelism—threads process independent subsets of templates and update own copies of V, which are merged afterwards.
The output of all2all and one2all stages are textual files with numbers of shared k-mers between pairs of samples and the total numbers of k-mers in each sample. They can be used to calculate various distance measures, e.g. Jaccard index, Mash distance. This is made by the distance mode.
The C++14 source code of Kmer-db is distributed under GNU GPL 3 licence. The tool itself is available as a set of multiplatform binaries.
3 Results
The main experiments concerned calculation of distances between 40 715 assembled genomes from NBCI Pathogen Detection on the basis of 20-mers. Samples were sorted w.r.t. species tax id (see Supplementary Material for other orderings). As the main competitor, we selected Mash (Ondov et al., 2016), since it implements essentially the same strategy as used in the NBCI Pathogen Detection project.
As a first step, we investigated how Kmer-db fraction-based minhashing is related to the Mash sketch-based strategy in terms of approximating evolutionary relationship between all pathogens. As a criterion, we employed Mash distance, which can be calculated straightforwardly from Jaccard index and was shown to approximate well (average nucleotide identity) (Ondov et al., 2016). As a reference, distances calculated from all k-mers were used. The analysis of the mean absolute error (MAE, see Fig. 2) showed that taking 0.02% of k-mers by Kmer-db retained the accuracy of default Mash configuration (1000 sketch). Analogously, 0.2% corresponded to 10 000 sketch which was used in the NCBI project. We were not able to run Mash with 100 000 sketch, tough it will probably render similar accuracy to 2% Kmer-db fraction. Same relations between Kmer-db and Mash configurations were observed on 500 Escherichia coli genomes taken from Ondov et al. (2016) study (Supplementary Table S2). An important observation which comes from Figure 2, is that divergent organisms require more k-mers to keep the error at sensible level, which is in agreement with theoretical error bound analysis presented by Ondov et al. (2016). For example, when the distance was in interval, default sketch of 1, 000 (0.02% fraction) rendered unacceptable accuracy (MAE > 0.2). Tenfold increase in the number of k-mers reduced the error by an order of magnitude. For more divergent sequences, even full k-mer set may be required to obtain reliable distance estimation.
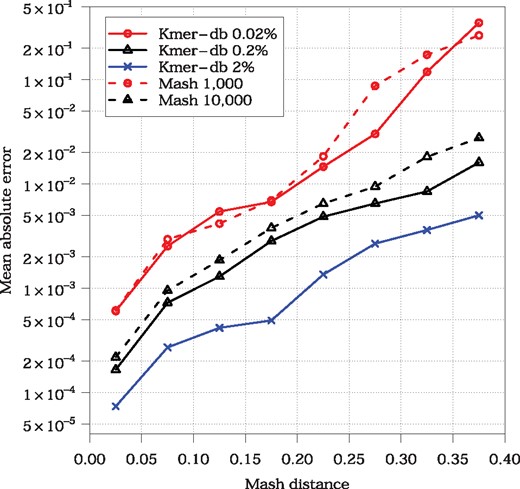
The error of Mash distance estimation w.r.t. actual Mash distance (calculated on the basis of all k-mers). Evaluation was done on the entire set of 40 715 pathogenes (almost a billion of sequence pairs). Points on the charts represent intervals, i.e. [0, 0.05), [0.05, 0.1), etc. Each interval contained at least 5 million of distances. Distances ≥ 0.4 are not shown
In further experiments, Mash was configured to use 10 000 k-mers per sample, while Kmer-db was run in two configurations: (i) with minhashing at 0.2% threshold and (ii) on full k-mer set. To evaluate software scalability, the subsets of 1, 2, 5, 10 and 20k samples were randomly selected from the full dataset. Table 1 presents the results of building a database from genomes (Mash: sketch step; Kmer-db: build step) and determining a distance matrix from the database (Mash: dist step; Kmer-db: all2all step). Detailed results are presented in Supplementary Material.
Comparison of corresponding Kmer-db and Mash steps in terms of required time (h:mm:ss format) and memory (gigabytes)
| No. samples | Mash | Kmer-db | Kmer-db | ||||||||||
|---|---|---|---|---|---|---|---|---|---|---|---|---|---|
| sketch size 10 000 | fraction 0.2% | all k-mers | |||||||||||
| RAM | speedup | RAM | RAM | ||||||||||
| 1000 | 0:12 | 0:06 | 0:18 | 0.9 | 0:07 | 0:01 | 0:08 | ×2.3 | 1.3 | 4:21 | 0:15 | 4:36 | 15.2 |
| 2000 | 0:24 | 0:24 | 0:48 | 1.1 | 0:14 | 0:01 | 0:15 | ×3.2 | 1.4 | 7:22 | 0:24 | 7:46 | 27.9 |
| 5000 | 1:03 | 2:25 | 3:28 | 1.7 | 0:37 | 0:02 | 0:39 | ×5.3 | 1.4 | 15:00 | 1:33 | 16:33 | 28.8 |
| 10 000 | 2:07 | 9:33 | 11:40 | 2.7 | 1:13 | 0:06 | 1:19 | ×8.7 | 1.5 | 30:09 | 3:40 | 33:49 | 55.2 |
| 20 000 | 4:10 | 37:45 | 41:55 | 4.8 | 2:27 | 0:20 | 2:47 | ×15.1 | 1.5 | 52:25 | 13:10 | 1:05:35 | 57.4 |
| 40 715 | 8:35 | 2:36:54 | 2:45:29 | 9.8 | 4:58 | 1:25 | 6:23 | ×26.0 | 3.4 | 1:32:05 | 1:27:19 | 2:59:24 | 60.7 |
Note: Hardware configuration: two Xeon E5-2670 v3 CPUs (2 × 12 double-threaded 2.3 GHz cores), 256 GB of RAM, and six 1 TB HDDs in RAID-5. The speedups of Kmer-db 0.2% are related to Mash.
Kmer-db, when using 0.2% of k-mers was astonishingly fast. Evaluated on full dataset it was 26 times faster than Mash (below 7 min versus almost 3 h) and needed less memory (3.4 GB versus 9.8 GB). Calculation of distances from already built structure contributed mostly to the superior execution times of Kmer-db: it required 85 s—hundred times less than the competitor. Analyzing all k-mers from all samples by Kmer-db (unfeasible to Mash due to computational requirements), took same time as running Mash on ∼500 times smaller representation.
Importantly, our solution scaled well, especially in terms of memory usage. For example, increasing sample set 2-fold from 20 to ∼40k resulted in only 6% growth of RAM, which is thanks to the internal representation of Kmer-db (when the database is large, a lot of k-mers from new samples share existing templates or their parts). We also noticed that for increasing sets of samples, execution time of Kmer-db became dominated by matrix estimation, i.e. all2all step (see Supplementary Tables S3 and S4).
In Figure 3 we show the relative change of Kmer-db time and memory requirements for varying k-mer size (k = 20 was selected as a reference). The database construction time (build step) was approximately constant. The distance calculation time (all2all) decreased slightly with increasing k, with an exceptional large value observed for k = 16. This was due to fact that short k-mers are likely to be present in genomes by chance, thus may be common even for unrelated samples, increasing drastically the number of updates of the distance matrix. As for the memory requirements, they remained unchanged for k from range [16, 26] but increased almost 2-fold for k = 28. This was caused by the restructuring of hashtable (small increase in the number of stored k-mers pushed load factor above the threshold and resulted in doubling the size of the table).
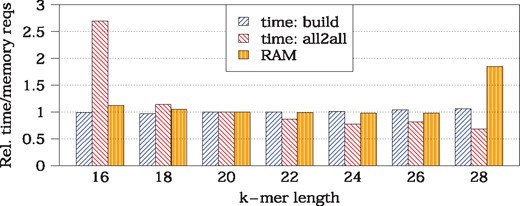
Time and memory requirements of Kmer-db (all k-mers, all samples) with varying k-mer length. Results are given relatively to k = 20
The additional experimental part concerned the calculation of similarity vector between a new k-mer set obtained directly from sequencing reads and the already-build database (Mash dist step; Kmer-db one2all step). The corresponding times were: 5 s (Mash), 1 s (Kmer-db 0.2%), and 1 min (Kmer-db all).
4 Conclusions
Superior running times and scalability of Kmer-db opens new opportunities in k-mer-based estimation of evolutionary distances. Our algorithm analyzed resampled k-mer set of 40 715 bacterial genomes in <7 min, 26 times faster than Mash, confirming the readiness of Kmer-db for processing much larger datasets which are to appear in the near feature. Presented approach was also able to compare distantly related genomes with few k-mers in common, where minhashing is inaccurate. Kmer-db was able to process all k-mers of analyzed bacteria in a time needed by the competitor for 500 times smaller k-mer set.
Funding
This work was supported by National Science Centre, Poland under project [DEC-2015/17/B/ST6/01890] and Silesian University of Technology under [BKM-509/RAU2/2017] project. The infrastructure was supported by [POIG.02.03.01-24-099/13] grant: ‘GeCONiI—Upper Silesian Center for Computational Science and Engineering’.
Conflict of Interest: none declared.
References
Author notes
The authors wish it to be known that, in their opinion, the first two authors should be regarded as Joint First Authors.

