


Abstract
Bionano optical mapping is a technology that can assist in the final stages of genome assembly by lengthening and ordering scaffolds in a draft assembly by aligning the assembly to a genomic map. However, currently, tools for visualization are limited to use on a Windows operating system or are developed initially for visualizing large-scale structural variation. MapOptics is a lightweight cross-platform tool that enables the user to visualize and interact with the alignment of Bionano optical mapping data and can be used for in depth exploration of hybrid scaffolding alignments. It provides a fast, simple alternative to the large optical mapping analysis programs currently available for this area of research.
MapOptics is implemented in Java 1.8 and released under an MIT licence. MapOptics can be downloaded from https://github.com/FadyMohareb/mapoptics and run on any standard desktop computer equipped with a Java Virtual Machine (JVM).
Supplementary data are available at Bioinformatics online.
1 Introduction
Optical mapping is a technology that gives insight into the basic structure of large DNA fragments. It can be used as an extra step to a genome assembly to improve ordering, orientation and length of scaffolds. Traditionally, optical mapping suffered from a high error rate, making it unreliable for accurate genome assemblies. However, as with the recent advances of other sequencing platforms, optical mapping has largely overcome its limitations and is now used in many genomic studies (Phillippy, 2017; Yuan et al., 2017). Now available are optical maps derived from high throughput nano-channels performed by Bionano systems (Dai et al., 2018; Pendleton et al., 2015). With modern techniques, restriction enzyme digestion of long DNA molecules (∼500 kb) is performed by one or more ‘nickase’ enzymes, modified to only digest single strands at a particular site. These sites are then repaired with fluorescent nucleotides which can be imaged to form a unique barcode on the molecule (Udall and Dawe, 2018). Even newer technologies such as Bionano Direct Label and Stain Technology (DLS) offer non-destructive methods of creating optical maps that are even longer (>2 Mbp) with enzymes that label the sites without digestion. These long DNA molecules are assembled to form a genome consensus map. Genome assembly scaffolds can then be digested in silico to form barcoded molecules that can be aligned to this consensus map. During this alignment process, errors in the assembly can be recognized and corrected, therefore improving the sequence completeness and accuracy further (Jiao and Schneeberger, 2017; Seo et al., 2016). Visualization post-alignment can give insight into the quality of the alignment and recognition of mis-assemblies. This is key to understand the success in the technique and in assisting manual conflict resolution to improve results further.
There are five tools currently available for visualization of optical mapping alignment: BioNumerics v7 JBrowse (Skinner et al., 2009), OMView (Leung et al., 2017), Bionano’s IrysView (https://bionanogenomics.com/support-page/irysview) and Bionano’s Access (https://bionanogenomics.com/support-page/bionano-acces). However, only two of these tools provide views useful to a genome assembly context. The tools BioNumerics v7, JBrowse and OMView provide visualization of map alignment at a one-to-one scale with the aim to detect large regions of structural variation between two sequences. Whereas, IrysView and Access can also provide visualization on a smaller scale, showing multiple scaffolds from a genome assembly aligned to the optical map. This view is useful to visualize mis-assemblies and mis-orientations of scaffolds within the dataset. However, IrysView and Access are primarily alignment tools; in other words, they perform the computationally heavy alignment stages, making their performance sometimes slow. There is no current lightweight and user-friendly alternative tool for alignment visualization. In addition, IrysView is limited to use on a Windows platform and Access is only available on an online server; meaning there is no locally run Linux-based tool for this purpose.
2 MapOptics
MapOptics is developed in Java 8 to ensure cross-platform compatibility; the tool uses Java Swing components and the Graphics2D library to keep visualization simple and fast to load (see the Supplementary Material S1 for the software overall architecture). The user is only required to input two CMAP files (a reference and query) and an XMAP file in Bionano format and the tool will display all the alignments between the two map files for the user to navigate through. In particular, it provides a tool for visualization of hybrid scaffolding results generated based on optical mapping and contig/scaffold assembly. Unique to this tool is a highly interactive view of all scaffolds aligned to the optical map, which allows the user to assess the quality of these alignments and the quantity of mis-assemblies and scaffold overlaps. It also allows the user to explore the alignment of scaffolds to hybrid-scaffolds to visualize this stage of assembly.
3 Assembly visualization
MapOptics provides tabs of three different views for visualization, to allow exploration of the data at different zoom levels (see Fig. 1). The Summary View tab (Fig. 1A) provides an overall summary of the maps loaded and a simple alignment view panel. It allows the user to explore basic statistics of the reference dataset, such as contig lengths and label densities, the latter being useful to confirm that the correct nicking enzyme was used. Using MapOptics, the user can highlight the distribution of label densities against the recommended values. Moreover, the user can select a reference contig of interest to have the specific values and alignment associated with it. The Reference View tab (Fig. 1B) provides a more interactive view of a chosen reference contig. It visualizes all scaffolds aligned to the chosen contig which can be dragged, re-oriented or deleted by the user. These changes can be saved to ease navigation in Summary View. Here, the user can also load a conflicts_cut_status.txt file generated from hybrid scaffolding and visualize contigs where the conflicts were resolved. This allows the user to navigate and assess this automated process, make their own decisions and export the file for manual conflict resolution. The Query View tab (Fig. 1C) provides a close up of just one alignment for more detail on quality of individual labels. The user can upload a FASTA file and explore gaps in the sequence as well as zoom into a region of choice (see Supplementary Material S2 for additional functionalities). These Views interact with each other, updating to match the reference or query contig selected whenever it is changed, allowing ease of navigation and images from the displays can be exported so any key alignments of interest can be shared and stored for later use.
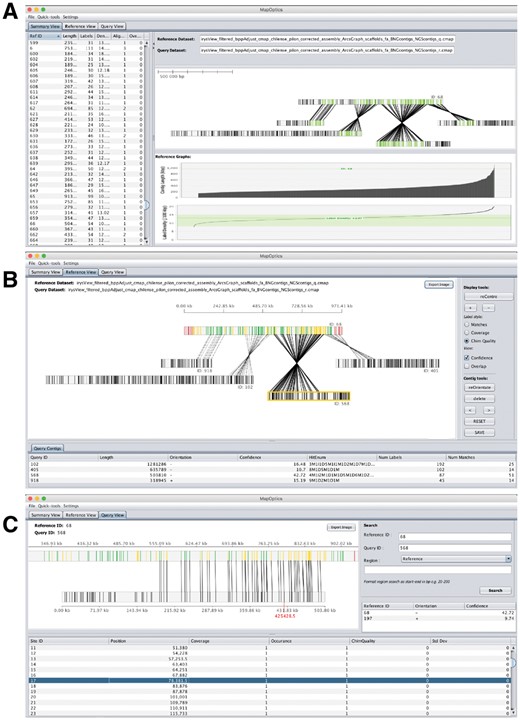
(A) (top left) Summary View—provides an overall summary on the maps loaded and a simple alignment view. (B) (top right) Reference View—provides a more interactive view of the reference map/scaffold chosen and visualizes all aligned scaffolds relative to that which can be manipulated by the user. (C) (bottom middle) Query View—provides a close up of just one alignment for more detail on quality of individual labels and the ability to zoom into a region of choice
4 Conclusions
MapOptics provides a lightweight and user-friendly way to visualize scaffold assembly and optical mapping alignment. The data can be explored at different levels of depth in an interactive way so the user can customize how best to display their data.
Funding
MapOptics was developed as part of the BBSRC-funded project ‘Genomics-assisted selection of Solanum chilense introgression lines for enhancing drought resistance in tomatoes’—BB/L011611/1.
Conflict of Interest: none declared.
References

