


Abstract
Cardiovascular disease is the primary cause of death globally accounting for approximately 17.7 million deaths per year. One of the stakes linked with cardiovascular diseases and other complications is hypertension. Naturally derived bioactive peptides with antihypertensive activities serve as promising alternatives to pharmaceutical drugs. So far, there is no comprehensive analysis, assessment of diverse features and implementation of various machine-learning (ML) algorithms applied for antihypertensive peptide (AHTP) model construction.
In this study, we utilized six different ML algorithms, namely, Adaboost, extremely randomized tree (ERT), gradient boosting (GB), k-nearest neighbor, random forest (RF) and support vector machine (SVM) using 51 feature descriptors derived from eight different feature encodings for the prediction of AHTPs. While ERT-based trained models performed consistently better than other algorithms regardless of various feature descriptors, we treated them as baseline predictors, whose predicted probability of AHTPs was further used as input features separately for four different ML-algorithms (ERT, GB, RF and SVM) and developed their corresponding meta-predictors using a two-step feature selection protocol. Subsequently, the integration of four meta-predictors through an ensemble learning approach improved the balanced prediction performance and model robustness on the independent dataset. Upon comparison with existing methods, mAHTPred showed superior performance with an overall improvement of approximately 6–7% in both benchmarking and independent datasets.
The user-friendly online prediction tool, mAHTPred is freely accessible at http://thegleelab.org/mAHTPred.
Supplementary data are available at Bioinformatics online.
1 Introduction
Hypertension (HT) known as high blood pressure is the most common global health concern that affects 25% of the population and its occurrence increases with age (Chockalingam et al., 2006). Besides heart-related diseases, HT can also lead to other abnormalities like renal failure, multi-infarct dementia, amputation and HT retinopathies (Varounis et al., 2016). Due to its high prevalence and detrimental effects, it has been necessitated to discover novel drugs and treatments to reduce or eliminate HT-related repercussions. Currently, there are a number of effective drugs available in the market for the treatment of HT, such as alpha- and beta-blockers, angiotensin-converting enzyme (ACE) inhibitors, angiotensin-II receptor blockers, calcium channel blockers, diuretics, peripheral adrenergic inhibitors, renin inhibitors and vasodilators (Puchalska et al., 2015). However, these drugs induce notable side-effects, including cough, dizziness, fatigue, headaches, hyperkalemia, hypotension, impaired taste, increased potassium level, leg edema and skin rashes (Husserl and Messerli, 1981). Therefore, it remains challenging to design and deliver safer drugs for prevention and treatment of HT.
The renin–angiotensin system that plays a pivotal role in regulating arterial pressure is linked with blood pressure control. Renin converts angiotensinogen to the decapeptide angiotensin I, which further undergoes proteolytic cleavage by ACE to biologically active octapeptide, angiotensin II (Dostal and Baker, 1999; Hong et al., 2008). Angiotensin II plays a vital role in vasoconstriction, stimulates aldosterone production and increases sodium and fluid retention. Thus, inhibition of these enzymes aid in reducing blood pressure. Several bioactive peptides that inhibit angiotensin I, ACE and angiotensin II type I receptor in the cardiovascular system help in the prevention and treatment of HT (Hong et al., 2008). These bioactive peptides could be extracted from plant and animal sources, including milk and dairy products, pork, meat, fish, blood, ovalbumin, rice, wheat, potato, cereal, peas, garlic, etc. (Dostal and Baker, 1999). Such identification of bioactive peptides as antihypertensive peptides (AHTPs) led to the implementation of peptides as safe and effective drugs in the treatment of HT (Bhat et al., 2017; Jakala and Vapaatalo, 2010; Majumder and Wu, 2014; Puchalska et al., 2015). Moreover, due to the laborious and time-consuming experimental procedures, it is compelling to develop an effective computational approach for classifying available peptides as AHTP or non-AHTP.
In the recent decade, few computational studies (summarized below) have shown the potency of machine-learning (ML) approaches in AHTP classification. Initially, Wang et al. built QSAR models of ACE-inhibitor oligopeptides based on G-scale descriptors using partial least square (PLS) regression method (Wang et al., 2011). The drawback of this method is its applicability for the prediction of inhibitory activity of tiny peptides (i.e. di- and tripeptides) only. In 2015, Kumar et al. developed four different model types for predicting AHTPs with varied lengths [i.e. tiny (di- and tripeptides), small (tetra-, penta- and hexapeptides), medium (sizes ranging from 7 to 12) and large peptides (greater than 12 amino acids)] using ML approaches (Kumar et al., 2015b). For tiny peptides, SVM-based regression models were developed using chemical descriptors, and correlations of 0.701 and 0.543 were obtained for di- and tripeptides, respectively. For smaller peptides, SVM-based classification models were built and accuracies of 76.67, 72.04 and 77.39% were attained for tetrapeptides, pentapeptides and hexapeptides, respectively. Similarly, in the case of medium and large peptides, SVM-based classification models were developed using amino acid compositions, and maximum accuracies of 82.61 and 84.21% were obtained. Also, a web-based platform, AHTpin, a web-based platform, was established for predicting, designing and screening of AHTPs. Recently, another paper on AHTPs prediction using ML approaches was published (Win et al., 2018), where the authors developed classification models based on varied combinations of amino acid, dipeptide and pseudo amino acid composition descriptors using random forest (RF) approach and this method showed marginal improvement over AHTpin. Moreover, the feature importance analysis highlighted the significance of Proline and non-polar amino acids at the carboxyl terminal and the importance of short peptides for robust activity as well. Additionally, an online web server, PAAP, was developed for the proposed model.
Although the above-mentioned methods produced encouraging results and stimulated research on AHTP prediction, there are certain drawbacks associated with these approaches which are as follows: (i) only limited features have been utilized by the state-of-the-art methods, further emphasizing that other potential features yet remain to be defined; (ii) exploration of several ML algorithms on the same benchmarking dataset is necessitated and preference of an appropriate algorithm for a specific problem (AHTP prediction) rather than selecting ML algorithm randomly or choice of interest (employed in the existing methods); and (iii) embodiment of redundant features in model development decreases the performance. Thus, to eliminate redundant features and subsequently enhance the prediction performance, feature selection is usually required. However, the above-mentioned methods failed to adopt these strategies. Therefore, novel and competent computational approaches are necessitated to address the mentioned limitations to provoke more accurate models for efficient AHTPs prediction.
Here, we developed mAHTPred, a new meta-predictor for the identification of AHTPs. Firstly, we applied a feature representation learning scheme to extract informative features (51 features based on probabilistic information) from diverse sequence-based descriptors, including amino acid composition (AAC), amino acid index (AAI), binary profile features (BPF), composition-transition-distribution (CTD), dipeptide composition (DPC), other features (OF), overlapping property features (OVP) and twenty-one-bit features (TOB). Secondly, we inputted 51 features separately into four different ML algorithms [extremely randomized tree (ERT), gradient boosting (GB), RF and SVM] and developed their corresponding optimal meta-predictor using a two-step feature selection protocol. Finally, we integrated these four ML-based meta-predictors into an ensemble model for the final prediction. Comparative results with the existing methods on benchmark and independent datasets showed that mAHTPred improvement is significant. To the best of our knowledge, our study is the first meta-based approach in the prediction of AHTPs. Henceforth, we highly anticipate that our work will instigate the development of novel computational approaches and also will facilitate experimentalists in the discovery of novel AHTPs.
2 Materials and methods
The mAHTPred methodology (Fig. 1) consists of five major steps: (i) construction of benchmarking and independent datasets; (ii) feature extraction that covers several aspects of sequence information; (iii) feature representation learning scheme; (iv) construction of a meta-predictor using two-step feature selection strategy [i.e. feature ranking and sequential forward search (SFS)]; and (v) construction of the final model for the classification. Each of these major steps has been detailed in the following sections.
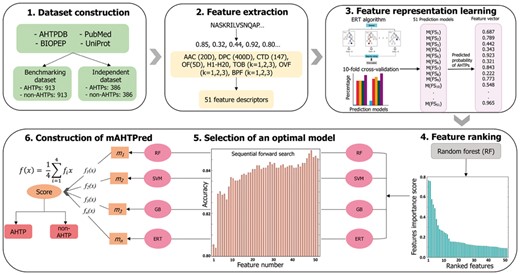
Overview of the proposed methodology for predicting AHTPs that involved the following steps: (i) construction of benchmarking and independent dataset; (ii) extraction of 8 different feature encodings that characterize those peptides in different ways and generation of 51 feature descriptors; (iii) generation of 51-dimensional feature vector using feature representation learning scheme; (iv) ranking the 51-dimensional feature vector using RF algorithm; (v) generation of the optimal meta-predictor model using sequential forward search; (vi) construction of the final prediction model by integrating four meta-predictors that separates the input into putative AHTPs and non-AHTPs
2.1 Construction of benchmarking and independent datasets
To develop a prediction model, we considered the same non-redundant dataset as originally proposed in (Kumar et al., 2015b) that consisted of peptides ranging from dipeptides to larger (>13 amino acid) peptides. In this study, we excluded peptides whose lengths were < 5 amino acid residues due to the difficulty in generating informative features for the shorter sequences. The remaining peptides were considered as the benchmarking dataset. Our final balanced benchmarking dataset constitutes an equal number of AHTPs (913) and non-AHTPs (913). In case of AHTPs, all the sequences are experimentally validated ones derived from the publicly available databases AHTPDB (Kumar et al., 2015a) and BIOPEP (Iwaniak et al., 2016; Minkiewicz et al., 2008). Due to the lack of experimentally validated non-AHTPs, random peptides generated from Swiss-Prot proteins were considered as negative ones. This approach of considering random sequences as negative dataset has been routinely used in peptide-based prediction methods due to the chances of finding random sequences as positive ones are very minimal (Agrawal et al., 2018; Chen et al., 2016; Manavalan et al., 2017, 2018d; Sharma et al., 2013; Usmani et al., 2018a; Wei et al., 2018c).
To evaluate the performance of our method with the existing tools, we constructed a non-redundant independent dataset. Firstly, we extracted experimentally validated AHTPs by manual curation from various literatures (Win et al., 2018; Yi et al., 2018) and databases, including, AHTPDB (Kumar et al., 2015a) and BIOPEP (Iwaniak et al., 2016; Minkiewicz et al., 2008). Furthermore, random peptides generated from the Swiss-Prot were considered as negative samples. Here, the random peptides similar to AHTPs were removed and considered the remaining ones as non-AHTPs. Subsequently, we applied CD-HIT to remove the sequences which shares a sequence identity of >90% in the independent dataset against the sequences in the benchmarking dataset. Finally, we obtained 386 AHTPs and 386 non-AHTPs.
2.2 Feature representation
Amino acid composition (AAC)
Dipeptide composition (DPC)
Composition-transition-distribution (CTD)
CTD is employed to delineate the global composition of amino acid property (Dubchak et al., 1995) for a given protein or peptide sequence. Standard amino acids are divided into three different clusters, such as hydrophobic, neutral and polar. Composition (C) computes the percentage composition values of the above three different clusters from a given peptide sequence. Transition (T) computes percentage frequency of a specific property of an amino acid progressed by another property. Distribution (D) constitutes five values for each of the three groups and determines the percentage of a target sequence length within which 25, 50, 75 and 100% of the amino acids of a specific property are situated. A more detailed explanation for this calculation can be found in these studies (Li et al., 2006; Zhang et al., 2017). CTD engenders twenty-one features for each physicochemical property. Furthermore, seven different physicochemical properties (charge, hydrophobicity, normalized van der Waals volume, polarity, polarizability, secondary structure and solvent accessibility) yield a sum of 147 features.
Amino acid index (AAI)
The AAIndex database contains various biochemical and physicochemical properties of amino acids (Kawashima et al., 2007). Recently, Saha et al. (2012) identified eight high quality AAIs by clustering 566 AAIs present in the AAIndex database, whose accession codes in the AAIndex database are BIOV880101, BLAM930101, CEDJ970104, LIFS790101, MAXF760101, NA KH920108, TSAJ990101 and MIYS990104 (Liu et al., 2015). These high-quality indices are encoded as 160(=20 8)-dimensional vectors from the target peptide sequence. However, the average of these eight high-quality AAIs for each amino acid (a 20-dimensional vector) was used as an input feature to minimize the computational time.
Other features (OF)
In addition to the above composition, other features are: (i) absolute charge per residue (); (ii) aliphatic index (i.e. [A + 2.9V + 3.9I + 3.9L]/n); (iii) a fraction of turn-forming residues (i.e. [N + G+P + S]/n); (iv) molecular weight; and (v) sequence length.
Hybrid features
Generally, hybrid features tend to perform better than individual composition because it contains multiple information from the sequence (Manavalan et al., 2018a, c, d). Hence, we generated hybrid features using a linear combination of five compositions (AAC, DPC, CTD, AAI and OF). Supplementary Table S1 shows the 20 hybrid features employed in this study with various possible combinations covering different perspectives of sequential information.
Binary profile (BPF)
BPF(k) dimension is 20 k, where k values are assigned as 3, 4 and 5 at N- and C-terminus, which resulted as follows: BPFN3, BPFN4, BPFN5, BPFC3, BPFC4 and BPFC5. In addition to this, we also generated BPFN3-BPFC3 (BPFNC3), BPFN4-BPFC4 (BPFNC4) and BPFN5-BPFC5 (BPFNC5).
Overlapping property (OVP) features
OVP(k) dimension is 10 k, where k values are assigned as 3, 4 and 5 at N- and C -terminus, which resulted as follows: OVPN3, OVPN4, OVPN5, OVPC3, OVPC4 and OVPC5. In addition to this, we also generated OVPN3-OVPC3 (OVPNC3), OVPN4-OVPC4 (OVPNC4) and OVPN5-OVPC5 (OVPNC5).
Twenty-one-bit (TOB) features
TOB features considers seven physicochemical properties, including charge, hydrophobicity, normalized Van der Waals volume, polarizability, polarity, secondary structure and solvent accessibility (Dou et al., 2014). Supplementary Table S3 shows the classification of amino acid residue into seven physicochemical properties, where any two groups are not overlapped. Similar to OVP deciphering, each residue of the peptide P is deciphered as a 21-bit vector composed of 0/1, where the position of each bit position is set to 1 if the amino acid fits in the corresponding group, else 0 (Wei et al., 2018b, c). TOB dimensionality is 21 k, where k values are assigned as 3, 4 and 5 at N- and C-terminus, which resulted as follows: TOBN3, TOBN4, TOBN5, TOBC3, TOBC4 and TOBC5. In addition to this, we also generated TOBN3-TOBC3 (TOBNC3), TOBN4-TOBC4 (TOBNC4) and TOBN5-TOBC5 (TOBNC5).
2.3 Feature representation learning scheme
Recently, Wei et al. reported a novel feature learning scheme that was successfully applied in various prediction problems, including anticancer peptide (Wei et al., 2018c), cell penetrating peptide (Qiang et al., 2018b) and Quorum sensing peptide predictions (Wei et al., 2018b). In this study, we followed a similar protocol and the steps are as follows:
Step 1. Construction of an initial feature Pool
As mentioned in the previous sections, we extracted eight feature encoding schemes were obtained based on composition, profiles and physicochemical properties, including AAC, AAI, BPF, CTD, DPC, OF, OVP and TOB. Hybrid features contain 20 different feature set (Supplementary Table S1), based on a different combination of five feature encodings, including AAC, DPC, CTD, AAI and OF. In case of BPF, OVP and TOB, the value of k was set in the range of 3–5. Since the minimal sequence length of the peptide in our dataset is five residues, we cannot use the value of k > 5. Furthermore, we considered N-terminal residues, C-terminal residues and a combination of N- and C-terminal residues, which led to 27 (=9 feature set 3 encodings) feature set. In total, we generated 51 feature set (FS) based on the eight feature encodings that are listed in Supplementary Table S4. For clarity, the jth feature set is represented as FSj(j = 1, 2, 3,…, 51).
Step 2. Construction of feature learning model
For each FSj(j = 1, 2, 3,…, 51), we developed their corresponding ERT-based prediction model, represented as M(FSj), using benchmarking dataset and 10-fold cross-validation (CV). Acknowledging that running 10-fold CV with random partitioning of benchmarking dataset might yield biased ML parameters, hence, we re-run 10-fold CV for additional five times and considered median ML parameters as the optimal value. Finally, we obtained 51 prediction models and considered them as the baseline model.
Step 3. Learning a new feature vector to construct a Meta predictor
2.4 Construction of meta-predictor
All the features generated in step 3 of feature representation learning scheme (Eq. 6) were subsequently provided as an input discretely to four different ML algorithms (ERT, GB, RF and SVM) and their corresponding optimal meta-predictor was established using a two-step feature selection strategy. Detailed description of feature selection strategy is mentioned below:
Feature selection
In general, biological datasets are represented as higher dimensional features, which led to decrease the algorithm speed and poor prediction performance (Liu et al., 2017). However, feature selection procedure plays an important role to overcome the above limitations, which is regarded as a potent step in ML-based model development. To enhance the feature representation capability and determine the subset of optimal features from the original 51 features (Eq. 6) which contribute to the appropriate classification of AHTPs or non-AHTPs, a new two-step feature selection strategy was utilized. Remarkably, the two-step feature selection protocol utilized here is similar to the one employed in our recent research (Manavalan and Lee, 2017, 2018b, c, d). In our previous protocol, features were ranked according to the variable or feature importance scores (FISs) using the RF algorithm in the first step, and feature subsets were selected manually in the second step based on the FISs. It is of noteworthy that the first step is same with our previous protocol. But, a SFS was utilized in the second step to select the optimal feature subset (Basith et al., 2018), rather than employing manual feature subset selection.
In the next step, SFS was utilized to identify and select the optimal features from a ranked feature set based on the following steps: (i) The first feature subset contained only the first feature in the ranked set D. The second feature subset contained the first and the second feature in D, and so on. Lastly, we obtained N feature subsets; (ii) All the N feature subsets were inputted to four different ML algorithms (ERT, GB, RF and SVM) for the development of their corresponding prediction model using a 10-fold CV test (Supplementary Material). Certainly, the best performance in terms of accuracy produced by the feature subset was regarded as the optimal feature set.
2.5 Implemented machine learning algorithms for model development
mAHTPred utilizes four different ML algorithms such as ERT, GB, RF and SVM, which were implemented using the Scikit-Learn package (v0.18) (Abraham et al., 2014). Details and utility of these methods in this study along with the evaluation metrics are provided in the Supplementary Material.
3 Results and discussions
3.1 Impact of various classifiers on feature learning models
In this study, we generated 51 feature descriptors as described in Section 2.3 using eight different feature encodings and varied the parameters for only three feature encodings (Supplementary Table S4). Using these feature descriptors, we examined the predictive performance of six commonly-used ML algorithms or classifiers, namely AB, ERT, GB, k-NN, RF and SVM, by performing 10-fold CV. In total, we obtained 306 prediction models with six ML algorithms using 51 feature descriptors, whose performances are summarized in Supplementary Tables S5–S10. Apart from ERT and GB, the remaining four ML algorithms achieved their best performances using different feature descriptors, we observed that RF, ERT, GB, AB and k-NN achieved their corresponding maximum accuracies of 82.0, 82.3, 80.9, 76.8 and 75.7% using CTD, H11 (a linear combination of AAC, AAI, and DPC), H8 (AAI and DPC), H11, H15 (DPC, CTD, and OF) and H6 (AAC and AAI) feature descriptors, respectively. These results show that the performance of existing feature descriptors is greatly influenced by the utilized classifiers. Surprisingly, the top 10 models (Supplementary Tables S5–S10) for each classifier showed similar performances, and none of the feature descriptors provided a significant performance improvement as we expected. Furthermore, comparisons of the best feature descriptors among six predictors showed that H11 and ERT classifier was somewhat better than RF and GB, and remarkably better than AB and k-NN in terms of accuracy (0.3–6.6%) and MCC (0.3–14%). Based on our analysis, we conclude that the predictive model trained with ERT classifier and H11 descriptor has relatively high discriminative power to classify AHTPs from non-AHTPs.
Additionally, the effectiveness of the classifiers in predicting AHTPs were explored. Figure 2 shows the performance of six classifiers with respect to 51 feature descriptors. For each classifier, the performances in terms of accuracy was fluctuating and we did not observe any stable performance between feature descriptors. Among various descriptors, TOB feature encoding with varying parameters performed poorer than other descriptors regardless of the ML algorithm, indicating that it has a less discriminative power. Overall, we observed that the accuracy of the feature descriptors using the ERT classifier is generally higher than other classifiers, thus demonstrating its superiority. Therefore, we selected these models for learning feature representation. In case of other classifiers, RF, GB and SVM seem to be competitive with each other, while AB and k-NN showed worst performances among the compared classifiers.
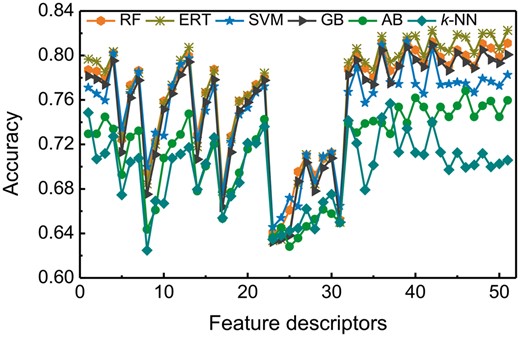
Performance of various classifiers in distinguishing between AHTPs and non-AHTPs with respect to 51 feature descriptors
3.2 Construction of meta-predictors using two-step feature selection strategy
Since AB and k-NN showed worst performances among the six classifiers in AHTPs prediction, we excluded these methods from further analysis and included only the remaining four methods, namely SVM, ERT, RF and GB for the construction of meta-predictor. In general, meta-predictor consider output from a variety of individual algorithms under the assumption that combined methods provide more accurate predictions than the single method. Here, ERT-based predicted AHTP probability values derived from 51 learnt features were provided as inputs to four ML algorithms and their corresponding optimal meta-predictor models were developed using a two-step feature selection protocol. Primarily, we sorted 51 learnt features and ranked them in accordance with FIS produced by RF algorithm (Fig. 3A and Supplementary Table S11). As shown, it is evident that 28th [H10 (AAI and CTD)] and 47th [H14 (AAI, DPC and CTD)] features which have a FIS of approximately 0.76 appeared to be essential and thus proved most potent for classification. Subsequently, we added the features in succession from the ranked features to the previous ones and their respective prediction models were built. Figure 3B shows the performance in terms of accuracy corresponding to feature number using SFS, where performance of each method steadily increased in parallel with feature number until 15 and it remained stable thereafter. A model with the highest accuracy was selected as the best optimal model, whose corresponding features were regarded as the optimal feature set. Unlike the performances in feature learning, the selected best model of SVM, RF, ERT and GB produced a similar performance of approximately 85.0% with a larger feature number of 48, 39, 47 and 45, respectively. Although we expected a significant improvement from the two-step feature selection strategy as reported in previous studies (An et al., 2016; Dao et al., 2018; Lai et al., 2017; Qiang et al., 2018a, b; Song et al., 2018; Zhang et al., 2018), the improvement of the optimal four models on an average was very marginal (∼0.5%) when compared to the control (using all the features) (Fig. 3C). This might be due in part to the optimal feature size (on an average ∼45 features), which is almost similar to the control (51 features).
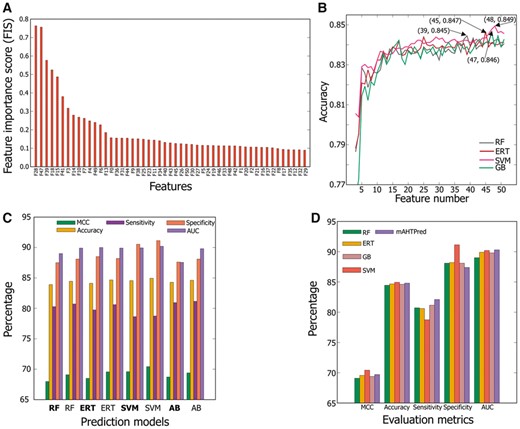
Feature selection and the final model construction. (A) Ranking of 51-dimensional vector according to the feature importance score. (B) SFS curve for discriminating AHTPs and non-AHTPs. The maximum accuracy (i.e. SFS peak) obtained in 10-fold CV for the four different methods, namely ERT, GB, RF and SVM is shown in arrow. (C) Comparison of the optimal model (normal font) with respect to the control (bold) (i.e. using all the features). (D) Comparison of mAHTPred with the individual ML-based prediction model
3.3 Construction of mAHTPred
Although, we observed that mAHTPred performance in terms of MCC and accuracy is similar with other methods, but it achieved more balanced prediction results (Fig. 3D). Notably, the four meta-predictor models achieved a very high specificity and comparatively lower sensitivity with an average difference of ∼9% (i.e. Specificity-Sensitivity), however, mAHTPred achieved 4% lesser than the above methods.
To show the advantage of meta-predictor, we compared the performance of mAHTPred with the best models from each of the six different ML algorithms obtained from feature learning (Supplementary Tables S5–S10). Figure 4 shows that MCC and accuracy of mAHTPred were respectively 5.0–18.0% and 2.5–9.0% higher than the single models. Furthermore, we compared the AUC between mAHTPred and other methods and computed P-value using two-tailed t-test (Hanley and McNeil, 1982). Using a P-value threshold of 0.05, mAHTPred significantly outperformed all single models. While this approach has been quite commonly applied for protein structure (Bujnicki et al., 2001) and peptide function predictions (Wei et al., 2018b, c), however, it is of noteworthy that this is the first illustration where meta-predictor method has been employed for AHTPs prediction.
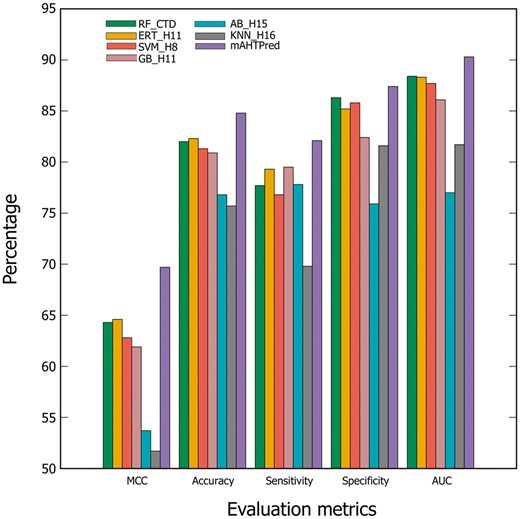
Performance of mAHTPred and the base-line models. The Performance comparison between mAHTPred and the base-line models in terms of MCC, accuracy, sensitivity, specificity and AUC
3.4 Feature selection analysis
To understand the effectiveness of our features, we computed T-distributed Stochastic Neighbor Embedding (t-SNE) for positive and negative samples of the 51-dimensional vector and compared with the top five individual feature descriptors which have been ranked by RF algorithm. Figure 5A–E shows that positive and negative samples of five feature descriptors are distributed differentially in the feature space (A–E). Conversely, we observed a clear distinction between positive and negative samples for 51-dimensional vector, although few samples appear overlaid (Fig. 5F). These results demonstrate that AHTPs and non-AHTPs present in 51-dimensional vector could be easily differentiated when compared to the other feature space, thus enhancing the performance. Our feature selection protocol could be proven effective due to the following reasons: (i) no tuning of the parameters is necessary for datasets as commonly done by most of the existing descriptors; (ii) it can be easily scalable for both peptide and protein feature representations; and (iii) easy transformation from high-dimensional feature space into low-dimensional one is possible, thus leading to the expedition of prediction process and extending its applicability to genome-wide predictions too.
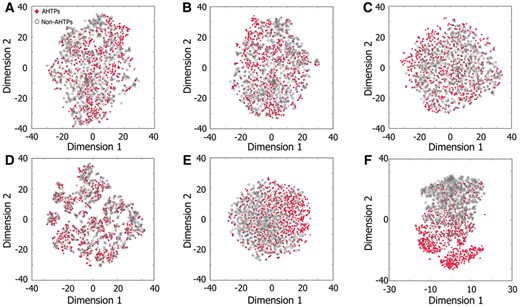
t-SNE distribution of AHTPs and non-AHTPs using 51-dimensional vector and the top five individual descriptors. (A–F) are the distribution of H10, H4, OVPN5, TOBNC4, BPFNC4 and 51-dimensional vectors, respectively
3.5 Performance evaluation of mAHTPred with other predictors on benchmarking dataset
To evaluate the performance of mAHTPred, our computational protocol was compared with two exiting methods available in the literature, namely AHTpin and PAAP. It is to be noted that AHTpin has two prediction models (the first one is based on AAC and the second one is based on atomic composition) and we used both in our analysis. The rationale for considering these two methods in our analysis are as follows: (i) the authors trained and validated their prediction models using the same benchmarking dataset as presented in this study and (ii) these methods have been reported to demonstrate excellent performance in AHTPs identification. As shown in Table 1, we observed that among the compared predictors, mAHTPred demonstrated the best performance in terms of MCC, accuracy, sensitivity and specificity of 0.697, 84.8, 82.1 and 87.4%, respectively. Indeed, MCC and accuracy of mAHTPred were respectively 11.2–13 and 5.7–6.3% higher than existing methods, thus demonstrating the superiority of our proposed protocol. Furthermore, to evaluate the generalization, robustness and practical applicability of our method, we evaluated the performances of all these methods on independent dataset.
Performance comparison of between our proposed method and the state-of-the-art methods for predicting AHTPs based on the benchmarking dataset
| Methods | MCC | Acc | Sn | Sp | AUC |
|---|---|---|---|---|---|
| mAHTPred | 0.697 | 0.848 | 0.821 | 0.874 | 0.903 |
| PAAP | 0.585 | 0.791 | 0.865 | 0.780 | NA |
| AHTpin_AAC | 0.567 | 0.785 | 0.777 | 0.793 | NA |
| AHTpin_ATC | 0.573 | 0.785 | 0.783 | 0.787 | NA |
| Methods | MCC | Acc | Sn | Sp | AUC |
|---|---|---|---|---|---|
| mAHTPred | 0.697 | 0.848 | 0.821 | 0.874 | 0.903 |
| PAAP | 0.585 | 0.791 | 0.865 | 0.780 | NA |
| AHTpin_AAC | 0.567 | 0.785 | 0.777 | 0.793 | NA |
| AHTpin_ATC | 0.573 | 0.785 | 0.783 | 0.787 | NA |
Note: First column represents the method name employed in this study. The second, third, fourth, fifth and the sixth columns, respectively, represent the MCC, Acc: accuracy, Sn: sensitivity, Sp: specificity and AUC. NA: not available.
3.6 Performance evaluation of mAHTPred with other predictors on the independent dataset
To assess the robustness of mAHTPred, its performance using independent dataset was compared with AHTpin only because the other reported method’s PAAP webserver was not functional during our manuscript preparation. As shown in Table 2, mAHTPred showed the best performance in terms of MCC, accuracy, sensitivity, specificity and AUC of 0.767, 88.3, 89.4, 87.3 and 95.1%, respectively. Explicitly, MCC and accuracy of mAHTPred were approximately 6.3–8.3% and 12.6–16.6% higher than the existing method, thus demonstrating the superiority of our proposed predictor. Furthermore, we plotted ROC curve (Supplementary Fig. S1) which provide a comprehensive performance comparison between mAHTPred and other method. mAHTPred significantly outperformed the existing method using a P-value threshold of 0.01, thus demonstrating that our model was indeed a robust one in the accurate prediction of AHTPs.
The consistent performance of mAHTPred on both benchmarking and independent dataset suggest that our method could accurately identify AHTPs from unknown peptides. The rationale for an improved performance of mAHTPred over the existing method are as follows: (i) our feature learning model uses an enlarged set of informative sequence-based features, including residue composition, sequence local-order information, physicochemical properties and residue position specific information. (ii) Our model uses the probability of predicted AHTPs from the original feature descriptors, which significantly reduced the high-dimensional complex feature space into a low-dimensional and more informative one; and (iii) our final ensemble integrates four meta-predictors, which further led to a more stable performance.
Performance comparison of between our proposed method and the state-of-the-art methods for predicting AHTPs based on the independent dataset
| Methods | MCC | ACC | Sn | Sp | AUC | P-value (AUC) |
|---|---|---|---|---|---|---|
| mAHTPred | 0.767 | 0.883 | 0.894 | 0.873 | 0.951 | — |
| AHTpin_ATC | 0.641 | 0.820 | 0.798 | 0.842 | 0.888 | 0.000015 |
| AHTpin_AAC | 0.601 | 0.800 | 0.821 | 0.780 | 0.852 | <0.000001 |
| Methods | MCC | ACC | Sn | Sp | AUC | P-value (AUC) |
|---|---|---|---|---|---|---|
| mAHTPred | 0.767 | 0.883 | 0.894 | 0.873 | 0.951 | — |
| AHTpin_ATC | 0.641 | 0.820 | 0.798 | 0.842 | 0.888 | 0.000015 |
| AHTpin_AAC | 0.601 | 0.800 | 0.821 | 0.780 | 0.852 | <0.000001 |
Note: First column represents the method name employed in this study. The second, third, fourth, fifth and the sixth columns, respectively, represent the MCC, ACC: accuracy, Sn: sensitivity, SP: specificity and AUC. The last column represents the pairwise comparison of AUCs between mAHTPred and the other methods using a two-tailed t-test. P < 0.01 indicates a statistically meaning full difference between the mAHTPred and the existing method (shown in bold).
4 Conclusion
Hypertension is linked to several diseases including cancer, cardiovascular diseases, renal diseases and other complications. Naturally derived bioactive peptides with antihypertensive activities serve as promising alternatives to pharmaceutical drugs. Therefore, accurate identification of AHTPs from provided sequence information seems as one of the challenging tasks in bioinformatics. Although there have been few computational methods to predict AHTPs, a systematic comprehensive assessment of informative features, the effectiveness of ML algorithms, and their potential integration have been lacking. In this study, we conducted a comprehensive analysis of 51 feature descriptors using six different ML algorithms for the computational identification of AHTPs. In order to develop a high efficiency predictor, we implemented the following protocol: (i) we applied a feature representation learning and extracted more informative features using ERT algorithm; (ii) the predicted probability of AHTPs were utilized as an input to SVM, RF, ERT and GB classifiers, and their related optimal meta-predictors were built using a two-step feature selection strategy; and (iii) a combination of these four meta-predictors into ensemble strategies produced a more stable performance. Our analysis highlighted that mAHTPred showed consistently better performance on both benchmarking and independent datasets, indicating that the proposed method is more pragmatic and idealistic for the prediction of AHTPs. Additionally, we made our method available in the form of a free web server for the easy accessibility and utility to a wider research community. We expect that mAHTPred will be a powerful bioinformatics tool for identifying new potential AHTPs in an effective and economical manner. Moreover, our proposed computational framework will not only be applicable to AHTPs but could be further extended to other peptide sequence-based predictors (e.g. cell-penetrating peptides, antimicrobial peptides and antibacterial peptides), as well as other bioinformatics fields (Cui et al., 2018; McDermaid et al., 2018). Additionally, it can be expected that integrating other informative features, such as conserved motif features, might further improve the performance of sequence-based predictors (Ma et al., 2013; Yang et al., 2017).
Acknowledgements
The authors would like to thank Ms. Dae Yeon Lee and Ms. Saraswathi Nithyanantham for their support in dataset preparation.
Funding
This work was supported by the Basic Science Research Program through the National Research Foundation (NRF) of Korea funded by the Ministry of Education, Science, and Technology [2018R1D1A1B07049572 and 2018R1D1A1B07049494], ICT & Future Planning [2016M3C7A1904392], the National Natural Science Foundation of China (No. 61701340) and the Natural Science Foundation of Tianjin city (No. 18JCQNJC00500).
Conflict of Interest: none declared.
References
Author notes
The authors wish it to be known that, in their opinion, Balachandran Manavalan and Shaherin Basith authors should be regarded as Joint First Authors.

