


Abstract
DNA N6-methyladenine (6mA) is associated with a wide range of biological processes. Since the distribution of 6mA site in the genome is non-random, accurate identification of 6mA sites is crucial for understanding its biological functions. Although experimental methods have been proposed for this regard, they are still cost-ineffective for detecting 6mA site in genome-wide scope. Therefore, it is desirable to develop computational methods to facilitate the identification of 6mA site.
In this study, a computational method called i6mA-Pred was developed to identify 6mA sites in the rice genome, in which the optimal nucleotide chemical properties obtained by the using feature selection technique were used to encode the DNA sequences. It was observed that the i6mA-Pred yielded an accuracy of 83.13% in the jackknife test. Meanwhile, the performance of i6mA-Pred was also superior to other methods.
A user-friendly web-server, i6mA-Pred is freely accessible at http://lin-group.cn/server/i6mA-Pred.
1 Introduction
As a non-canonical DNA modification, DNA N6-methyladenine (6mA) has been identified in three kingdoms of life (O’Brown and Greer, 2016). Recent studies have demonstrated that 6mA modification is closely correlated with a series of biological processes, such as DNA replication (Campbell and Kleckner, 1990), transcription (Robbins-Manke et al., 2005) and repair (Pukkila et al., 1983). The non-uniform distribution of 6mA sites across the genome implies that, for better understanding its biological functions, it is indispensable to characterize its position in the genome.
In the past several years, several experimental methods have been proposed to detect 6mA site, such as methylated DNA immunoprecipitation sequencing (Pomraning et al., 2009), capillary electrophoresis and laser-induced fluorescence (Krais et al., 2010) and single-molecule real-time sequencing (SMRT-seq) (Flusberg et al., 2010). Recently, by performing mass spectrometry analysis and 6mA immunoprecipitation followed by sequencing, Zhou et al. (2018) obtained the 6mA profile of the rice genome.
Although experimental methods indeed yielded encouraging results, the drawbacks of experimental methods preclude the genome-wide identification of 6 mA. Fortunately, the experimental data give us an unprecedented opportunity to develop computational models for identifying the 6mA site. Therefore, in this study, we proposed a support vector machine (SVM)-based method to identify the 6mA sites in the rice genome, in which nucleotide chemical properties and nucleotide frequency were used to formulate the DNA sequences. In the jackknife cross-validation, the proposed model obtained an overall accuracy of 83.13% for identifying 6mA sites. Moreover, a freely accessible online web-server for i6mA-Pred was established.
2 Materials and methods
2.1 Construction of benchmark dataset
The positive samples (6mA site containing sequences) were obtained from NCBI Gene Expression Omnibus (https://www.ncbi.nlm.nih.gov/geo/) under the accession number GSE103145, which were yielded from the SMRT-seq (Zhou et al., 2018). All the sequences are 41 bp long with the 6mA site in the center. In order to construct a high-quality benchmark dataset, the following two procedures were performed. First, according to the Methylome Analysis Technical Note, a score of 30 is the default threshold for calling a nucleotide as modified. Hence, the sites with a modification score of <30 were filtered out. Second, a dataset containing many redundant samples with high similarity has the low statistical representativeness. A computational model, if trained and tested by such a biased benchmark dataset, might yield overestimated accuracy. To get rid of redundancy and minimize the bias, the CD-HIT software (Fu et al., 2012) with the cutoff threshold of 60% was used to remove those sequences with high sequence similarity. After following these two procedures, we obtained 880 positive samples. Preliminary tests indicated that the best predictive results were achieved when the sequence length is 41 bp.
The negative samples (non-6mA site containing sequences) were obtained according to the following rules. As indicated in a recent study (Zhou et al., 2018), the 6mA occurs most frequently at GAGG motifs, and are less enriched in coding sequences (CDSs). Thus, we fetched the negative samples from the CDSs. By searching the sub-sequences containing GAGG motifs in CDSs of the rice genome, we got 880 non-6mA site containing sequences with the sequence identity <60%. All these negative samples are also 41 bp long with the non-methylated adenosine at the center.
Finally, we obtained a benchmark dataset including 880 6mA site containing sequences and 880 non-6mA site containing sequences, which is available at http://lin-group.cn/server/i6mAPred/data.
2.2 Sequence representation
In order to transfer the DNA sequences into vectors that can be handled by machine-learning methods, the nucleotide chemical properties and nucleotide frequency were used to describe the DNA sequences, which has been widely used in DNA modification site recognitions (Chen et al., 2017). A brief description of this sequence-encoding method is introduced as follows.
2.2.1 Nucleotide chemical property
The four nucleic acids have different chemical properties. In terms of ring structures, A and G are purines containing two rings, whereas C and T are pyrimidines containing one ring. When forming secondary structures, C and G form strong hydrogen bonds, whereas A and T form weak hydrogen bonds. In terms of amino/keto bases, A and C belong to the amino group, whereas G and T to the keto group.
In order to employ these properties, three coordinates (x, y, z) were used to represent the chemical properties of the four nucleotides and the value of 0 or 1 was assigned to the coordinates. If x, y and z coordinates respectively stand for the ring structure, the hydrogen bond, and the amino/keto bases, the four nucleotides can be represented in the Cartesian coordinate system as shown in Figure 1 . Therefore, the coordinates for A, C, G and T are (1, 1, 1), (0, 0, 1), (1, 0, 0) and (0, 1, 0), respectively.
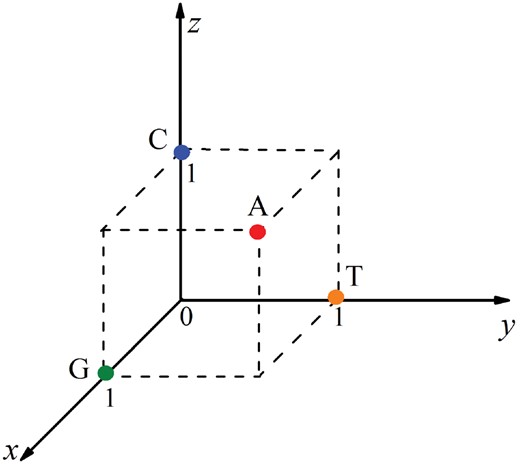
Representation of the four nucleotides in the Cartesian coordinate system. The x, y and z coordinates stand for the ring structure, the hydrogen bond and the amino/keto bases, respectively
2.2.2 Nucleotide frequency
By integrating nucleotide chemical properties and nucleotide frequency, each nucleotide will be converted into a 4D vector, where the first three elements represent its chemical properties and the fourth one is the accumulated frequency. Accordingly, an l-bp long sequence will be encoded by a (4 × l)-dimensional vector.
2.3 Support vector machine
SVM is a powerful and popular method for pattern recognition and has been widely used in computational genomics (Feng et al., 2013; Su et al., 2018; Zhang et al., 2018; Zhu et al., 2018). Its basic idea is to transform the input data into a high-dimensional feature space and then determine the optimal separating hyperplane. The implementation of SVM was carried out by using the LibSVM package 3.18, which is available at http://www.csie.ntu.edu.tw/∼cjlin/libsvm/. The radial basis kernel function was used to obtain the classification hyperplane. The probability score obtained from SVM was used to make predictions. If the probability is > 0.5, an adenine will be predicted as a 6mA site, otherwise, a non-6mA site.
2.4 Feature selection
If the sequences are represented by features including redundant or irrelevant information, it will lead to over-fitting problems and reducing the generalization capacity of the model. Fortunately, this problem can be avoided by means of the feature selection method. In order to alleviate irrelevant features, a series of effective feature selection techniques have been proposed, such as analysis of variance (Feng et al., 2018), binomial distribution (Su et al., 2018), minimal redundancy maximal relevance (Peng et al., 2005) and diffusion maps (Coifman et al., 2005).
In this study, the maximum relevance maximum distance (MRMD) method (Chen et al., 2018; Zou et al., 2016) was used to alleviate the irrelevant features. The main idea of MRMD is searching a kind of features ranking metric which contains two aspects: one is the relevance between sub-feature set and target class, and the other is redundancy of sub-feature set. More details about the algorithm of MRMD were introduced in the literature (Zou et al., 2016).
2.5 Performance evaluation
In statistical prediction, three cross-validation methods, namely independent dataset test, sub-sampling (or n-fold cross-validation) test and jackknife test, are often used to evaluate the anticipated success rate of a predictor (He et al., 2018; Manavalan and Lee, 2017; Manavalan et al., 2018). Among the three cross-validation methods, the jackknife test is deemed the least arbitrary one (Chou, 2011). Accordingly, the jackknife test was used to examine the performance of the model proposed in this study. In the jackknife test, each sample in the training dataset is in turn singled out as an independent test sample and all the properties are calculated without including the one being identified.
The receiver operating characteristic (ROC) curve was also used to evaluate the performance of this method. The area under the ROC curve (auROC) is a key indicator of the performance quality of a binary classifier, i.e. the value 0.5 of auROC is equivalent to random prediction while 1 of auROC represents a perfect one (Hanley and McNeil, 1982).
3 Results and discussion
3.1 Nucleotide composition analysis
In order to investigate the nucleotide composition difference between 6mA site containing sequences and non-6mA site containing sequences, the Two Sample Logos (Crooks et al., 2004) was used to determine the statistically significant nucleotide differences between the 6mA site and non-6mA site containing sequences. As shown in Figure 2 , the adenosine and thymine were significantly enriched in the 6mA site containing sequences (P < 0.05), whereas the non-6mA site containing sequences demonstrate a significant preference to cytosine and guanine (P < 0.05). This result suggests that it is reasonable to develop a computational method for identifying 6 mA site by using sequence information.
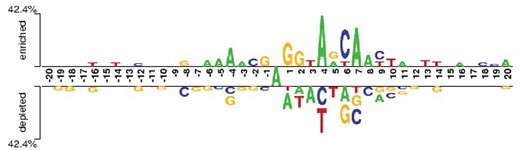
The nucleotide composition preferences of 6mA site and non-6mA site containing sequences. The top panel is the compositional preferences of 6mA site containing sequences, while the down panel is the compositional preferences of non-6mA site containing sequences
3.2 Identification of 6mA sites
According to the scheme described in Section 2.2, each of the samples in the benchmark dataset was converted to a 164D vector and used as the input of SVM to build a computational model. By examining the performance of the model via the 10-fold cross-validation test, we obtained an accuracy of 83.35%. Although the performance is satisfying, the original feature set unavoidably includes redundant features. Hence, it is necessary to choose the optimal number of features to build a robust and efficient predictive model.
Therefore, we used the MRMD together with the incremental feature selection (IFS) strategy to select the optimal feature set. For this end, the 164 kinds of features were firstly ranked by using the MRMD algorithm. The ranked features were then added one by one according to their scores yielded by MRMD. The feature subset started from the feature with the highest score. Then, a new feature subset was produced when the second feature with the second highest score was added. This procedure was repeated 164 times, and for each time a SVM model with default parameters (i.e. regularization parameter C and kernel parameter γ of SVM) was built. Their performances were investigated by using the 10-fold cross-validation test. The most optimal features can be obtained when the accuracy reaches its maximum. The IFS was used to determine the optimal number of features. The corresponding IFS curve was plotted in Figure 3 . As shown in Figure 3, when the top ranked 126 features were used to encode the samples, the accuracy reaches its maximum of 83.52%. Therefore, the 126 optimal features were used to build the computational model.
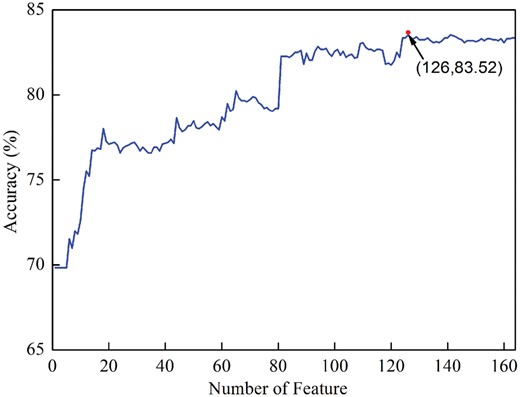
The IFS curve for identifying 6mA sites. An IFS peak of 83.52% was obtained when using the optimal 126 optimal features
To demonstrate the superiority of using SVM for identifying 6mA site, we compared its performance with that of other classifiers, such as Native Bayes, BaysesNet, Random Forest, LogitBoost and J48, which were implemented in WEKA (Meyer et al., 2012) with their default parameters. All these classifiers were based on the 126 optimal features. Their 10-fold cross-validation test results for identifying 6mA sites in the benchmark dataset were reported in Table 1. It was found that the performances of SVM are superior to those of other classifiers, respectively. Therefore, the SVM was used to build computational models in the followings.
Comparison of different classifiers for identifying 6mA sites
| Classifier | Sn (%) | Sp (%) | Acc (%) | MCC | auROC |
|---|---|---|---|---|---|
| Native Bayes | 84.66 | 77.84 | 81.25 | 0.63 | 0.868 |
| BaysesNet | 79.43 | 80.23 | 79.83 | 0.60 | 0.853 |
| Random Forest | 82.95 | 81.36 | 82.16 | 0.64 | 0.875 |
| LogitBoost | 81.02 | 78.75 | 79.89 | 0.60 | 0.861 |
| J48 | 77.73 | 75.23 | 76.48 | 0.53 | 0.742 |
| SVM | 83.41 | 83.64 | 83.52 | 0.67 | 0.909 |
By using the grid search approach, the two parameters C and γ of SVM were optimized in the spaces [2−5, 215] and [2−15, 2−5] with the step of 2 and 2−1, respectively. It was found that the optimal values for C and γ were 32 and 0.00048828125, respectively. Accordingly, a computational model called i6mA-Pred, was built to identify 6mA site in the rice genome. Subsequently, the rigorous jackknife test was used to evaluate the performance of i6mA-Pred. The i6mA-Pred obtained an accuracy of 83.13% for identifying 6mA site in the benchmark dataset. To further demonstrate its performance, the ROC curve of the proposed method was plotted in Figure 4 .
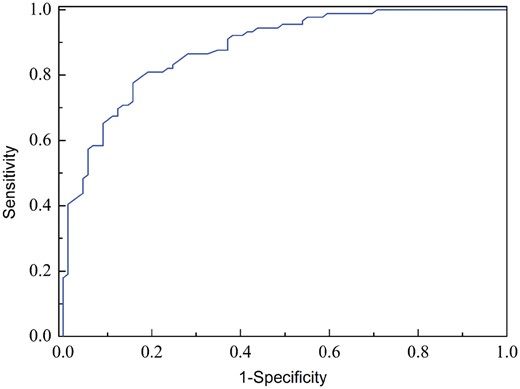
A graphical illustration to show the performance of the model by means of the ROC curves obtained from the jackknife test
3.3 Comparison with other sequence-encoding schemes
To the best of our knowledge, the computational method for identifying 6mA sites in the rice genome has not been reported so far. Hence, we could not provide a direct comparison between the i6mA-Pred and other existing methods. To demonstrate the effectiveness of the nucleotide chemical property based method for 6mA site identification, we compared it with the PseDNC-based method that has been used for identifying DNA 5mC modifications (Feng et al., 2016).
The basic idea of PseDNC is to convert genomic sequences into dimension-fixed digital vectors covering both local and global sequence pattern information. For a brief formulation of PseDNC and how it works, see the recent articles (Chen et al., 2014, 2015).
In this study, the PseKNC-General package (Chen et al., 2015) was employed to calculate the PseDNC and six DNA physical–chemical properties (i.e. shift, slide, rise, twist, tilt and roll) that have been successfully used in computational genomics were incorporated. The two parameters of PseDNC, namely the number of the total pseudo components (λ) and the weight factor (w), were determined by an optimization procedure in the 10-fold cross-validation test. It was found that the optimal values for λ and w are 9 and 0.5, respectively. The jackknife test result of the PseDNC-based method in identifying 6mA site by using the same benchmark dataset were reported in Table 2. The accuracy of the PseDNC-based method is only 64.55%, which is ∼19% lower than that of i6mA-Pred. This comparison demonstrates the superiority of the i6mA-Pred and the effectiveness of nucleotide chemical properties and nucleotide composition for 6mA site identification.
Comparison of different methods for identifying 6mA sites in rice
| Method | Sn (%) | Sp (%) | Acc (%) | MCC | auROC |
|---|---|---|---|---|---|
| 6mA-Pred | 82.95 | 83.30 | 83.13 | 0.66 | 0.886 |
| PseDNC | 63.52 | 65.57 | 64.55 | 0.29 | 0.636 |
| Method | Sn (%) | Sp (%) | Acc (%) | MCC | auROC |
|---|---|---|---|---|---|
| 6mA-Pred | 82.95 | 83.30 | 83.13 | 0.66 | 0.886 |
| PseDNC | 63.52 | 65.57 | 64.55 | 0.29 | 0.636 |
3.4 Web-server
Since user-friendly web-servers represent the future direction for developing useful predictors, the public accessible web-server for i6mA-Pred were established. Moreover, to maximize user’s convenience, a step-by-step guide is given below.
Step 1. Open the web-server at http://lin-group.cn/server/i6mA-Pred and the top-page of i6mA-Pred will be shown as in Figure 5.
Step 2. Either type or copy/paste the query DNA sequences into the input box at the center of Figure 5 in FASTA format.
Step 3. Click on the Submit button to see the predicted result.
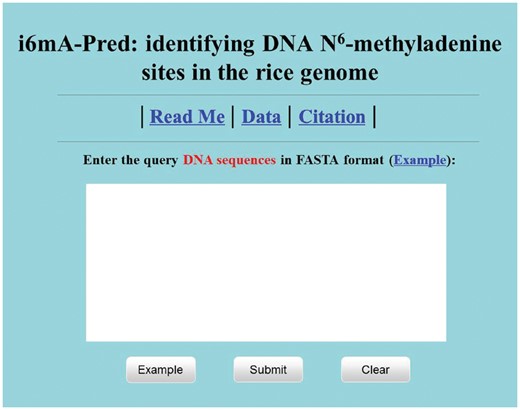
A semi-screenshot for the top-page of the i6mA-Pred web-server
4 Conclusions
Although N6-methyladenine (6mA) is closely associated with a series of biological processes, its biological functions are still unclear. Therefore, the identification of 6mA may facilitate our knowledge on its regulatory roles. In this work, by analyzing the SMRT-seq data, a benchmark dataset of 6mA was constructed. By encoding the samples in benchmark dataset using nucleotide chemical properties and nucleotide frequency, we developed a computational model called i6mA-Pred for identifying 6mA sites in the rice genome.
Results of a series of comparisons demonstrated that i6mA-Pred superior to other methods, which demonstrates the effectiveness of sequence-encoding method and feature selection scheme. In conclusion, it is anticipated that i6mA-Pred will become a useful computational tool for identifying 6mA sites in the rice genome.
It has not escaped our notice that the deep learning method has exhibit its merits in the realm of bioinformatics (Cao et al., 2016, 2017; Long et al., 2017; Patel et al., 2017; Peng et al., 2018; Stephenson et al., 2018). Therefore, we will also employ the deep learning method to improve the performance for identifying the 6mA site in the future work.
Funding
This work was supported by the National Nature Scientific Foundation of China [31771471 and 61772119], Natural Science Foundation for Distinguished Young Scholar of Hebei Province [No. C2017209244].
Conflict of Interest: none declared.
References

