


Abstract
In recent years, single-cell RNA sequencing enables us to discover cell types or even subtypes. Its increasing availability provides opportunities to identify cell populations from single-cell RNA-seq data. Computational methods have been employed to reveal the gene expression variations among multiple cell populations. Unfortunately, the existing ones can suffer from realistic restrictions such as experimental noises, numerical instability, high dimensionality and computational scalability.
We propose an evolutionary multiobjective ensemble pruning algorithm (EMEP) that addresses those realistic restrictions. Our EMEP algorithm first applies the unsupervised dimensionality reduction to project data from the original high dimensions to low-dimensional subspaces; basic clustering algorithms are applied in those new subspaces to generate different clustering results to form cluster ensembles. However, most of those cluster ensembles are unnecessarily bulky with the expense of extra time costs and memory consumption. To overcome that problem, EMEP is designed to dynamically select the suitable clustering results from the ensembles. Moreover, to guide the multiobjective ensemble evolution, three cluster validity indices including the overall cluster deviation, the within-cluster compactness and the number of basic partition clusters are formulated as the objective functions to unleash its cell type discovery performance using evolutionary multiobjective optimization. We applied EMEP to 55 simulated datasets and seven real single-cell RNA-seq datasets, including six single-cell RNA-seq dataset and one large-scale dataset with 3005 cells and 4412 genes. Two case studies are also conducted to reveal mechanistic insights into the biological relevance of EMEP. We found that EMEP can achieve superior performance over the other clustering algorithms, demonstrating that EMEP can identify cell populations clearly.
EMEP is written in Matlab and available at https://github.com/lixt314/EMEP
Supplementary data are available at Bioinformatics online.
1 Introduction
Single-cell RNA-seq techniques have been proved to be effective for discovering new cell types by detecting subpopulations in a heterogeneous cell population based on transcriptomic profiles. In fact, the identification of cell types from single-cell RNA-seq data is considered as a clustering problem in unsupervised learning. Therefore, computational methods including k-means, principal component analysis and spectral clustering (SC) are frequently adopted for identifying cell types. The rapid development in RNA-seq enables us to sequence massive amounts of single-cell RNA-sequencing data, which pose computational challenges; for instance, transcript amplification noise, dropout events, high-dimensionality and data sparsity (Kiselev et al., 2017; Wang et al., 2017). Those computational challenges brought difficulties in developing effective unsupervised clustering on single-cell RNA-seq data for cell population interpretations.
In the past, application-specific unsupervised clustering methods have been developed to address those computational challenges; for instance, Kiselev et al. (2017) proposed an unsupervised clustering called single-cell consensus clustering (SC3), which integrates multiple cluster labels by a consensus approach and can improve cell type identification from the transcriptomes of neoplastic cells. Wang et al. (2017) proposed single-cell interpretation via multikernel learning (SIMLR) by learning similarity measures from single-cell RNA-seq data. Zhu et al. (2017) applied the classic non-negative matrix factorization (NMF), which is compared with other unsupervised clustering methods; the results demonstrate that the non-NMF can identify interaction modules. Zhang et al. (2018a) utilized multiple single-cell populations from biological replicates (scVDMC) for single-cell RNA-seq interpretation. The scVDMC algorithm is a multitask learning method with embedded feature selection to capture the differentially expressed genes simultaneously. Zhang et al. (2018b) proposed an interpretable framework named DendroSplit based on feature selection to uncover multiple levels of single-cell RNA-seq clustering problems. Park et al. (2018) proposed a novel SC framework using multiple doubly stochastic similarity matrices to form a similar matrix for clustering cell types. Yang et al. (2017) presented Single-cell Analysis via Iterative Clustering to find the optimal set of signature genes for separating cells into distinct groups based on iterative clustering with the best parameters. However, it is hardly believed that each of those unsupervised clustering methods can be the all-time winner across all datasets for single-cell RNA-seq interpretations. In fact, each clustering algorithm has its own strengths and weaknesses; different clustering algorithms provide different performance on different single-cell RNA-seq datasets. Therefore, it is difficult for users to decide which clustering algorithm is the most appropriate choice for single-cell RNA-seq data.
Cluster ensembles have emerged as an effective method that can integrate solutions from multiple individual unsupervised clustering algorithms into consensus results. Cluster ensembles have been proved effective in solving real-world problems: ensemble clustering for medical diagnostics (Greene et al., 2004), fuzzy ensemble clustering (Avogadri and Valentini, 2009), link-based cluster ensemble (LCE) method (Iam-On et al., 2010a,b), graph-based consensus clustering (Yu et al., 2007) for DNA microarray data, ensemble framework for clustering protein–protein interaction networks (Asur et al., 2007), ensemble non-NMF methods (Greene et al., 2008) and knowledge-based cluster ensemble for cancer discovery on biomolecular data (Yu et al., 2011). A detailed list of cluster ensembles could be referred to the past survey (Yang et al., 2010). Unfortunately, most of those existing cluster ensembles methods can produce unnecessarily large ensembles at the expense of extra time costs and memory consumption. To address those limitations, ensemble pruning is proposed to select suitable clusters from the ensemble. In fact, the goal of ensemble pruning is to reduce the number of clusters without any sacrifice on accuracy. Intuitively, the objectives of ensemble pruning involve both maximizing the generalization performance and minimizing the number of clusters for regularization. Unfortunately, those two objectives are usually conflicting; the optimal decision needs to be enabled as the tradeoff between those two objectives. In this case, it would be ideal to regard ensemble pruning as a multiobjective problem rather than a single-objective problem. Therefore, an evolutionary multiobjective ensemble pruning (EMEP) is proposed to dynamically select the basic clustering algorithms as an ensemble; it can be considered as a special case of weight ensemble clusters with binary weights. Extensive comparisons with other methods on 55 simulated datasets, 7 real single-cell RNA-seq datasets and 2 case studies demonstrate that EMEP shows its competitive edges over several state-of-the-art clustering methods.
2 Materials and methods
2.1 Methodology overview of EMEP
In this section, we propose the EMEP algorithm for single-cell RNA-seq data. The framework of EMEP is summarized in Figure 1. Considering an n× m matrix X of single-cell RNA-seq data with n cells and m genes, our proposed algorithm EMEP includes three important components (Fig. 1). In the first component, NMF can be adopted for dimensionality reduction of the gene space (i.e. the single-cell RNA-seq data matrix X). Algebraically, NMF can decompose X into the product of the non-negative n× r basis matrix W and the non-negative r× m coefficient matrix H. With different numbers of rank models r in Figure 1, we generate various basis vectors for clustering, where d is the number of various basis vectors. In this work, we set the number of rank models from 2 to 20. It is noted that any basic clustering algorithm can be chosen for clustering various basis vectors in the set and obtain multiple cluster results. For example, we can select the K-means (KM) clustering algorithm in this step because of its simplicity and efficient performance.
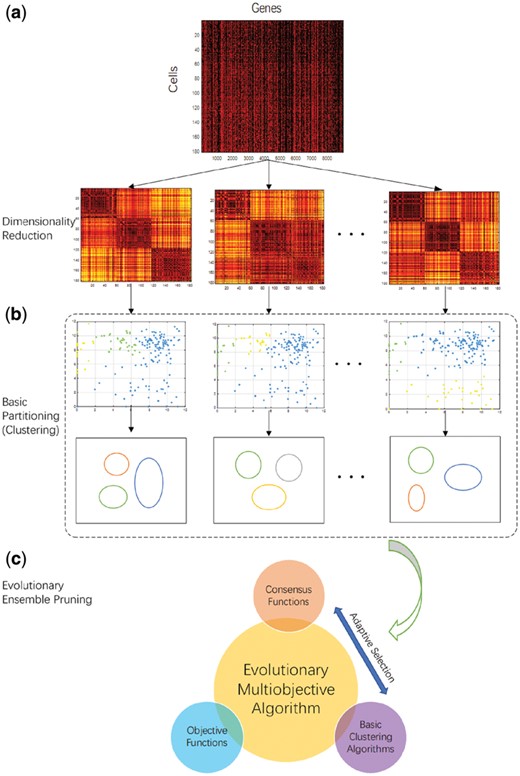
The overall framework of the EMEP pipeline. (a) The first part is dimensionality reduction; NMF can be adopted for dimensionality reduction of gene space from the single-cell RNA-seq data matrix X. It is noted that, for various rank models, the algorithm generates various basis vectors ; (b) The second part is the basic partitioning; for instance, the KM clustering algorithm can be chosen as the basic partitioning algorithm. For different basis vectors in the set , the KM clustering algorithm can obtain multiple cluster solutions ; (c) The third part is EMEP. It removes the unsuitable cluster results from the ensemble. Adaptive selection between different consensus functions and clustering algorithms is executed to produce the cluster solution ensemble iteratively
Then, EMEP removes some of the multiple cluster results and further improves the generalization performance for clustering. Given a clustering algorithm and the set of basis vectors maps each basis vector W to the label space and Cs denotes the pruned ensemble with the selected vectors where si = 1 means that the clustering result on Wi is chosen. To guide the multiobjective ensemble pruning, three cluster validity indices (i.e. the overall cluster deviation, the within-cluster compactness and the number of basic ensemble partitions), are chosen as the objective functions, capturing multiple characteristics of the evolving clusters during ensemble pruning. In the evolution process, for different single-cell RNA-seq datasets, they require different consensus functions with different clustering algorithms. Therefore, to cluster specific single-cell RNA-seq data, different consensus functions with different clustering algorithms are beneficial during different evolutionary stages. Therefore, a pool of distinct consensus functions with different clustering parameter settings is maintained throughout the evolution process, resulting in the evolutionary selection competition among different clustering algorithms. Among the consensus functions available, we choose three of them for concise diversity including the connected-triple-based similarity (CTS) matrix, the SimRank-based similarity (SRS) matrix and the approximate SimRank-based similarity (ASRS) matrix. For clustering, KM clustering algorithm, SC and clustering by fast search and find of density peaks (CDP) are selected and compared.
2.2 Unsupervised dimensionality reduction
After optimizing those objectives, the high-dimensional single-cell RNA-seq datasets can be projected to lower dimensional subspaces by NMF; it has been proved that the above updating process can reach local minima of . With different rank models r, NMF can obtain various basis matrices W. We arrange those basis matrices W to a set . A clustering algorithm can then be selected as the basic partitioning algorithm to cluster each of those different basis matrices in the set and obtain multiple clustering results .
2.3 Objective functions
After dimensionality reduction, EMEP algorithm is proposed to evolve multiple clustering results for RNA-seq cell type discovery. To guide the evolution, objective functions have to be carefully designed. We note that the goal of ensemble pruning is to maximize the generalization performance and minimize the number of chosen basic partition clusters. Therefore, for the first goal, we consider two objective functions: (i) sum of distances between the cluster centers and its data points; (ii) data consistency within the same clusters. For the second goal, the third objective function is designed to minimize the number of chosen basic partition clusters.
2.4 Pareto optimal approach
In EMEP, we design the overall cluster deviation, the within-cluster compactness and the number of basic partition clusters as the objective functions and treat the ensemble subsets from the whole multiple clustering results as the candidate solutions to optimize those three objective functions. For the first and second objectives, the lower the score, the better-separated is the clustering between each basis vector W and the label space . For the third objective, the minimization of chosen basic partition clusters is the goal of ensemble pruning. Therefore, the problem of ensemble cluster pruning for high-dimensional single-cell RNA-seq datasets can be regarded as a multiobjective optimization problem on those objectives.
Interpreting single-cell RNA-seq datasets under those three conflicting objectives, the difficulty lies in the existence of explainable mathematical solution; each objective is usually conflicting to each other. In other words, a solution good for one objective may be bad for another. Therefore, it is hard to search for a solution that satisfies all objective functions; single optimality is not guaranteed for more than one objective. The relationship among those objectives can be described herein: a decision vector (also known as solution) is said to Pareto-dominate the decision vector if and , where is the eth objective function as previously defined and E is the number of objective functions for minimization.
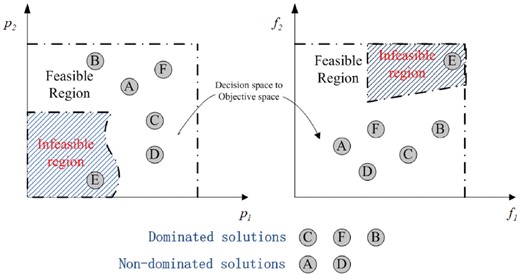
Relationship between the design space and the objective space and solution definition for two-objective problems
Here, we design the EMEP algorithm based on the decomposition method (tchebycheff approach) to elucidate all non-dominated solutions.
2.5 Evolutionary multiobjective ensemble pruning
Following the previous sections, EMEP is proposed for clustering and interpreting high-dimensional single-cell RNA-seq data in this section. The EMEP process includes target vector definition, mutation, crossover and the tchebycheff-based decomposition approach. The mutation and crossover operations are mainly for updating the current individuals in the population. The tchebycheff decomposition approach focuses on decomposing the multiobjective single-cell RNA-seq clustering problem into many single-objective single-cell RNA-seq clustering subproblems.
2.5.1 Target vector definition
2.5.2 Mutation
2.5.3 Crossover
2.5.4 Tchebycheff decomposition approach
For the initialization phase, N weight vectors are generated according to the corresponding individual. Then the neighborhood index B is calculated by finding the T closest weight vectors. Each population member is randomly assigned with one of the consensus functions from the pool and the associated basic clustering algorithms are chosen randomly from the corresponding pool. Based on the consensus functions and the basic clustering algorithm, the selected cluster in si are combined to establish the final clustering result () for the ith individual. Next, three objective functions can be calculated to measure the performance of the clustering result (). After that, the evolution phase is proposed for population evolution using mutation and crossover operations. By executing those two operations, we can obtain a new population with the vector ui. The new ui can be transformed into the binary cluster selection space si, which is employed to select the base clusters to form an ensemble to produce the final clustering result () for the ith individual by the corresponding consensus function and basic clustering algorithm. After calculating those objective functions, the neighbors of each subproblem are considered to compare with the current subproblem to find better solutions; its details are described in Supplementary Algorithm S2. If is higher than , the individual pj is replaced by the new trial vector uk. After repeating this procedure for each subproblem, each offspring individual is compared with the current subproblem and its neighbors in the original population. If the trial vector uk is fitter than the target vector pj, it demonstrates that the combination of selected consensus function and basic clustering algorithm are suitable to analyze the current single-cell RNA-seq dataset of interest. Therefore, that combination will be stored for positive selection. If the target vector pj has better performance than the new trial vector uk, it represents that this combination of consensus function and basic clustering algorithm is not very suitable for the current single-cell RNA-seq dataset. Adaptive selection is employed to select the consensus functions and basic clustering algorithm from the pool, exerting directional selection pressure on the fittest combination of consensus functions and basic clustering algorithms.
2.6 Pool selection of consensus functions and clustering algorithms
The effectiveness of ensemble algorithms for single-cell RNA-seq datasets depends on the selected consensus functions and its associated basic clustering algorithms. However, different single-cell RNA-seq datasets require different consensus functions with various clustering algorithms. In addition, to cluster single-cell RNA-seq datasets, different consensus functions with different clustering algorithms can compete and outperform each other at different stages of the evolution than a single consensus function with single clustering algorithm as in the ensemble algorithm.
Motivated by such observation, we propose an ensemble of consensus functions and clustering algorithms as adaptive selection for evolutionary multiobjective optimization in which a pool of consensus functions, along with a pool of algorithms corresponding to each associated basic clustering algorithm competes to produce successful offspring populations. The candidate pool of consensus functions and clustering algorithms is designed to exhibit diverse characteristics so that they can achieve robust performance characteristics in the evolution, as depicted in Figure 3. From this figure, pi and ui are two pruning solutions, which denote the selected cluster results from π to form different ensembles. Each member is assigned with a consensus function and associated clustering algorithm taken from the respective pools to produce the final cluster result. Then, if the generated trial vector produced ui is better than the target vector pi, the consensus function and associated clustering algorithm are retained with trial vector ui which becomes the target vector in the next generation. For the pool of consensus functions, three consensus functions including the CTS matrix (Klink et al., 2006), the SRS matrix (Calado et al., 2006) and the ASRS matrix (Iam-On et al., 2012) are considered. For basic clustering algorithms in the pool, KM clustering algorithm, SC (Von Luxburg, 2007) and CDP published on Science (Rodriguez and Laio, 2014) are selected to evolutionarily interpret those single-cell RNA-seq datasets for cell population identification.
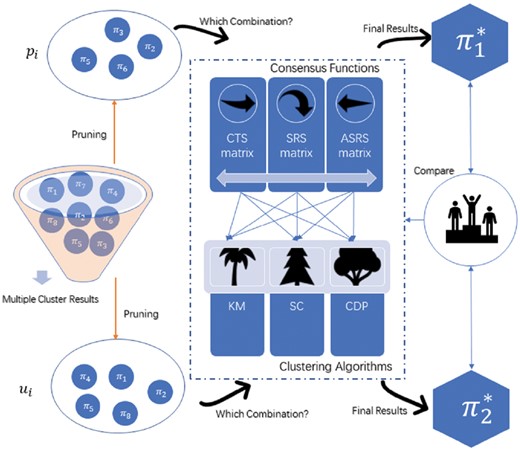
The proposed method of adaptive selection between consensus functions and basic clustering algorithms in a iterative manner. First, multiple cluster results π are obtained after applying NMF and the basic partitioning algorithm. pi and ui are two pruning solutions, which denote the selected cluster results from π to form different ensembles receptively. Then, adaptive selection can select a consensus function from the pool and then find the corresponding clustering algorithm to produce the final cluster result. Three consensus functions including the CTS matrix, the SRS matrix and the ASRS matrix are considered. For basic clustering algorithms in the pool, KM clustering algorithm, SC and CDP are selected. Finally, the new cluster result and can be obtained
2.7 Parameter settings
In order to evaluate the performance of EMEP, five parameters including the population size (N), the number of objective function evaluations, the scaling factor (F), the CR and the neighborhood size (T) are set for scalability and flexibility. The detailed parameter settings of our proposed EMEP are summarized as follows:
Settings for reproduction operators: The scaling factor (F) is 0.4 and CR is 0.1 as discussed in Supplementary Figure S1 and Supplementary Tables S1 and S2. The parameter analysis on those values is summarized in Figure 4.
Population size: The population size N is determined by the simplex-lattice design factor H together with the objective number E (Deb and Jain, 2014); where E is the number of objective functions in our proposed problem and H is set to three.
Neighborhood size: T = 4 (discussion in Supplementary Tables S3 and S4 and Fig. 4)
Number of runs and stopping condition: Each algorithm is run 30 independent times on each dataset. Then, we compute the averages of 30 independent runs and analyze the results on each single-cell RNA-seq dataset for fair comparisons. The 1000 objective function evaluations are adopted as the termination criteria. (Li et al., 2017; Li and Wong, 2018).
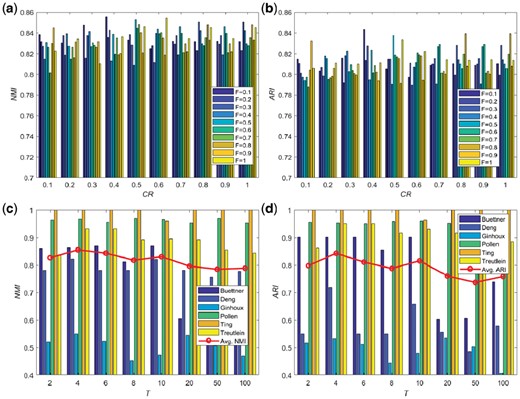
Figures (a) and (b) denote the average NMI and ARI values versus the parameter analysis on F and CR under the same objective function evaluations (i.e. 1000). Figures (c) and (d) denote the NMI and ARI values versus the values of T for six small-scale single-cell RNA-seq datasets and the line chart denotes the average values for those six small-scale single-cell RNA-seq data
3 Results
3.1 Datasets
On top of those 55 simulated datasets, six real-world single-cell RNA-seq datasets and one large-scale single-cell RNA-seq datasets (>3000 cells) are employed to test the cluster validity of EMEP. The summary of the characteristics of the seven real single-cell RNA-seq datasets is tabulated in Table 1.
Summary of the seven single-cell RNA-seq datasets
| Dataset | Cells (n) | Genes (m) | Cell types | Depth (per cell) |
|---|---|---|---|---|
| Buettner (Buettner et al., 2015) | 182 | 8989 | 3 | ∼3000 reads |
| Deng (Deng et al., 2014) | 135 | 12548 | 7 | ∼40 000 reads |
| Ginhoux (Schlitzer et al., 2015) | 251 | 11834 | 3 | ∼60 000 reads |
| Pollen (Pollen et al., 2014) | 249 | 14805 | 11 | ∼50 000 reads |
| Ting (Ting et al., 2014) | 114 | 14405 | 5 | ∼75 000 reads |
| Treutlein (Treutlein et al., 2014) | 80 | 9352 | 5 | ∼62 500 reads |
| Zeisel (Zeisel et al., 2015) | 3005 | 4412 | 9 | ∼50 000 reads |
3.2 Competitive methods
The performance of EMEP is evaluated through comparative studies including nine well-known clustering algorithms: LCE (Iam-On et al., 2012), entropy-based consensus clustering (ECC) (Liu et al., 2017), SC (Von Luxburg, 2007), KM clustering, CDP (Rodriguez and Laio, 2014), t-distributed stochastic neighbor embedding (t-SNE) (Maaten and Hinton, 2008), SIMLR (Wang et al., 2017), Sparse SC (SSC) (Von Luxburg, 2007) and SC based on learning similarity matrix (MPSSC) (Park et al., 2018).
3.3 Evaluation on simulated datasets
Since all those simulated datasets have the truth labels, the external measurements are applied to evaluate the performance of different clustering algorithms. Two important external measurements including normalized mutual information (NMI) and adjusted rand index (ARI) are chosen for evaluating the consistency between the obtained cluster labels and the true labels on each of those 55 simulated datasets. To simulate the data for different subtypes (clusters), Liu et al. (2017) assume that each subtype is characterized by a specific set of knocked-out genes. The set of the number of knocked-out genes is [100, 200, 300, 400, 500]. The noise level is varied from [0, 0.05, 0.1, 0.15, 0.2, 0.25, 0.3, 0.35, 0.4, 0.45, 0.5]. Each knock-out genes includes 11 instances for different noise levels. Therefore, for various synthetic datasets, they have different knocked-out genes with various noise levels. The detail description of those 55 synthetic datasets for NMI was provided in Supplementary Table S5 and Supplementary Fig. S2 (similarity results are obtained for ARI in Supplementary Table S6 and Supplementary Fig. S2). From those Tables, we found that for most datasets, EMEP is superior to other computational methods. For 100 knock-out genes, EMEP can provide better solutions on 10 datasets. At the 0.5 noise level, SC, SSC and MPSSC are superior to EMEP. For the rest dataset, EMEP achieves promising results on some datasets by a large margin. Meanwhile, we can observe that all algorithms can cluster the small noise levels clearly with high NMI since only light perturbations are applied for the human transcriptional regulation network. To compare the overall performance of those dataset, we also summarized the average value, as listed in the last column of Supplementary Table S5. From the results, SC, SSC, MPSSC, SLMIR and EMEP are clearly superior to LCE, KM, CDP, t-SNE and ECC in regard to the average results. Meanwhile, EMEP is also competitive to, if not better than, the SC, SSC, MPSSC and SLMIR. For the ARI, from the experimental results in Supplementary Table S6, we can find that it has similar performance with the NMI. Therefore, we can conclude that our proposed algorithm EMEP performs better than nine clustering algorithms in a competitive manner.
3.4 Application to single-cell RNA-seq datasets
In this section, we evaluate our proposed EMEP and other clustering algorithms including LCE, ECC, SC, KM, CDP, t-SNE, SIMLR, SSC and MPSSC on those seven single-cell RNA-seq datasets containing six small-scale datasets and one large-scale dataset. The detailed description of those seven single-cell RNA-seq datasets including the number of cells, the number of genes and the cell types are summarized in Table 1. NMI and ARI are employed as the evaluation metrics. Figure 5 and Supplementary Table S7 summarize the clustering performance of different algorithms measured by NMI on the six small-scale single-cell RNA-seq data (Similar results are obtained using ARI; see Supplementary Table S8 and Fig. S3). For statistically significant comparisons, the Paired Wilcoxonil signed rank test is computed to perform statistically significant testing between pairs of algorithms in Supplementary Tables S7 and S8. Three symbols including ‘+’, ‘−’ and ‘’, are designed based on P-value < 0.05. The ‘’ denotes that there is not any significant difference between two compared algorithms. The ‘+’ denotes that our algorithm EMEP is better than other algorithms while the ‘−’ indicates the opposite meaning. From the results, we found that EMEP, MPSSC and SIMLR are superior to other seven clustering algorithms. From the Figure 5 and Supplementary Table S7, the EMEP is the best algorithm while CDP algorithm performs the worst because it suffers from the curse of dimensionality where the distances between all pairs of points in the high dimensional and sparse data can become meaningless. Moreover, our proposed algorithm EMEP can provide promising results on several datasets including Buettner, Deng and Treutlin. On the Ting dataset, our algorithm EMEP can provide the nearly optimal accuracy. Meanwhile, we also compare EMEP with t-SNE for those six single-cell RNA-seq data. t-SNE is a dimensionality reduction technique that is particularly well suited for the visualization of high-dimensional datasets. From the experimental results, we can find that EMEP outperforms t-SNE on the six datasets; the differences between SIMLR and the t-SNE are often large, especially for Buettner and Deng datasets. In addition to producing 2D embedding consistent with the true labels on each dataset, we compare EMEP and t-SNE for 2D visualization as summarized in Supplementary Figures S9 and S10. For the EMEP, the similarity matrices for consensus functions from the data are obtained and then the t-SNE is employed to visualize the similarity matrices. The axes are in arbitrary units. Each point represents a cell and smaller distances between two cells represent greater similarity and vice versa. None of the two methods used the true labels as inputs and the true label information was added in the form of distinct colors to validate the results. From those figures, EMEP can identify subpopulation structures for most single-cell RNA-seq data such as Buettner dataset. We observed that each of those three validated groups could be further divided into subgroups and most of them are consistent with the original cellular subpopulations (Buettner et al., 2015). As evidenced by the experimental results, we can summarize that our algorithm can produce better solutions than other state-of-the-art clustering algorithms on most of the single-cell RNA-seq datasets. The reason is that EMEP can optimize the basic partitions with ensemble pruning; it can enable the expressive interpretations with sturdy stability. To compare the overall performance of those clustering algorithms, we calculate the average values on those small-scale single-cell RNA-seq datasets as shown in Supplementary Tables S7 and S8; it demonstrates that EMEP has significant advantages in a robust manner over multiple runs and trials.
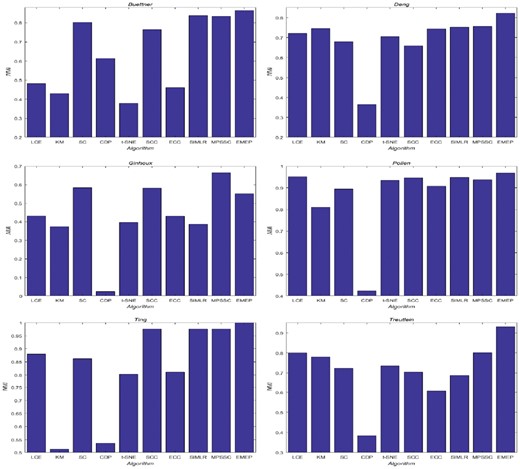
The performance of EMEP and other nine clustering algorithms including LCE, ECC, SC, KM, CDP, t-SNE, SIMLR, SSC and MPSSC on the six small-scale single-cell RNA-seq datasets. The performance is measured using the NMI
Among those small-scale single-cell RNA-seq datasets, we mainly analyze two single-cell RNA-seq datasets, Buettner dataset (Buettner et al., 2015) and Ting dataset (Ting et al., 2014) for detailed insights. The first dataset is the Buettner dataset which has 182 embryonic stem cells and 8989 genes with three clusters at different cell cycles (G1, M and G2M) based on the sorting of the Hoechst 33 342-stained cell area of flow cytometry (FACS) distribution (Buettner et al., 2015). Figure 6a visualizes the heatmap of Buettner dataset with three clusters and Figure 6c shows the 2D visualization of EMEP for Buettner dataset. We observe that our algorithm EMEP can yield significant clusters. The second single-cell RNA-seq dataset is Ting dataset including 114 pancreatic circulating tumor cells and 14 405 genes with five clusters including single-cell transcriptomes from MEFs, the NB508 pancreatic cancer cell line, normal WBCs, bulk primary tumors diluted to 10 or 100 pg of RNA and classical CTC (Ting et al., 2014). Figure 6b visualizes the heatmap of the Ting dataset where we observe that five clusters can be found in the figure and Figure 6d shows the 2D visualization of EMEP for Ting dataset.
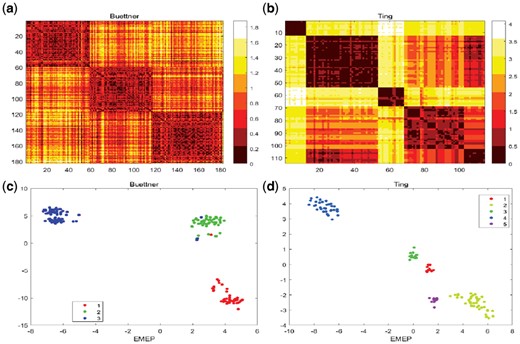
(a) Heatmap visualizes the Buettner dataset including 182 embryonic stem cells and 8989 features with three clusters in the similarity matrix. (b) Heatmap visualizes the Ting dataset including 114 pancreatic circulating tumor cells and 14 405 features with five clusters using the similarity matrix. (c) 2D visualization for Buettner dataset. (d) 2D visualization for Ting dataset
Moreover, we also evaluate the robustness and effectiveness of EMEP on the large-scale single-cell RNA-seq dataset. The Zeisel dataset is derived from the mouse cortex and hippocampus, which relies on unique molecule identifier assays and 3ndays counting. Zeisel et al. (2015) analyzed the transcriptomes of mouse brain cells and the interneurons of similar type in dissimilar regions of the brain. The Zeisel dataset includes nine subpopulations and 3005 cells from the mouse brain. Ten clustering algorithms including LCE, ECC, SC, KM, CDP, t-SNE, SIMLR, SSC, MPSSC and EMEP are employed to test the performance. The experimental results are summarized in Supplementary Figure S4. As depicted in this figure, we can argue that our algorithm EMEP can provide better solutions than other compared methods even for such a big dataset.
3.5 Case studies
Two case studies are conducted to reveal insights into EMEP on the NCBI Gene Expression Omnibus (GEO) repository. The first case is derived from pancreas islet single-cell-based identification of six known human pancreas islet cell types (alpha cells, beta cells, delta cells, pp cells, acinar cells and duct cells) based on the known marker genes (Jiang et al., 2018) in contact with the surrounding acinar and ductal cells of the exocrine pancreas. The sequencing datasets of pancreas islet single cells can be found in the GEO repository under the accession number GSE73727. In this dataset, 60 single cells including 18 alpha cells, 12 beta cells, 11 acinar cells, 8 duct cells, 2 delta cells and 9 pp cells are assayed for 4494 genes. The results of LCE, ECC, SC, KM, CDP, t-SNE, SIMLR, SSC, MPSSC and EMEP are summarized in Supplementary Figure S5. From the figure, EMEP provides better solutions than other clustering algorithms. SIMLR and MPSSC are the first and second runners-up in terms of NMI. For the external measurement ARI, EMEP obtains the best solution compared with other algorithms while CDP is ranked the second for this pancreatic islet single cells dataset. It indicates that EMEP is of good robustness for single-cell RNA-seq datasets. The clustering results from different clustering algorithms for the pancreatic islet single-cells datasets are shown in Figure 7. Cells that are grouped in the same cluster are annotated in the same color in each algorithm column.
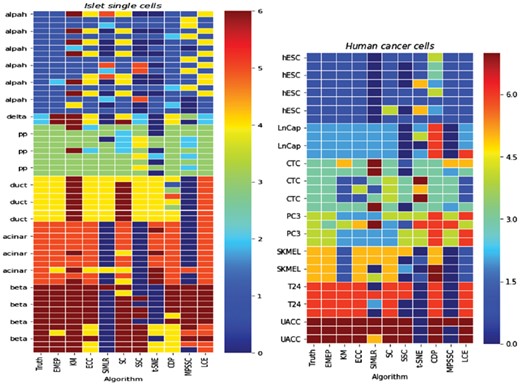
The clustering results from different clustering algorithms including LCE, ECC, SC, KM, CDP, t-SNE, SIMLR, SSC, MPSSC and EMEP on the pancreas islet single cells dataset and Human Cancer Cells dataset. Cells that are grouped in the same cluster are annotated in the same color in each column (i.e. each algorithm)
The second case is human cancer cell dataset (Ramsköld et al., 2012), derived from Smart-Seq which accession number in GEO is GSE38495. In this dataset, there are 33 cells and 3575 features with seven clusters including hESC cells, LNCap cells, CTC cells, PC3 cells, SKMEL cells, T24 cells and UACC cells. The results of different clustering algorithms including LCE, ECC, SC, KM, CDP, t-SNE, SIMLR, SSC, MPSSC and EMEP are summarized in Supplementary Figure S6. From this figure, we can find that EMEP generally performs better than the competitors for NMI. For ARI, we observe that EMEP provides the best solutions while SSC performs the worst. Meanwhile, Figure 7 also depicts the actual clustering results on the human cancer cells dataset, revealing the detailed insights provided by EMEP.
3.6 Low-depth single-cell RNA-seq data
In this section, we conduct an experiment for comparing EMEP with other computational methods on a low-depth single-cell RNA-seq Data published in Nature Communications (Kimmerling et al., 2016). This single-cell libraries were sequenced on a NextSeq500 using 30-bp paired end reads to an average depth of 1 229 637 ± 60 907 reads (∼6000 reads per cell) (Streets and Huang, 2014). After that, Kimmerling dataset was created to test the C1 platform including 194 mouse cell lines with 23420 features. It consists of two groups including C1: 89 L1210, mouse lymphocytic leukemia cells, and 105 mouse CD8+ T-cells (Kimmerling et al., 2016). Five cells with less than 500 non-zero genes were omitted. The data can be downloaded in the GEO repository under the accession number GSE74923. The experiment results of LCE, ECC, SC, KM, CDP, t-SNE, SIMLR, SSC, MPSSC and EMEP are summarized in Figure 8a. From the figure, we can find that EMEP has the highest NMI values; it represents that EMEP performs better than their competitors. This demonstrates that the proposed methods can optimize the basic partitions with ensemble pruning. Except EMEP, t-SNE can provide better NMI values than other computational methods. Meanwhile, LCE, ECC and SIMLR can generate the same NMI values. For ARI, EMEP also can provide the best values while KM and CDP perform the worst. In addition, we produce 2D embedding consistent with the true labels on Kimmerling dataset as shown in Figure 8b. From the figure, we can find that different cells are clearly clustered in their own groups.
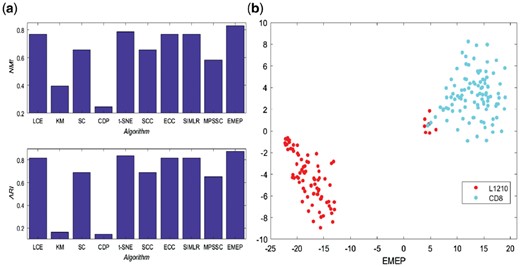
The performance of EMEP and other nine clustering algorithms including LCE, ECC, SC, KM, CDP, t-SNE, SIMLR, SSC and MPSSC on the low-depth single-cell RNA-seq dataset published in Nature Communications. (a) is the performance of NMI and ARI; (b) is the 2D visualization for that dataset
4 Discussion
In this study, a novel multiobjective ensemble algorithm based on evolutionary pruning (EMEP) is proposed based on the observation that not all clustering results are suitable for all single-cell RNA-seq data distribution. In the algorithm, a dimensionality reduction method is employed to project data from the original high-dimensional space to low-dimensional subspaces. Three different cluster validity indices including the overall cluster deviation, the cluster compactness and the number of chosen basic partition clusters are proposed as objective functions to capture multiple characteristics of the evolving clusters. After that, EMEP is proposed to remove unsuitable clusters from the ensemble, improving the generalization performance. Based on the experimental results, EMEP can demonstrate significate advantages in terms of NMI and ARI, compared with 9 clustering methods on more than 60 single-cell RNA-seq datasets. Two case studies including pancreatic islet single cells and human cancer cells are conducted to demonstrate that EMEP can clearly distinguish different cell types from single-cell RNA-seq data.
Although EMEP has a good performance for single-cell RNA-seq data, there are some limitations in this algorithm. Since EMEP is an ensemble-based method, it can be usually time-consuming with high complexity (discussion in Supplementary Material). Moreover, the final solution depends on the choice of the ensemble algorithm. Meanwhile, since evolutionary algorithms are stochastic, there is no guarantee that two runs under the same conditions will find the same solutions. Itol very hard to theoretically prove and design mutation and crossover operations to detect the appearance of the ‘best’ point. Therefore, in this study, we run the EMEP algorithm for 30 independent times on each single-cell RNA-seq dataset and compute the averages for statistically significant comparisons.
For further studies, from the perspective of multiobjective evolutionary optimization for single-cell RNA-seq data, multiobjective evolutionary optimization including encoding schemes and selection of final solution from the non-dominated front is still lacking. Therefore, studies are needed to consider those areas. Meanwhile, we believe that our study provides a refreshing view on the use of multiobjective optimization for single-cell RNA-seq, enabling numerous downstream studies on the multiobjective formulation in other problems.
Acknowledgements
The authors would like to thank reviewers for their reading time and constructive comments.
Funding
This work was supported by three grants from the Research Grants Council of the Hong Kong Special Administrative Region [CityU 21200816], [CityU 11203217] and [CityU 11200218]. This research is also supported by the National Natural Science Foundation of China under [Grant No. 61603087] and funded by the Natural Science Foundation of Jilin Province under [Grant No. 20190103006JH]. Meanwhile, this research is also supported by the Fundamental Research Funds for the Central Universities [No. 2412017FZ026].
Conflict of Interest: none declared.
References

