


Abstract
Here we developed a tool called Breakpoint Identification (BreakID) to identity fusion events from targeted sequencing data. Taking discordant read pairs and split reads as supporting evidences, BreakID can identify gene fusion breakpoints at single nucleotide resolution. After validation with confirmed fusion events in cancer cell lines, we have proved that BreakID can achieve high sensitivity of 90.63% along with PPV of 100% at sequencing depth of 500× and perform better than other available fusion detection tools. We anticipate that BreakID will have an extensive popularity in the detection and analysis of fusions involved in clinical and research sequencing scenarios.
Source code is freely available at https://github.com/SinOncology/BreakID.
Supplementary data are available at Bioinformatics online.
1 Introduction
Genomic irregularities involved in relatively large-scale fragment size, generally greater than 1000 bp, is defined as Structure Variation (SV) conventionally (Feuk et al., 2006). This conception covers different genomic chimeras resulted from deletion, inversion, translocation, insertion and other complex structural disorders. Although the functional impact of most SVs is not yet well understood, a number of gene fusions have been proved to function in tumorigenesis and widely targeted in cancer therapy (Shaw et al., 2015; Solomon et al., 2009). For example, the tyrosine kinase inhibitor Imatinib, has been approved to target BCR–ABL1 fusions in Chronic Myelogenous Leukemia (CML) by blocking the chimeric kinase activity (Bellodi et al., 2009). In addition, Crizotinib and Ceritinib were utilized to treat non-small cell lung cancer (NSCLC) patients by blocking activity of kinase derived from ALK or ROS1 fusions (Bergethon et al., 2012; Davies et al., 2012; Shaw et al., 2012,, 2014). Another example was that RET-CCDC6 fusion was targeted by Cabozantinib in Lung Adenocarcinomas (Suzuki et al., 2013). Inversions and translocations were the vast majority of targetable gene fusion types (Mertens et al., 2015).
In the past few years, various computational methods have been developed for structural variants detection from whole genome sequencing or whole exome sequencing data (Cameron et al., 2017; Chen et al., 2016; Layer et al., 2014; Newman et al., 2014; Rausch et al., 2012). However, only a few methods were designed especially for targeted panel sequencing data (Newman et al., 2014). Recently, we have designed a targeted sequencing panel for ultrasensitive assessment of tumor DNA for clinical applications and cancer target therapy. In order to identify fusion breakpoints, we included those hotspot intronic regions of fusion genes (ALK, RET, ROS1, etc.) known to be clinical relevant and targetable in different tumors and developed a novel computational tool called BreakID to detect genomic breakpoints of different fusion events, including translocations, inversions and complex events. We then evaluated BreakID together with other five computational tools using several tumor cell lines with confirmed fusions.
2 Materials and methods
The whole process of BreakID comprises of three major steps: (i) Identification and clustering of discordant read pairs; (ii) Identification of breakpoint-spanning split reads to determine breakpoints at single nucleotide resolution; (iii) Categorization, filtering and annotation of fusion events (Fig. 1 and Supplementary Fig. S1).
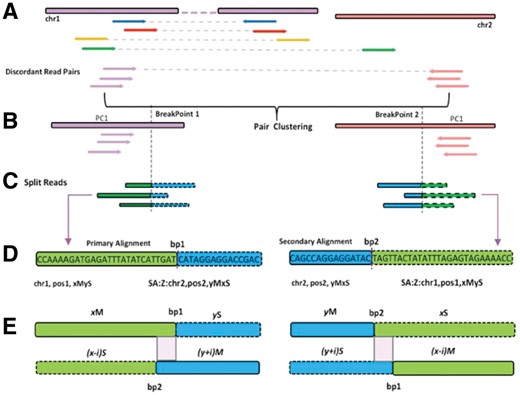
Analytical schema for fusion breakpoints detection in BreakID. (A) DRPs are identified and grouped by chromosomes of two paired-ends; (B) each DRP group is clustered using AHC algorithm; (C) split reads spanning breakpoints are used to find exact breakpoints; (D) the model of primary and secondary alignment and (E) a certain number of mismatches are allowed in the two parts of split reads
First of all, BreakID requires the Binary Alignment/Map (BAM) file of paired-end reads mapped by Burrows-Wheeler Aligner (BWA-mem algorithm) (Li and Durbin, 2010) which can do soft clipping and secondary alignment of clipped part of reads that span breakpoints (split reads, as shown in Fig. 1C). In the first step, BreakID estimates the mean insert size of the sequencing data. The output value will be a reference parameter to define discordant read pairs (DRP, shown in Fig. 1A). The mapping distance between two ends of discordant read pairs must be greater than a certain distance, default is 2 times of the mean insert size. Then BreakID searches such discordant read pairs in the whole bam file, and classifies them into four types: the two ends of the pair lie in (i) the same chromosome with opposite mapping orientation (head to head, blue reads in Fig. 1A); (ii) the same chromosome with same mapping orientation (red in Fig. 1A); (iii) the same chromosome with opposite mapping orientation (tail to tail, orange in Fig. 1A); (iv) different chromosome (green in Fig. 1A). Afterwards, BreakID groups these DRP pairs into different groups by the chromosome locations of read pairs. Next, within each group, the two-dimensional coordinates of DRP’s paired ends treated as points on a two-dimensional plane are clustered using Agglomerative Hierarchical Clustering (AHC) algorithm (Sasirekha and Baby, 2013). In AHC, a clustering convergence distance threshold D is defined first (default is 2*mean insert size). Then the distances (Euclidean distance here) between any two points are calculated to form a distance matrix. In the beginning, all the points are treated as isolated nodes to initialize the clustering process. In each clustering iteration, AHC finds a cluster pair with minimum distance using single-linkage approach, and then merges them into one cluster. The clustering process will be terminated once the distance between the nearest two clusters is greater than D. Compared to other clustering methods, AHC can increase DRP’s clustering performance and ensure only one DRP cluster to represent one candidate fusion event.
In the second step, for those DRP clusters with more than 2 DRP pairs (for example, PC1 shown in Fig. 1B), BreakID collects all split reads (SR) that potentially span fusion breakpoints within a certain region around the mean position of pair clusters (default distance is 2*mean insert size). To be more precisely, BreakID identifies those split reads pairing with primary alignment and its corresponding secondary alignment (with ‘SA’ tag in the bam file, as shown in Fig. 1D). Only those split reads with a certain complementary CIGAR string between primary and secondary alignments are considered as support SRs and then used to compute the candidate breakpoint positions. For example, as shown in Figure 1D, a primary alignment has a CIGAR string of ‘xMyS’ and an exact complementary secondary alignment has a CIGAR string of ‘yMxS’. Due to mismatch problem in the mapping process, a few bases shifting is allowed to identify complementary split reads (as shown in Fig. 1E). The split positions of primary and secondary alignments indicate the candidate fusion breakpoints (bp1 and bp2 in Fig. 1D and E). Afterwards, the final fusion breakpoints are the ones that have the most abundant supported split reads. In the end, a candidate fusion event is supported by a DRP cluster with at least two DRP pairs and at least two breakpoint-spanning split reads.
In the final step, the fusion events with supported DRP cluster and split reads are assigned a fusion type based on the following principles: (i) ‘Translocations’ are denoted when the paired-ends of DRP mapped in different chromosomes; (ii) ‘Inversions’ are denoted when the paired-ends of DRP mapped in the same chromosome but abnormally oriented compared to the default library orientation and without DRPs with type c mentioned above (orange read pairs in Fig. 1A); (iii) ‘Duplication’ are denoted when the paired-ends of DRP mapped in the same chromosome but abnormally oriented compared to the default library orientation, plus the existence of DRPs with reverse mapping position but in default library orientation; (iv) ‘Deletions’ are denoted when the paired-ends of DRP mapped in the same chromosomes and in default library orientation (type a, blue read pairs in Fig. 1A); (v) the remaining events are denoted as ‘Unknown’ (Supplementary Fig. S2). In addition, those false positive fusion events located in repeat regions are excluded. Finally, BreakID annotates the final candidate fusion events with detailed gene information using UCSC RefSeq annotation.
3 Results
To assess the sensitivity and positive-predictive value (PPV) of BreakID to detect fusions, we designed a 352.4 kb panel to cover actionable mutations in cancer target therapy (Supplementary Table S1) and included hotspot intronic regions of ALK, NTRK1/2, RET, ROS1, etc. (Supplementary Table S2). The genomic DNA from five cell lines: HCC-78, NCI-H2228, RT4, LC-2/ad, NA18536 (Supplementary Table S3, plus one reference standard HD753) were pooled together using different pooling ratio (Supplementary Table S4) to simulate different tumor contents (TC) for evaluation. The details of fusion events in these samples and their breakpoints are listed in Supplementary Table S5. The mean sequencing depth of each sample was around 1700×. To investigate the effect of the sequencing depth on BreakID’s performance, the original bam files were down-sampled to 250×, 500×, 700×, 900×, 1000×, 1200× (Supplementary Table S6). As results, the sensitivity of BreakID increased with high sequencing depth, as there are more supporting DRP pairs and breakpoint-spanning split reads when increasing sequencing depth. Specially, at the depth of 500×, which is usually used in typical clinical applications, BreakID achieved sensitivity of 90.63% and PPV of 100% (Table 1). While taking those fusion events with tumor content greater than 5% into account only, the sensitivity and PPV of BreakID were 92.59 and 100%, respectively.
Performance of BreakID and other approaches at mean coverage of 500×
| Methods | Sens. (%) | PPV (%) | Sens. (%, TC > 5%) | PPV (%, TC > 5%) | Runtime(s) | Mem. (GB) |
|---|---|---|---|---|---|---|
| BreakID | 90.63 | 100.00 | 92.59 | 100.00 | 4.63 | 0.11 |
| FACTERA | 87.50 | 80.00 | 88.89 | 77.42 | 15.00 | 0.24 |
| DELLY | 84.38 | 36.99 | 88.89 | 34.29 | 1207.49 | 0.40 |
| LUMPY | 87.50 | 100.00 | 92.59 | 100.00 | 32.12 | 0.88 |
| GRIDSS | 81.25 | 78.79 | 88.89 | 77.42 | 208.36 | 15.49 |
| Manta | 87.50 | 51.85 | 88.89 | 48.00 | 45.58 | 0.03 |
We then compared BreakID with other five fusion detection methods. The comparison results were shown in Table 1 (500×) and Supplementary Table S6 (different depths) and more detailed results were provided in Supplementary Table S9. At the sequencing depth of 500×, BreakID achieved the highest sensitivity of 90.63%, and the highest PPV of 100% which was the same as LUMP. BreakID also performed the best at different sequencing depths. In term of computational speed, it took only 4.63 s for BreakID with relatively low memory 0.11 GB to finish the whole calculation for a sample with 500× sequencing depth. The reason is that BreakID makes use of ‘SA’ information in the split reads to determine the breakpoints directly, while other methods need additional calculations with ‘soft-clip’ split reads to derive breakpoints.
In order to confirm those true positive (TP) fusions and false positive (FP) fusions during calculating performance for each method, we randomly selected 2 TP and 12 FP fusions for further PCR validation. The details of PCR validation experiments are described in Supplementary Material and Supplementary Table S7. The validation results (Supplementary Fig. S3) showed that no PCR products were yielded in any pre-defined FP fusions, which proved that they were artifact fusion events indeed. In addition, we have routinely sequenced NSCLC patient samples enrolled in our collaboration hospitals using this panel and used BreakID to identify actionable fusion events. So far 22 actionable fusions have been identified in 22 patients (Supplementary Table S8). We then selected 2 samples (patient P13 and P16) with enough DNA left for FISH validation and the FISH results confirmed the ALK-EML4 fusions identified by BreakID in both samples (Supplementary Fig. S4).
4 Conclusion
Here we introduced BreakID, a new computational tool to identify genomic breakpoints of fusion events at single nucleotide resolution from targeted sequencing data accurately and rapidly. The validation results indicated that BreakID has achieved better sensitivity and PPV than other tools, and is clearly more computationally efficient. This, in our view, represents a methodology improvement that will benefit many projects that utilize targeted sequencing data to detect actionable fusion events for clinical application. BreakID is implemented in C/C++ using HTSLib library (http://www.htslib.org/) to parse the input BAM file rapidly and it is freely available for academic use at https://github.com/SinOncology/BreakID.
Conflict of Interest: none declared.
References
Author notes
The authors wish it to be known that, in their opinion, Linfang Jin and Jinhuo Lai authors should be regarded as Joint First Authors.

