


Abstract
Multiview datasets are the norm in bioinformatics, often under the label multi-omics. Multiview data are gathered from several experiments, measurements or feature sets available for the same subjects. Recent studies in pattern recognition have shown the advantage of using multiview methods of clustering and dimensionality reduction; however, none of these methods are readily available to the extent of our knowledge. Multiview extensions of four well-known pattern recognition methods are proposed here. Three multiview dimensionality reduction methods: multiview t-distributed stochastic neighbour embedding, multiview multidimensional scaling and multiview minimum curvilinearity embedding, as well as a multiview spectral clustering method. Often they produce better results than their single-view counterparts, tested here on four multiview datasets.
R package at the B2SLab site: http://b2slab.upc.edu/software-and-tutorials/ and Python package: https://pypi.python.org/pypi/multiview.
Supplementary data are available at Bioinformatics online.
1 Introduction
Multiview datasets comprise several data matrices or views, where each matrix contains the result of a different measurement or experiment on the same subjects. Examples of data views in the bioinformatics field are: gene sequencing and expression, metabolomic data, phenotypes and medical imaging. True multiview methods simultaneously process two or more data views to produce a single result coherent with all of them. Several studies show that true multiview methods perform better than single-view solutions (Zhang et al., 2015; Zhao et al., 2014).
Multiview methods for unsupervised tasks are specially useful, as there is no a priori knowledge on classes and consequently it is more difficult to choose the right data view. Even though several multiview methods have been proposed, to the extent of our knowledge none of them is available as open software. This paper presents multiview extensions to four well-known pattern recognition methods: (i) t-distributed stochastic neighbour embedding (t-SNE) (Van Der Maaten et al., 2008), (ii) Multidimensional scaling (MDS) (Kruskal, 1964) and (iii) Minimum curvilinearity embedding (MCE; Cannistraci et al., 2010, 2013) are standard dimensionality reduction and data visualization methods. (iv) Spectral clustering(SC) (Shi and Malik, 2005) is an advanced clustering method that can identify non-convex clusters. The new multiview methods are implemented as open source R and Python packages. They are described here along with some application examples and results.
2 Materials and methods
Multiview dimensionality reduction methods receive a set of high-dimensional data views and produce a single, low-dimensional representation of the input data coherent with all the input views.
Multiview t-SNE (mv-tsne) computes a neighbourhood probability matrix for each input matrix. mv-tsne merges the v probability matrices applying the expert opinion pooling results from (Abbas, 2009). More specifically, it obtains a single probability matrix using the log-linear pooling , where r is a normalization factor and the optimal ωi exponents are determined in an optimization stage. Afterwards, the t-SNE optimization stage is applied to P to find the optimal data projection.
Multiview MDS (mv-mds) double-centres the input matrices and computes the first k common eigenvectors using a variation of the Common Principal Components Analysis (CPCA) method proposed in (Trendafilov, 2010). The result is the orthogonal matrix W such that the pre-processed input matrices can all be expressed as . Hence, the common low-dimensional projection of the original multiview data is the first k common eigenvectors computed by CPCA, where k is the desired dimensionality of the projection.
Multiview MCE (mv-mce) is a multiview extension to MCE. Original MCE computes a distance matrix as the shortest paths between all data points over their minimum spanning tree, then applies MDS to produce a low-dimensional representation of the data. mv-mce computes the shortest paths over the minimum spanning tree over each of the input views, then applies mv-mds to produce a single low-dimensional representation of the data.
Given a multiview dataset, with data views, multiview clustering methods find a clustering assignment that is expected to be coherent with the v input data views.
Multiview SC (mv-sc) (Kanaan-Izquierdo et al., 2018) computes the clustering of a multiview dataset in three steps: first it computes the Laplacian matrices of all input views; second it computes the first k common eigenvectors of the data using CPCA (Trendafilov, 2010); finally it computes the clustering assignment using K-means. CPCA guarantees a decreasing sum of the eigenvalues associated to each eigenvector, thus conserving the eigengaps: . This satisfies the matrix perturbation theory condition and consequently mv-sc produces a stable subspace on which the data clustering can be obtained.
3 Results
Package multiview has been tested on four multiview datasets: multidrug cell line dataset (Szakács et al., 2004), the Berkeley protein dataset (Lanckriet et al., 2004), CORA dataset (McCallum and Nigam, 1998) and a dataset of features from 2D electrophoresis images of cerebrospinal fluid (2DE-CSF), in the context of a study on neuropathies (Pattini et al., 2008).
mv-tsne has been applied to the multidrug cell line dataset. Figure 1 shows the results, where Subplots (a) and (b) correspond to standard t-SNE applied to each view, and Subplot (c) corresponds to the multiview projection produced by mv-tsne. mv-tsne finds the common traits of several cell locations (notably MELAN, CNS and NSCLC), even if those cell groups appear scattered on the single-view projections (a) and (b). mv-tsne and mv-mds projections are also quantitatively better than those produced by the single-view equivalent methods.
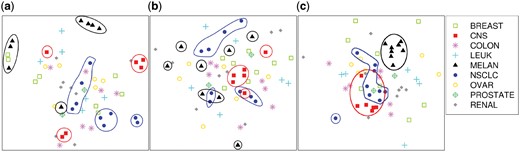
Multidrug cell line data projection. (a) t-SNE on the ABC expression levels; (b) t-SNE on the reaction to drugs; (c) multiview t-SNE
Table 1 shows the clustering purity and normalized mutual information on the tested datasets using single views, stacked data and mv-sc.
Clustering quality on the datasets used
| Best | Stacked | mv-sc | ||
|---|---|---|---|---|
| Multidrug cell | Purity | 0.469 | 0.469 | 0.542 |
| NMI | 0.483 | 0.483 | 0.550 | |
| Berkeley protein | Purity | 0.785 | 0.796 | 0.807 |
| NMI | 0.309 | 0.295 | 0.346 | |
| CORA | Purity | 0.335 | 0.350 | 0.384 |
| NMI | 0.135 | 0.186 | 0.189 |
| Best | Stacked | mv-sc | ||
|---|---|---|---|---|
| Multidrug cell | Purity | 0.469 | 0.469 | 0.542 |
| NMI | 0.483 | 0.483 | 0.550 | |
| Berkeley protein | Purity | 0.785 | 0.796 | 0.807 |
| NMI | 0.309 | 0.295 | 0.346 | |
| CORA | Purity | 0.335 | 0.350 | 0.384 |
| NMI | 0.135 | 0.186 | 0.189 |
Finally, mv-mce has been applied to the 2DE-CSF dataset in order to obtain a 2D representation of the 2050 features in the dataset. These features have been split in two blocks according to an initial clustering (900 and 1150 features), which in turn have been used as input data views for mv-mce. Figure 2 shows the resulting projection and its connection with the four subject classes in the study.
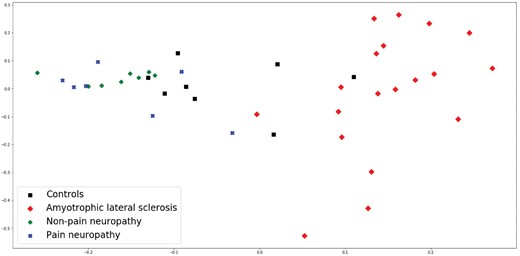
Multiview minimum curvilinearity embedding projection of the 2DE-CSF dataset
4 Conclusions
Package multiview provides multiview extensions of widely used pattern recognition methods that often yield higher quality results than their single-view counterparts. The dimensionality reduction methods may help to discover underlying patterns in the data that may not be apparent when working with a data view alone. Moreover they provide a single-view representation of multiview data, allowing their use with classical methods. The mv-sc method produces better clustering assignments than single-view spectral clustering. Besides, all the methods presented can process any number and type of input data views. In conclusion, package multiview, available in R and Python, provides potentially useful and widely applicable pattern recognition methods to the bioinformatics community, so this package makes a relevant contribution.
Funding
This work was supported by [TEC2013-44666-R, TEC2014-60337-R and the 2009SGR-1395] consolidated research group of the Generalitat de Catalunya, Spain. CIBER-BBN is an initiative of the Spanish ISCIII.
Conflict of Interest: none declared.
References

