


Abstract
In recent years, several experimental studies have revealed that the microRNAs (miRNAs) in serum, plasma, exosome and whole blood are dysregulated in various types of diseases, indicating that the circulating miRNAs may serve as potential noninvasive biomarkers for disease diagnosis and prognosis. However, no database has been constructed to integrate the large-scale circulating miRNA profiles, explore the functional pathways involved and predict the potential biomarkers using feature selection between the disease conditions. Although there have been several studies attempting to generate a circulating miRNA database, they have not yet integrated the large-scale circulating miRNA profiles or provided the biomarker-selection function using machine learning methods.
To fill this gap, we constructed the Circulating MicroRNA Expression Profiling (CMEP) database for integrating, analyzing and visualizing the large-scale expression profiles of phenotype-specific circulating miRNAs. The CMEP database contains massive datasets that were manually curated from NCBI GEO and the exRNA Atlas, including 66 datasets, 228 subsets and 10 419 samples. The CMEP provides the differential expression circulating miRNAs analysis and the KEGG functional pathway enrichment analysis. Furthermore, to provide the function of noninvasive biomarker discovery, we implemented several feature-selection methods, including ridge regression, lasso regression, support vector machine and random forests. Finally, we implemented a user-friendly web interface to improve the user experience and to visualize the data and results of CMEP.
CMEP is accessible at http://syslab5.nchu.edu.tw/CMEP.
1 Introduction
Many types of diseases, especially cancer, are associated with disease-specific biomarkers that serve as diagnosis, prognosis and monitoring tools, and provide a better understanding of disease pathogenesis (Weiland et al., 2012). However, some of the current diagnostic procedures have limitations in the application of routine health checkups, since they are invasive and inconvenient (Chen et al., 2008; Duffy, 2007). Hence, minimally invasive biomarkers of human disease, such as a diagnosis using blood-based liquid biopsies, can significantly improve the disease prognosis by facilitating early diagnosis and routine clinical monitoring (Lieben, 2015). MicroRNAs (miRNAs) are small endogenous noncoding RNAs with approximately 22 nucleotides that can modulate up to 60% of the protein-coding genes in the human genome at the posttranscriptional level (Bartel, 2004; Friedman et al., 2009). Additionally, large amounts of miRNAs were derived from various tissues/organs and present in stable forms in the serum, plasma, exosome and whole blood (Alhasan et al., 2014; Chen et al., 2008). Thus, circulating miRNAs have emerged as promising potential in noninvasive biomarkers for human disease diagnosis and surveillance using blood-based liquid biopsies (Kawaguchi et al., 2016; Ma et al., 2012; O'Brien et al., 2017; Singh et al., 2016; Weiland et al., 2012). Recently, several studies have identified some disease-specific circulating miRNA signatures for various diseases (Alhasan et al., 2016; De Rosa et al., 2018; Liu et al., 2016; Motawi et al., 2015; Zhang et al., 2017).
Although there have been several studies that attempt to construct circulating miRNA databases, e.g. miRandola (Russo et al., 2018) and exRNA Atlas (http://exrna-atlas.org/) (Ainsztein et al., 2015), they have not yet integrated large-scale circulating miRNA profiles or provided the biomarker-selection function using machine learning methods. The miRandola database is a manually curated database based on literature for extracellular circulating noncoding RNAs, which contains the relations between circulating miRNAs and diseases from published articles. However, miRandola has not provided miRNA expression profiles and profile analyses. On the other hand, exRNA Atlas contains numerous circulating small RNA datasets with expression profiles of various types of diseases, but it does not provide further analysis, such as the functional pathway enrichment with differentially expressed circulating miRNAs or feature selection functions for finding the circulating biomarkers of noninvasive diagnosis and prognosis.
To fill this gap, we have developed the Circulating MicroRNA Expression Profiling (CMEP) database (http://syslab5.nchu.edu.tw/CMEP), which is a public database that not only contains large-scale circulating miRNA datasets from diverse platforms (e.g. small RNA sequencing, miRNA microarray and qRT-PCR, etc.) but also provides miRNA expression profiling, pathway enrichment analysis with miRNA target genes and feature-selection methods. Figure 1 shows the framework of the CMEP construction. In the CMEP database, we systematically collected 169 circulating miRNA expression-profile datasets with specific disease conditions. To provide the comprehensive miRNA resource for noninvasive diagnosis, we collected wide-ranging sample types, including serum, plasma, exosome, microvesicle, urine, peripheral blood mononuclear cells, red blood cells and platelets, etc. Each dataset contains several groups of samples with different phenotypes. We manually performed data curation for these circulating miRNA datasets to create phenotype-specific subsets and to assign samples to subsets according to the experimental description of the samples. Afterwards, we comprehensively categorized subsets according to disease state, disease subtypes, mutations, cancer stages and sample types, etc. This resulted in 66 miRNA datasets, including 228 subsets and 10 419 samples. To identify phenotype-specific differentially expressed miRNAs in each dataset, we selected subsets with at least three samples, normalized the expression profiles and then performed a t-test between the two subsets without overlapping samples, which resulted in 194 subset pairs.
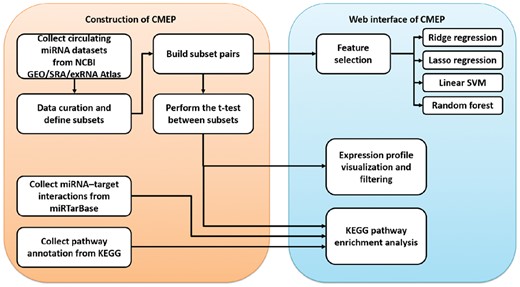
Framework for constructing the CMEP database. Circulating miRNA datasets were collected from NCBI GEO, SRA and the exRNA Atlas, and then all samples were classified into phenotype-specific subsets. To identify phenotype-specific differentially expressed circulating miRNAs in each dataset, we performed t-tests between each pair of subsets with no overlapping samples from the same dataset. For each subset pair, we constructed a KEGG functional pathway enrichment analysis that integrated the information of miRNA–target interactions from the miRTarBase and the functional pathway annotations of miRNA target genes from the KEGG. Furthermore, four feature-selection pipelines, such as ridge regression, lasso regression, linear support vector classification (SVC) and random forests, were constructed with recursive feature elimination (RFE) to identify the important circulating miRNAs as potential biomarkers. Finally, all data and analysis functions were integrated into a user-friendly web interface
To demonstrate the functionality to biologists, the CMEP visualizes the expression profiles of all differentially expressed circulating miRNAs with the significance level and expression values between two subsets, and provides the filtering function based on the P-value threshold, up/downregulation, or autocomplete search field. Furthermore, the CMEP provides an enrichment analysis function, which integrated the miRNA–target interactions from the miRTarBase (Chou et al., 2016) and the functional pathway annotations from the Kyoto Encyclopedia of Genes and Genomes (KEGG) (Kanehisa et al., 2017), for a better understanding of the differentially expressed circulating miRNAs within specific disease conditions. For noninvasive disease biomarker identification, we implemented several feature-selection methods, such as ridge regression (Hoerl and Kennard, 1970), lasso regression (Tibshirani, 1996), linear support vector classification (SVC) (Chang and Lin, 2011) and random forests (Genuer et al., 2010; Strobl et al., 2008), into the CMEP database to provide users with the ability to identify the crucial circulating miRNAs.
In summary, the CMEP database characterizes differentially expressed circulating miRNAs, analyzes the biological pathways that involve the circulating miRNAs, and recognizes the relevant miRNAs across various types of diseases in different organ systems. The CMEP database serves as a resource to enable biological and clinical researchers to develop new noninvasive biomarkers for disease diagnosis and routine monitoring using blood-based liquid biopsies.
2 Materials and methods
2.1 Circulating miRNA datasets collections
We systematically collected 66 human circulating miRNA datasets regarding diseases and the annotation data of the platforms used in the datasets from the NCBI Gene Expression Omnibus (GEO) (Edgar et al., 2002), the Sequence Read Archive (SRA) (Leinonen et al., 2011) and the exRNA Atlas. Each dataset consists of several subsets, where each subset is a group of samples associated with a specific phenotype. Thus, we manually created several phenotype-specific subsets within each dataset and then assigned samples to subsets according to the textual description of the datasets and samples. Consequently, each subset contained a group of samples with specific phenotypic traits or disease conditions, e.g. cancer state, disease progression, a type of tissue and genotype. Finally, a total of 228 subsets with at least 3 samples were created, containing a total of 10 419 samples. We categorized these datasets and subsets into specific disease structures referring to the Unified Medical Language System (UMLS) (Bodenreider, 2004). To obtain the expression profiles of each dataset, we converted the probe IDs into human miRNA names based on the platform annotation. If an miRNA maps to multiple probe IDs, we calculate the average expression values.
2.2 Phenotype-specific differentially expressed circulating miRNAs identification and pathway enrichment analysis
2.3 Feature-selection pipeline construction for circulating miRNAs
To identify the circulating miRNAs as potential biomarkers for the detection or monitoring of various diseases, we implemented four feature-selection methods, such as ridge regression (Hoerl and Kennard, 1970), lasso regression (Tibshirani, 1996), linear support vector classification (SVC) (Chang and Lin, 2011) and random forests (Genuer et al., 2010; Strobl et al., 2008), to calculate the weight associated with each feature (i.e. circulating miRNAs) and to reflect the importance of the circulating miRNAs for phenotype-specific subset pair classification. The scikit-learn library (http://scikit-learn.org/) was used to implement all feature-selection pipelines. In the web interface, CMEP performs the feature selection procedure and visualizes the profile of features when users choose a feature-selection method.
Since the goal is to identify the subset of features that can classify the subset pair, the ridge regression was implemented by logistic regression (Fan et al., 2008) with L2 norm regularization, and lasso regression was implemented by logistic regression with L1 norm regularization. Moreover, every forest contained 100 decision trees in random forests. All feature-selection algorithms were applied with recursive feature elimination (RFE) (Guyon et al., 2002) to extract the specific numbers of relevant circulating miRNAs.
To validate the feature-selection methods and to compare the performance of each feather-selection method, we selected the subset pair ‘Prostate cancer versus Normal’, which have 86 samples from dataset GSE71008 for demonstration. The samples in dataset GSE71008 were randomly equally split into training and test sets. The training set was used to select features using REF. The test set was used to calculate the performance using the linear SVM classifier.
3 Results
3.1 The web interface
The web interface of CMEP comprises four distinctive panels (Fig. 2) as follows: Disease panel (upper left), Dataset panel (upper right), Subset pair panel (lower left) and Expression profiling panel (lower right). The disease panel consists of two components, the sample type selection box and the disease tree. Users will first select the desired sample type (serum, plasma, urine, etc.), and the disease tree will interactively display all corresponding diseases using UMLS classification, such as breast cancer and colon cancer. After selecting a disease type, the dataset panel displays all related datasets and information including the dataset’s GSE numbers, sample type and title. Once a particular dataset is chosen, the subset pair panel shows all subset pairs, such as normal versus disease, within the dataset. After selecting a subset pair, the expression profiling panel shows the differential expression profile of the subset pair’s miRNAs. Within the expression profile panel, the dataset title with GSE number, subset titles and number of samples are provided. Users can choose up/down regulation and P-value threshold to filter the results. The miRNA search box with autocomplete function is provided to access the miRNAs that are particularly of interest. For each miRNA, the t-test P-value and subset mean values are calculated, and the expression profile is visualized by a heat map to denote the expression levels.
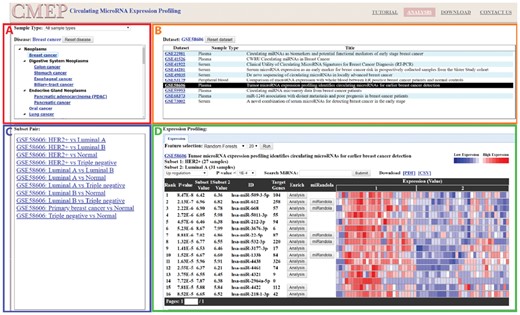
The CMEP web interface provides four major panels as follows. (A) Disease panel (upper left): The sample type box shows all available sample types. The diseases tree lists all diseases according to UMLS classification in a hierarchical manner. (B) Dataset panel (upper right): All datasets of the selected disease are listed with sample type and title. (C) Subset pair panel (lower left): All subset pairs within datasets are listed. (D) Expression profiling panel (lower right): The differential expression profile of miRNAs is graphically presented, with corresponding P-values calculated by t-test. The feature selection functions apply machine learning algorithms to search for important miRNAs
3.2 KEGG enrichment analysis and feature selection
For each miRNA in the expression profiling panel, by interacting with miRTarBase to search for miRNA’s target genes, pathway enrichment analysis calculates the overlapped genes to discover significantly enriched biological pathways (Fig. 3).
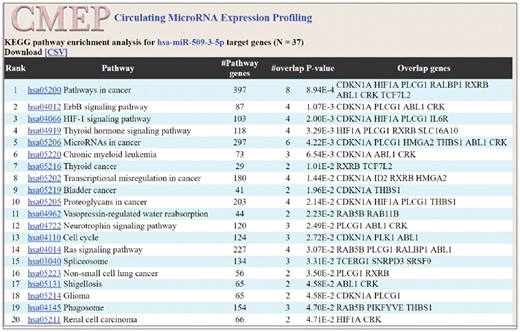
Web interface of KEGG pathway enrichment analysis. The target genes of the miRNA are overlapped with pathway genes, in order to calculate the P-value. The pathway with a smaller P-value has a higher ranking
To unveil more relevant miRNAs in the dataset, we applied machine learning algorithms, such as the linear support vector classifier, ridge regression, lasso regression and random forest classification for feature selection. Within each of the feature-selection methods, the desired number of features can be freely chosen by the user’s interest (Fig. 4).
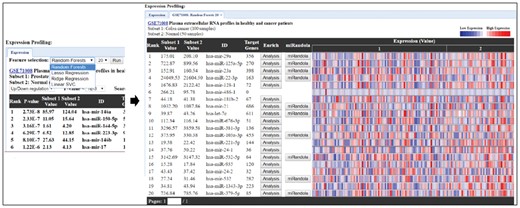
Web interface of feature selection methods. The four feature-selection methods, random forest classification, lasso regression, ridge regression, linear SVC allow users to select any numbers of features
3.3 Example applications
To demonstrate the biological applications of CMEP, we used dataset GSE71008 as an example to show the differentially expressed circulating miRNA profile, feature selection function and KEGG pathway enrichment analysis. Within the dataset, we used a subset pair (prostate cancer versus normal) containing 86 samples (36 prostate cancer samples and 50 normal samples) in total.
3.4 Differentially expressed circulating miRNAs
To demonstrate how differentially expressed circulating miRNAs assisted users in evaluating the statistically significant miRNAs within a large amount of the rest, hsa-mir-146b was taken as an example (Fig. 5). Users can intuitively notice that the 5 most statistically significant miRNAs within the subset pair are hsa-mir-146a (P-value 2.73E−8), hsa-mir-150-5p (P-value 2.33E−7), hsa-mir-144-5p (P-value 3.16E−7), hsa-mir-223-3p (P-value 6.29E−7) and hsa-mir-146b (P-value 8.10E−7). The subset-pair mean values were also calculated to provide more in-depth insight into the miRNA variation between normal samples and prostate cancer samples. The heat map graphically represents the miRNA expression of each of the samples, with red representing high expression and blue representing low expression. In the miRNA expression profile, users can easily observe that the fifth miRNA, hsa-mir-146b, is obviously down-regulated among the prostate cancer samples. Interestingly, a previous study showed that hsa-mir-146, which was a potential tumor suppressor, was significantly reduced in prostate cancer tissues (Ding et al., 2016).
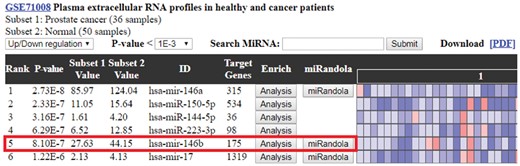
The miRNA expression profile of GSE71008 (Prostate cancer versus Normal). The miRNA expression profile calculates the P-values by t-test and the miRNAs are ranked by the P-value. The hsa-mir-146b is the fifth miRNA in the expression profile, and its expression is shown down-regulated in prostate cancer samples. This finding is proven by a previous study that mir-146b expression in prostate tumor cells is significantly decreased compared to that in normal prostate cells
3.5 Feature selection
CMEP provides four feature selection methods, which are lasso regression, ridge regression, linear support vector classifier and random forest classifier, which are all integrated with a recursive feature elimination algorithm to examine the significance of each of the miRNAs in the dataset. In the GSE71008 subset (prostate cancer versus normal), we performed the four different feature selection methods and selected 20 miRNAs using each of the methods. The four feature selection methods obtained 45 unique miRNAs, and 15 miRNAs were documented in different studies related to prostate cancer previously. For example, Okato et al. reported that hsa-mir-150-5p expressed the antitumor property in prostate cancer by targeting SPOCK1 (Okato et al., 2017). Interestedly, the expression profile of hsa-miR-150-5p also showed that it was down-regulated among the prostate cancer samples, which consolidated the validity of the feature selection methods. hsa-mir-150-5p was selected by all four feature selection methods, suggesting that it may be one of the most important circulating miRNA biomarkers for prostate cancer.
To further investigate the predictive capacity of the feature-selection methods, we split the original prostate cancer versus normal subset into a training subset and testing subset in a ratio of 1: 1. We performed the four methods of the training subset, selecting 1 feature to 50 features and using the same training subset to fit the model using different classifiers such as the support vector classifier or logistic regression. Then, we used the testing set to validate the area under the curve (AUC) of the receiver operating characteristic curve (ROC Curve) (Fig. 6).
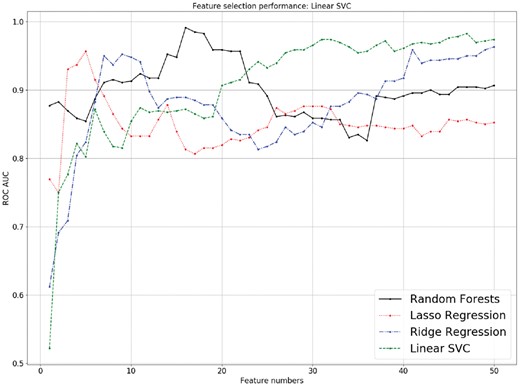
The performance of four feature selection methods in subset pair ‘Prostate cancer versus Normal’ of GSE71008 using linear SVM with different numbers of features. All four feature-selection methods had a similar performance ranging from 1 to 50 features. Ridge regression and linear SVC performed poorly when less than 5 features were selected (AUCs < 0.80), while the random forest method (0.85 < AUCs < 0.90) and lasso regression method (0.75 < AUCs < 0.95) performed pretty well. The random forest method performed better when fewer features were selected (14–22 features, AUCs > 0.95), while other methods had increasing AUCs (AUCs > 0.80) when more features were selected
By implementing the features selected by four different methods and performing validation, we observed that under the linear SVC, the AUCs of the four feature-selection methods obtained an overall similar performance, but random forest-selected features appeared to perform better when fewer numbers of features were selected (14-22 features, with AUCs > 0.95), while other feature-selection methods, such as lasso regression, ridge regression and SVC had increasing AUCs (AUCs > 0.80) when more features were selected. From a statistics point of view, we preferred to use fewer, more important features to prevent overfitting. From the above results, the four feature-selection methods were all effective in predicting important miRNAs, which assisted biologists in discovering potential candidates for further biological experiments.
To demonstrate whether feature selection followed by machine learning was outperformed by solely using machine learning, we tested another dataset, GSE98181, to perform linear SVC 5-fold cross-validations, with and without feature selection (Fig. 7). To examine their performance, ROC analysis was implemented. The results showed that all feature-selection methods followed by linear SVC had AUCs ranging from 0.79 to 0.99, which significantly outperformed linear SVC without feature selection (AUC = 0.48), suggesting that the feature selection methods substantially improved performance. Interestingly, miR-29a-3p, which was simultaneously selected by three feature-selection methods, was found to be documented in the previous published research (Pei et al., 2016). The research found that miR-29a promoted breast cancer cell proliferation and was upregulated in the breast cancer cell line, which was consistent with our expression profile on breast cancer samples and normal samples with mean values of 0.58 and 0.19, respectively.
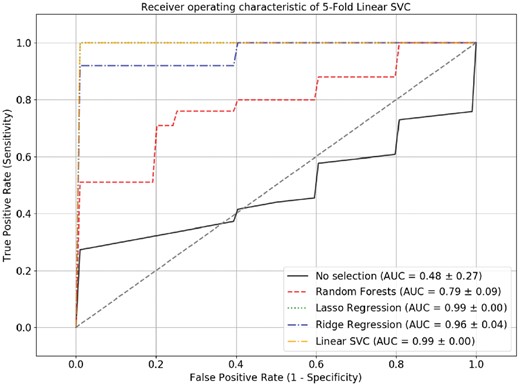
ROC curve of the 5-fold cross-validation linear SVC model. The ROC curve showed that the linear SVC model performed better when feature-selection methods were included, as their AUCs ranged from 0.79 to 0.99, which were significantly higher than those without feature selection (AUC = 0.48)
3.6 KEGG pathway enrichment analysis
To further explore how miRNAs were involved in different biological pathways, 15 miRNAs from GSE71008, which were selected from the previously mentioned feature-selection methods and were proven to be related to prostate cancer, underwent KEGG pathway enrichment analysis. Six miRNAs (mir-223-3p, mir-451a, mir-125a-5p, mir-233, mir-143 and mir-221) showed that their target genes were significantly enriched to the prostate cancer pathway. This gave users a more thorough understanding of the miRNA’s attributes.
4 Conclusions
In this study, we processed large-scale datasets collected from NCBI GEO, SRA and exRNA Atlas to extract the differentially expressed circulating miRNAs, implemented the KEGG pathway analysis for the target genes of the circulating miRNAs, and constructed four feature-selection pipelines to identify the crucial circulating miRNAs as potential noninvasive biomarkers for diagnosis or prognosis in various types of diseases. We integrated and visualized all data and functions into the CMEP database. Although CMEP was developed with the goal of collecting, processing, analyzing and visualizing all publicly circulating miRNA data regarding various types of disease, it still has limitations that arise from the characteristics of the data. First, the circulating miRNA datasets were generated using different array or sequencer platforms, which caused most of datasets to have different numbers of circulating miRNAs and different scales of expression values. Second, the circulating data was generated from various research teams with diverse experiment back-grounds, designs and protocols, which resulted in inevitable batch effects and potential quality issues between different datasets in CMEP. To summarize, we have therefore applied the strategy of only comparing subsets within the same dataset and have demonstrated the performance of feature selection across different datasets in this study.
Despite these limitations, the CMEP characterizes differentially expressed circulating miRNAs, analyzes the bio-logical pathways they involve, and provides the feature-selection methods for identifying the crucial circulating miRNAs. Moreover, the systematic and user-friendly web interface can assist users in accessing the information on CMEP efficiently. We anticipate that CMEP can facilitate biological and clinical researchers in better studying the biological insight of the circulating miRNAs and develop new noninvasive biomarkers for diagnosis and routine monitoring. Finally, as more and more circulating miRNA datasets are generated and provided, we will keep the data in our CMEP database updated to ensure that it can provide comprehensive information on circulating miRNAs.
Funding
This work was supported in part by the Advanced Plant Biotechnology Center from The Featured Areas Research Center Program within the framework of the Higher Education Sprout Project by the Ministry of Education (MOE) in Taiwan. Moreover, this study was supported by the grant NIH1U01CA230705 of the National Institutes of Health (NIH).
Conflict of Interest: none declared.
References
Author notes
Jian-Rong Li and Chun-Yip Tong authors contributed equally to the paper as first authors.

