


Abstract
Biological processes are characterized by a variety of different genomic feature sets. However, often times when building models, portions of these features are missing for a subset of the dataset. We provide a modeling framework to effectively integrate this type of heterogeneous data to improve prediction accuracy. To test our methodology, we have stacked data from the Cancer Cell Line Encyclopedia to increase the accuracy of drug sensitivity prediction. The package addresses the dynamic regime of information integration involving sequential addition of features and samples.
The framework has been implemented as a R package Sstack, which can be downloaded from https://cran.r-project.org/web/packages/Sstack/index.html, where further explanation of the package is available.
Supplementary data are available at Bioinformatics online.
1 Introduction
Traditional methods for predictive modeling of drug sensitivity have relied on a single model, such as a random forest (RF), built utilizing only one database (Rahman et al., 2017). But the full characterization of a disease pathway requires a vast array of biological features that may not be available from a single source. When integrating multiple different datasets, it is often observed that some features and samples may not be present in both databases. In order to overcome this limitation, models built on subsets of features and samples can be combined in order to improve prediction accuracy in a technique known as stacking (Matlock et al., 2018). In this article, we provide a R package that can generate integrated stacking models from a general staircase structure of samples and features. Using the Cancer Cell Line Encyclopedia (CCLE) (Barretina et al., 2012) we illustrate the advantages of horizontal stacking as compared to other forms of stacking. This package will be beneficial for practitioners with designing predictive models from databases containing samples with mixed set of features.
2 Methods and results
The problem is formulated using the template shown in Figure 1. In this figure we have a set of data from up to n separate databases where each database represents a single ‘layer’ in the template. Only a subset of features is shared between any two databases with an even smaller subset that is shared between ALL databases. We have envisioned three different methods in which we can stack this type of data which we denote as a heterogeneous dataset. The first method, horizontal (H) stacking, involves building individual models using all samples available for each independent set of features. Vertical (V) stacking builds individual models using samples with common sets of features. Finally, in L shaped stacking we attempt to combine the top models from the previous two methods. The first set consists of the models from H stacking that contain the largest amount of sample data and the remaining models are the V models that contain the largest number of features. The individual models are all RFs with 100 trees and the remaining parameters are defaults found in most implementations; a leaf size of 5 and a node splitting criteria of one-third the number of features.
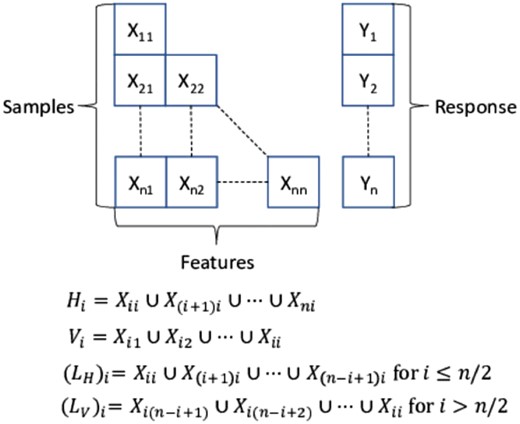
Illustration of stacking heterogeneous datasets problem
2.1 Bootstrap stacking
3 Performance
To illustrate the benefits of heterogeneous data stacking, from CCLE (Barretina et al., 2012) we have taken the gene expression values for 18 000+ genes and the area under the dose-response curve for the drug 17-AAG for 490 cancer cell lines. The feature selection algorithm RELIEFF is used to pick the top 300 gene expression features. We divide the chosen features and samples into four separate datasets utilizing the biased methodology detailed in Supplementary Section 1.3. The goal of our models is to predict the area under the dose-response curve value for a given cancer cell line by stacking these heterogeneous datasets. The number of bootstrap iteration, Nbs, is set heuristically to be 25 (see Supplementary Material). The accuracy is estimated by randomly selecting Ns samples and selecting 80% of the samples for training and leaving out the remaining for testing. After estimating the error, this process is repeated 500 times with a new training/testing set in each iteration before increasing Ns and then repeating the experiment. For a base line comparison, we also build a single model using the K-nearest neighbor impute method (Liew et al., 2011) to estimate the missing features. The mean-square error estimates of the stacked model predictions for an increasing number of samples are shown in Figure 2. These models are built on a 4-layer n = 4 heterogeneous dataset. In addition, we have calculated the 90% bootstrap confidence interval from all 500 iterations and those are also displayed in Figure 2. We note that horizontal stacking outperforms the other methods even for small sample sizes and that horizontal stacking also outperforms imputation with all but the smallest sample sizes. Similar graphs for different layers of stacking are shown in the Supplementary Material. Also in the Supplementary Material are the results of stacking CCLE data with the MD Anderson Cell Lines Project to improve drug sensitivity prediction (Li et al., 2017).
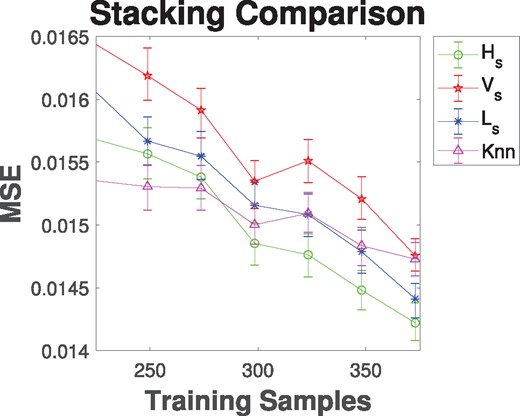
Mean-square error analysis of horizontal (Hs), vertical (Vs) and L (Ls) stacked models built on a 4-layer heterogeneous dataset. Models are compared to just using K-nearest neighbor impute (Knn) to estimate the missing features. Error bars show the 90% bootstrap confidence interval calculated using 500 iterations
4 Conclusions
This framework has been implemented in R packaged labeled Sstack. The presented computational framework provides the enhanced features of (i) automated formulation of the supplied datasets into staircase format enabling the presented forms of stacking. (ii) Optimized stacking for RF based predictive modeling for integrating sample sets with different sets of features. In addition, we have shown that horizontal stacking outperforms other forms of stacking.
Funding
This work was supported by the National Institutes of Health grant [R01GM122084].
Conflict of Interest: none declared.
References

