


Abstract
Medulloblastoma (MB) is a brain cancer predominantly arising in children. Roughly 70% of patients are cured today, but survivors often suffer from severe sequelae. MB has been extensively studied by molecular profiling, but often in small and scattered cohorts. To improve cure rates and reduce treatment side effects, accurate integration of such data to increase analytical power will be important, if not essential.
We have integrated 23 transcription datasets, spanning 1350 MB and 291 normal brain samples. To remove batch effects, we combined the Removal of Unwanted Variation (RUV) method with a novel pipeline for determining empirical negative control genes and a panel of metrics to evaluate normalization performance. The documented approach enabled the removal of a majority of batch effects, producing a large-scale, integrative dataset of MB and cerebellar expression data. The proposed strategy will be broadly applicable for accurate integration of data and incorporation of normal reference samples for studies of various diseases. We hope that the integrated dataset will improve current research in the field of MB by allowing more large-scale gene expression analyses.
The RUV-normalized expression data is available through the Gene Expression Omnibus (GEO; https://www.ncbi.nlm.nih.gov/geo/) and can be accessed via the GSE series number GSE124814.
Supplementary data are available at Bioinformatics online.
1 Introduction
Medulloblastoma (MB) is a brain tumor arising in the cerebellar vermis predominantly in pediatric patients. It is currently treated by surgery, radiotherapy and chemotherapy, achieving 5-year overall survival rates of about 70%. However, survivors often suffer from permanent neurocognitive sequelae.
It is now commonly accepted that MB harbors four distinct molecular subgroups, referred to as Wingless/Integrated (WNT), Sonic hedgehog (SHH), Group 3 (G3) and Group 4 (G4) (Taylor et al., 2012). These subgroups have been shown to exhibit distinctive molecular landscapes (Northcott et al., 2017) and are associated with different clinical risk groups (Kool et al., 2012). As a consequence, personalized therapy of MB patients appears now almost within reach (Gopalakrishnan et al., 2015; Sengupta et al., 2017).
However, to fully endorse such treatment options, more research is required to understand the origin and development of MB and how model organisms for drug testing can be derived. The establishment of such knowledge is heavily dependent on molecular profiling data. For instance, the possibility of further delineating MB subgroups into subsets has been hypothesized earlier (Taylor et al., 2012), but it was not until larger cohorts had been gathered that such subsets have been reported in detail (Schwalbe et al. 2017; Cavalli et al., 2017; Northcott et al., 2017). Furthermore, while the discovery of genomic events and potential driver genes has also been greatly advanced (Cavalli et al., 2017; Northcott et al., 2017), it is yet to be fully revealed how these genes are linked to the phenotype at a system wide level. Related investigations would likely require more integrative methods such as molecular networks (Barabási et al., 2011; Vidal et al., 2011), the reverse engineering of which in turn is also heavily dependent on large-scale datasets.
Gene expression is one of the most profiled types of high-throuput data in the MB field. However, the establishment of large MB patient cohorts has been hampered by the low incidence rate of only ∼1.8 new cases per year per million people (Louis et al., 2016). Consequently, a multitude of transcription datasets of varying compositions and numbers of samples has been released to the public. Additionally, while healthy controls play a crucial role in many types of analyses, publicly available MB transcription datasets typically lack any normal cerebellar samples. Yet, several independent transcription datasets with cerebellar samples exist in the literature. Thus, while the data generated by the community reflects an unprecedented collection of MB and cerebellar transcriptional profiles, it is not clear how such a resource can be fully exploited, considering that it is distributed across different studies and platforms.
While meta-analyses represent a possible avenue to deal with scattered datasets (Kool et al., 2012; Morgan et al., 2014), a more generic use for such data would instead require them to be merged into one integrated resource, a task that is greatly hampered by batch effects, i.e. study related systematic biases caused for instance by variations in sample handling or profiling platforms (Lazar et al., 2013). To combine transcription data from different batches, several MB related studies have made use of methods to remove or minimize batch effects (Margol et al., 2015; Natarajan et al., 2012; Northcott et al., 2014; Pöschl et al., 2014). However, these efforts were typically conducted on only a few batches each or lacked a thoroughly documented evaluation of batch effects and their removal.
In this study we report the first effort of establishing a large scale resource of MB and cerebellar gene expression data through merging of a majority of the related publicly available datasets and careful inspection and removal of batch effects using the Removal of Unwanted Variation (RUV) algorithm (Gagnon-Bartsch and Speed, 2012; Jacob et al., 2016).
Numerous other tools for the removal of batch-effect have been proposed (e.g. Giordan, 2014; Heider and Alt, 2013; Huang et al., 2012; Johnson et al., 2007; Leek et al., 2012). Among those, ComBat (Johnson et al., 2007) and sva (Leek et al., 2012) represent two of the most widely used approaches for batch correcting. Specifically, in a comparison of different batch-effect removal algorithms, not including RUV, ComBat has been demonstrated to be generally preferrable (Chen et al., 2011). However, algorithms that utilize batches as covariates, such as ComBat and sva, might face problems in distinguishing between batch effects and biological differences, or might artificially increase differences between phenotypes (Nygaard et al., 2016; Parker et al., 2014). In the present study such difficulties can be expected to be particularly distinct, since tumor samples and normal controls are largely separated into individual batches.
Rather than relying on batch covariates, the RUV method (Gagnon-Bartsch and Speed, 2012) can correct for batch effects via Negative Control Genes (NCGs). While likely more suitable for the batch-normalization of the outlined datasets, this technique requires additional knowledge about NCGs, which are expected to exhibit almost constant expression between any of the investigated conditions. House keeping genes were suggested as one potential source of controls (Gagnon-Bartsch and Speed, 2012). However, given that such genes are typically identified as genes with high expression across adult tissues under normal conditions (Eisenberg and Levanon, 2013), they are not generically applicable to MB.
Here, we empirically estimated NCGs from the available MB and cerebellar transcription datasets and we show that the selection of NCGs has a substantial impact on the batch effect removal. Utilizing the RUV method in conjunction with such controls and a thorough strategy for evaluating batch-removal performance, we were able to merge 1641 MB and cerebellar gene expression samples, identify the dominant sources of batch effects and produce a batch-corrected dataset.
2 Implementation and Results
Detailed methods are described in the Supplementary Methods.
2.1 Collection of gene expression datasets
Following an extensive screening of the literature, 1796 MB and normal brain (cerebellar) transcription samples were selected, which were distributed across four platforms (Fig. 1A) and 23 datasets (Fig. 1B). For MB we considered only primary tumor samples, while for the normal controls only samples clearly annotated as cerebellum, cerebellar cortex or upper rhombic lip were included.
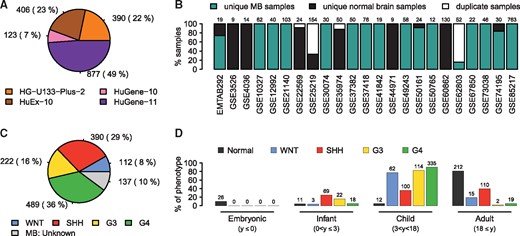
Collection of MB and cerebellar gene expression datasets. (A) Numbers of samples per platform initially selected for merging. (B) Distribution of unique MB and cerebellar patients and duplicate samples across the included studies. The numbers of samples included from each study are shown on top of each bar. (C) The final numbers of unique MB samples per subgroup. (D) Distributions of phenotypes with available information over four age groups based on age in years (): embryonic (), infants (), children () and adults (). The number of samples in each respective category is stated on top of each bar
Accounting for duplicate samples of the same patient in any study (Fig. 1B), the final collection comprised a total of 1641 putatively unique patients (Supplementary Table S1), including 1213 MB cases with available subgroup affiliations and 137 MB cases without (Fig. 1C), and 291 normal brain samples. Patient ages were available for a large portion of the samples and showed the expected distributions for the MB cases (Fig. 1D) (Kool et al., 2012). The age distribution of normal brain samples was not perfectly matched to the MB age range, with many samples from patients in late adulthood, but the datasets also included a number of embryonic and pediatric samples (Fig. 1D).
Upon merging of the datasets (see Supplementary Methods), a single gene expression dataset was obtained, which spanned 14 883 unique genes.
2.2 Subgroup classification of MB samples
Given the number of datasets with diverse sources and the number of samples with lacking subgroup affiliations in the merged data, a classification procedure was implemented in order to investigate supplied class labels and if possible assign class labels to yet unclassified samples.
Specifically, two different classifiers were established, using either the Prediction Analysis for Microarrays (PAM) method available through the R package pamr or an Elastic Net classifier implemented in the glmnet package. The former classifier was applied to a set of 100 genes comprising 25 signature genes for each MB subgroup, which were empirically derived through differential gene expression analyses (Supplementary Fig. S1A, Supplementary Table S2). The latter classifier was applied on all genes, enabling the method to independently derive the classification coefficients (Supplementary Table S3). Upon application to all 1213 samples with supplied MB subgroup affiliation, using leave-one-out classifiers, the PAM classifier correctly classified 1172 samples (), while the ElasticNet classifier performed slightly better with 1183 () correctly predicted samples (Fig. 2A–B). By considering an existing class label to be reliable, if it was reproduced by both classifiers, a total of 1158 samples were classified correctly, while 55 class labels could not be reproduced and the corresponding samples were relabeled as having an unknown subgroup affiliation (Fig. 2C; Supplementary Fig. S2A). The percentage of correctly predicted class labels by the PAM classifier was highly robust over a large range of numbers of signature genes chosen per subgroup (Supplementary Fig. S1B). Indeed, as few as four signature genes appeared sufficient to correctly classify over 85% of the samples in every subgroup (Supplementary Fig. S1B), which is in line with a previous classification effort that reported a classifier comprising a total of 22 genes (Northcott et al., 2012a).
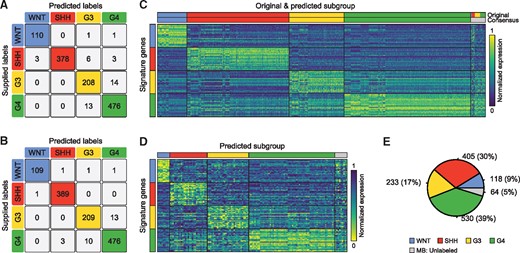
Reclassification of MB samples. (A–B) Confusion matrices depicting the number of correctly and incorrectly predicted class labels by the PAM classifier (A) and the ElasticNet classifier (B). (C) Results of the re-classification of MB samples with supplied subgroup affiliation. The heatmap shows the expression of 100 MB signature genes. (D) Heatmap showing the classification results for samples with previously unknown MB subtype affiliation. (E) Pie chart showing the number of MB subgroup cases after reclassification
After removing the MB subgroup label from samples with unreproducible subgroup affiliation, new PAM and ElasticNet classifiers were trained on the MB samples with retained subgroup labels and applied to the 137 samples (∼10% of all MB samples), for which no subgroup label was originally supplied. 128 of these samples received matching class predictions from both classifiers and were labeled with the corresponding subgroup, while 9 samples could not be robustly classified and were retained without subgroup label (Fig. 2D; Supplementary Fig. S2B). As a result of the relabeling of provided subgroup affiliations and classification of unlabeled samples, the dataset finally comprised a total of 1286 (∼95%) MB samples with subgroup labels and 64 (∼5%) MB samples without (Fig. 2E). Thus, by collecting and comparing the individual datasets, it was possible to re-evaluate existing subgroup affiliations, and the outlined classification strategy was highly successful in predicting robust class labels for samples without available subgroup affiliations.
The majority of incorrect classifications affected G3 and G4 samples, for which some degree of intermixing was expected (Supplementary Fig. S2A–B). In addition, the expression profiles of samples that could not be robustly classified appeared in many cases to correlate with multiple subgroups or lack a high correlation with any particular subgroup, and in some cases also showed an artificially high correlation with normal cerebellar samples (Supplementary Fig. S2C). Many of such samples were interpreted as borderline cases falling in between two or more subgroups (Supplementary Fig. S2D and E).
2.3 Visualization of batch effects
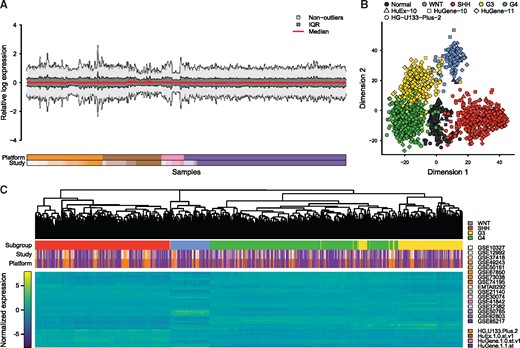
To inspect the existence of batch effects in the merged data, we started with plotting the relative log expression (RLE), which revealed substantial differences between expression distributions (Fig. 3A). Furthermore, an inspection of the multi-dimensional scaling (MDS; Fig. 3B) and hierarchical clustering (HC; Fig. 3C) plots of the data demonstrated that samples clustered on the top level due to platforms, suggesting that differences between platforms presented the major contribution to batch effects observed in the dataset. Within platforms however, samples appeared to cluster predominantly due to phenotype rather than study. Thus, in order to merge the listed datasets, batch-removal would have to predominantly adjust for platform related differences in gene expression profiles.
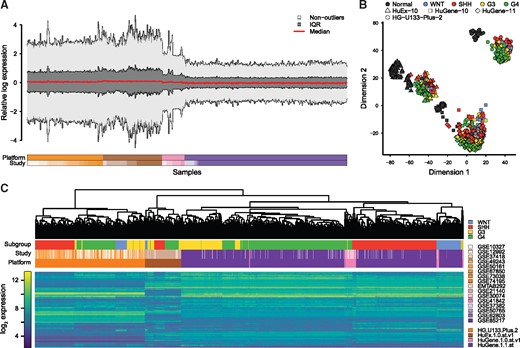
Visualization of batch effects in raw, merged dataset. (A) Modified RLE plot showing the median, interquartile region (IQR), and non-outlier ranges of each sample’s RLE distribution. (B) Scatter plot showing the result of a two-dimensional MDS analysis utilizing the top 1200 most variable genes. (C) Hierarchical clustering of MB samples and the 1200 most variable genes
2.4 Empirical negative control genes
NCGs for normalizing the presented data should exhibit stable expression within each phenotype, between MB subgroups and between MB and cerebellum. To our knowledge, a documented list of such genes does not yet exist. Instead potential NCGs were empirically determined from the collected datasets.
Specifically, to estimate the extent of gene expression variation across the three comparisons, three scores were computed for each gene (Supplementary Fig. S3), based either on the relative mean absolute deviation (RMD) of expression values among samples from the same phenotype, or one-way ANOVA tests to estimate mean expression differences between MB and normal brain or between MB subgroups, respectively. The three scores were ultimately integrated using the mean rank, and the 2.5% (n = 372) top ranking genes were selected as NCGs.
The mean gene expression values of NCGs were distributed across the largest part of the range of observed mean expression values in the merged data (Fig. 4A). Additionally, these genes also spanned a wide range of expression dispersion across all samples as measured by the mean absolute deviation (MAD) (Fig. 4A). Due to the way in which these genes were selected, it was not surprising that there was no significant overlap with published house keeping genes (Fig. 4B). However, a further investigation of the empirically selected NCGs confirmed that they exhibited similar expression levels between phenotypes within individual studies, with generally increased variation between studies and the largest variations observed between platforms (Fig. 4C and D). Together, these results confirmed the previous findings, suggesting that platforms presented the largest contribution to batch effects. Additionally, these results demonstrated the suitability of the selected NCGs for normalizing the data, due to their ability to capture such differences while exhibiting more robust expression levels between phenotypes within platforms.
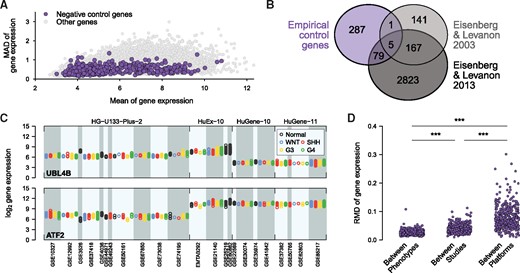
Empirical selection of NCGs. (A) Scatter plot of the mean and mean absolute deviation (MAD) of expression values across all samples for NCGs or all other genes in the dataset. (B) Venn diagram illustrating the overlap of the empirically defined NCGs with published house keeping genes (Eisenberg and Levanon, 2003, 2013). (C) Strip chart showing the gene expression of the NCGs with highest MAD (UBL4B, top panel) and second highest MAD (ATF2, bottom panel). Gene expression levels for samples are shown according to subgroup, study and platform. (D) Strip chart depicting the variation of expression values between phenotypes, between studies, and between platforms for the empirically defined NCGs (one dot per gene and category). For each gene, the variation between phenotypes was calculated within each study as the RMD across phenotype means and the maximum RMD across studies was utilized as the final value. Similarly, the variation between studies was calculated on study means within each platform and the maximum across platforms was recorded. The variation between platforms was calculated as the RMD across platform mean expression values. ***: P < 0.001 (Wilcoxon signed-rank test)
To evaluate the importance of the NCGs for the batch effect correction, we further considered three reference sets of NCGs, i.e. (i) 314 house keeping genes proposed by Eisenberg and Levanon (2003) and retained in the merged data (HKG), (ii) the 372 genes with the lowest expression RMD values calculated across all samples (Ctrl1) and (iii) 372 genes chosen randomly (Ctrl2).
2.5 Batch effect removal
Batch effect correction was performed via the naiveRandRUV method (Jacob et al., 2016), employing the NCGs and a range of combinations of regularization parameters. Selection of a suitable configuration then required the use of a panel of metrics by which the performance of the batch-correction could be evaluated. A multitude of related methods has been proposed during the last years, reviewed for instance in (Lazar et al., 2013). Given the availability of phenotypic affiliations in the present data, particular focus was placed on metrics that evaluate normalization performance based on various aspects of phenotype relationships.
Specifically, beyond the use of the three visual tools described above, six quantitative metrics were utilized as follows. The standard deviation of median RLE values () was used as a quantification of RLE plots. To evaluate the clustering of samples, (i) a k-means clustering was performed, followed by the computation of the Adjusted Rand Index (ARI) in order to estimate the agreement with the optimal clustering, and (ii) the entropy of the order of platform labels in the HC was calculated. A more general quantification of similarities between samples was estimated by calculating ratios of mean Intra- to Inter-Group Distances (IIGD). The mean classification accuracies of classifiers established from merged data was computed on the basis of a support vector machine (SVM) framework. Finally, a differential gene expression analysis was conducted to determine the mean Overlap with Positive control Genes (OPG).
Initial inspection of the metrics between raw and RUV-normalized data suggested an overall improvement of data integration following batch effect removal based on five measures, , IIGD, ARI, Entropy and SVM (Fig. 5A–E). The OPG measure was found less informative for evaluating the batch-correction, as it produced close to maximum scores already in the raw data, with batch normalization only leading to slight absolute improvements (Fig. 5F). Importantly, a comparison between RUV normalizations performed with the empirically defined control genes or performed on the three types of controls revealed a general superiority of the empirical NCGs, as demonstrated by significant improvements for at least four of the measures (IIGD, ARI, SVM, OPG) as compared to each of the other sets of control genes (Fig. 5B, C, E and F).
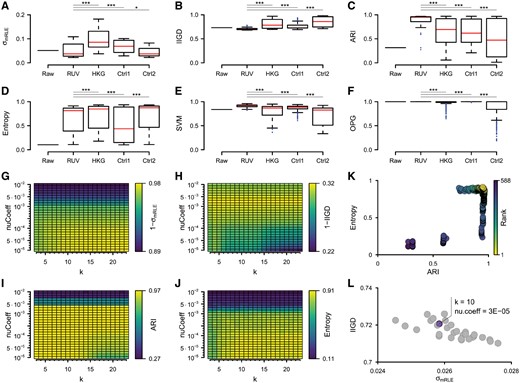
Evaluation of batch effect removal. (A–F) Box plots depicting the distribution of (A), IIGD (B), ARI (C), Entropy (D), SVM (E) and OPG (F) scores obtained from the raw expression data or after batch normalization over a range of regularization parameters and using either empirically defined NCGs (RUV) or three reference sets of control genes (HKG, Ctrl1, Ctrl2). (G–J) Heat maps illustrating the dependence of the (G), IIGD (H), ARI (I) and Entropy (J) scores on the choice of RUV regularization parameters. (K) Scatter plot showing the ranking of promising RUV regularization parameters based on both ARI and Entropy scores. (L) Scatter plot depicting the and IIGD scores for the top 30 RUV settings from (K) and the selection of the final batch-normalized dataset. ***: P < 0.001; *: P < 0.05 (Wilcoxon rank sum test)
A closer inspection of the four evaluation metrics, , IIGD, ARI and Entropy, revealed clear dependencies between the respective scores and the RUV regularization parameters, i.e. the normalization strength (nu.coeff) and number of independent sources of variation () (Fig. 5G–J). To select a putatively best performing batch-corrected dataset, we first ranked RUV setups based on the mean rank of ARI and Entropy measures (Fig. 5K). The 30 top-ranking settings were further evaluated visually and in terms of and (Fig. 5L). The RUV run with and nu.coeff was considered to produce the best batch-corrected data, which was subsequently chosen as the final normalized dataset.
A visual inspection of the respective dataset demonstrated a clear removal of the majority of batch effects observed in the raw data (Fig. 6). Specifically, the normalization diminished the heterogeneous RLE distributions between samples (Fig. 6A). At the same time, two-dimensional or three-dimensional MDS plots (Fig. 6B; Supplementary Fig. S4), PCA plots (Supplementary Fig. S5), and a HC plot (Fig. 6C) revealed a substantial clustering of samples by phenotype rather than platform, with the HC recapitulating the expected organization (Northcott et al., 2011).
Visualization of batch effects in RUV-normalized dataset. (A) Modified RLE plot showing the median, interquartile region (IQR), and non-outlier ranges of each sample’s RLE distribution. (B) Results of a two-dimensional MDS analysis utilizing the top 1200 most variable genes. (C) Hierarchical clustering of MB samples and the 1200 most variable genes
2.6 Validation of the overall strategy on independent training and test datasets
The hitherto described normalization scheme was based on NCGs derived from the same dataset, to which they were then applied in the RUV normalization. Thus, we sought to validate the proposed batch-removal approach also on two independent datasets, i.e. a training dataset used only for NCG extraction and an independent testing dataset, which was then normalized using the identified NCGs. Accordingly, the entire merged dataset (excluding samples with lacking MB subgroup labels) was split into two separate datasets, one comprising 7 studies with 958 samples and one containing 16 studies with 619 samples (Supplementary Table S5), used for training and testing, respectively. A detailed description of the validation experiment is described in the supplementary methods and illustrated in Supplementary Figures S6–S9. Briefly, the training dataset was used to identify NCGs, which were then used to RUV-normalize the testing data, resulting in a successful batch-correction of the dataset and thus confirming the validity of the proposed strategy (Supplementary Fig. S8–S9).
3 Discussion
A large range of omics profiling techniques have become available for the study of MBs, which beyond transcriptional assays also enable investigations of methylation (Danielsson et al., 2015; Schwalbe et al. 2013; Schwalbe et al. 2017; Cavalli et al., 2017; Hovestadt et al., 2014; Northcott et al., 2017), histone modifications (Dubuc et al., 2013; Northcott et al., 2014), copy number aberrations (Northcott et al., 2012b) or mutations (Robinson et al., 2012). These studies can with benefit be combined to obtain a more complete view on the biological foundation of MB, or be utilized individually to address more specific questions. Among the different techniques, transcriptional profiling remains one of the most widely employed methods for functional studies.
Yet, expression datasets of MB and normal brain are largely scattered across various studies and platforms. Thus, it is of crucial importance to understand how these data can be integrated into one comparable resource. By merging a large number of publicly available transcription datasets, we showed that batch-effects, especially between technical platforms, present a major factor interfering with the integration of such data.
Given the distribution of phenotypes across batches, we argued that a batch effect removal strategy based on NCGs was the most feasible way to normalize the dataset. A bottleneck with this technique was the lack of a set of golden standard NCGs. To overcome this problem, we have implemented a novel approach for the empirical estimation of NCGs. Comparing the performances of batch effect removal attempts utilizing either the empirically defined NCGs or other sets of controls, we were able to show that the choice of NCGs has a pronounced effect on normalization and that our empirically defined controls performed generally superior.
Another major obstacle is the question of how to estimate the existence of batch-effects in the data and evaluate the performance of associated normalization approaches. To address this issue, we have investigated a broad panel of visual and quantitative criteria, reflecting either previously described metrics or bespoke methods. Our findings exemplify the notion that the choice of evaluation metrics is perhaps just as crucial as the choice of negative control genes, and that multiple methods need to be combined to address various aspects of data quality affected by batch effects.
4 Conclusions
In summary, we have established the largest publicly available normalized dataset of microarray gene expression covering both MB and normal brain samples. We anticipate that this resource will greatly aid the research community due to the increased sample size and inclusion of normal controls. Furthermore, this study also presents a proof of principle for the presented batch effect normalization strategy. We hope that the outlined approach will provide a useful reference for future normalization efforts in the field of MB or other diseases. Specifically, while the recent years have seen a gradual replacement of gene expression microarrays by RNA-seq profiling, future studies will also be hampered by the low incidence rate of MB, likely leading to the generation of multiple RNA-seq datasets, which once again require sophisticated batch effect normalization strategies.
Funding
This work was generously sponsored by the European Research Council under Horizon 2020 (Project No. 640275, Medulloblastoma—ERC-2014-StG), the Swedish Childhood Cancer Foundation, the Swedish Cancer Society, the Swedish Research Council and the Ragnar Söderberg’s Foundation.
Conflict of Interest: none declared.
References

