


Abstract
Whole exome sequencing (WES) studies for autism spectrum disorder (ASD) could identify only around six dozen risk genes to date because the genetic architecture of the disorder is highly complex. To speed the gene discovery process up, a few network-based ASD gene discovery algorithms were proposed. Although these methods use static gene interaction networks, functional clustering of genes is bound to evolve during neurodevelopment and disruptions are likely to have a cascading effect on the future associations. Thus, approaches that disregard the dynamic nature of neurodevelopment are limited.
Here, we present a spatio-temporal gene discovery algorithm, which leverages information from evolving gene co-expression networks of neurodevelopment. The algorithm solves a prize-collecting Steiner forest-based problem on co-expression networks, adapted to model neurodevelopment and transfer information from precursor neurodevelopmental windows. The decisions made by the algorithm can be traced back, adding interpretability to the results. We apply the algorithm on ASD WES data of 3871 samples and identify risk clusters using BrainSpan co-expression networks of early- and mid-fetal periods. On an independent dataset, we show that incorporation of the temporal dimension increases the predictive power: predicted clusters are hit more and show higher enrichment in ASD-related functions compared with the state-of-the-art.
The code is available at http://ciceklab.cs.bilkent.edu.tr/st-steiner.
Supplementary data are available at Bioinformatics online.
1 Introduction
Autism spectrum disorder (ASD) is a common neurodevelopmental disorder that affects ∼1.5% of the children in the USA (Developmental Disabilities Monitoring Network Surveillance Year 2010 Principal Investigators and Centers for Disease Control and Prevention (CDC), 2014). Recent whole exome sequencing (WES) efforts have paved the way for the identification of dozens of ASD-risk genes (De Rubeis et al., 2014; Iossifov et al., 2012,, 2014; Neale et al., 2012; O’Roak et al., 2012; Sanders et al., 2012,, 2015). Unfortunately, this number corresponds to only a small portion of the large genetic puzzle, which is expected to contain around a thousand genes (He et al., 2013). Detection of de novo loss-of-function (dnLoF) mutations has been the key for gene discovery due to their high signal-to-noise ratio. However, such mutations are rare and they affect a diverse set of genes. Thus, for most of the genes, the rarity and diversity of variants prevent statistically significant signals from being observed. Therefore, despite analyzing thousands of trios, our yield of discovered genes is still low. The journey toward getting the full picture of the genetic architecture will take a long time and will be financially costly.
Several statistical gene scoring methods have been developed for disease risk prioritization. TADA quantifies the excess variation signal by integrating information from de novo and transmitted variation as well as information from case–control studies (He et al., 2013; Sanders et al., 2015). D-Score uses gene expression signals from cell-type specific gene expression in mouse brain to pinpoint dnLoF mutations confer disease risk and improve specificity (Zhang and Shen, 2017). Finally, Krishnan et al. (2016) uses well-established ASD genes and their interaction patterns to train a classifier to predict new susceptibility genes that follow a similar pattern. Such scoring methods have enabled guilt-by-association-based gene discovery techniques to further search for connected components on functional gene interaction networks. These methods assume ASD-risk genes are working as a functional cluster. Starting from already known risk genes, these techniques predict a cluster of closely interacting genes. There are only a few network-based ASD-tailored gene discovery algorithms in the literature: NETBAG (Gilman et al., 2011, 2012), DAWN (Liu et al., 2014, 2015) and MAGI (Hormozdiari et al., 2015). Despite having fundamental differences in their approaches, all of these methods have one point in common: the biological gene interaction networks that they use are static.
NETBAG constructs an integrated network through a comprehensive analysis of many annotation resources (e.g. Gene Ontology (GO), protein domains), and numerous available interaction networks (e.g. Protein Protein Interaction (PPIs), KEGG pathways). On the network, the method assigns each gene pair an interaction score that signifies the likelihood of those genes participating in a genetic phenotype. Then, by following a greedy seed-and-extend procedure, it generates many clusters of genes and returns the cluster with the maximal score that is significant with respect to a permutation test. MAGI uses two PPIs: STRING (Szklarczyk et al., 2010) and HPRD (Keshava Prasad et al., 2008). It also makes use of the co-expression network generated by using full (all brain regions and neurodevelopmental periods) data from the BrainSpan dataset (Sunkin et al., 2012). MAGI follows a seed-and-extend-based approach similar to NETBAG to generate seed pathways that are enriched with dnLoFs in cases, compared with controls. Then, it merges the pathways as long as the cluster score is improved. DAWN estimates partial co-expression networks using BrainSpan, but for only small windows of the neurodevelopment that are indicated as hotspots for ASD (Willsey et al., 2013). Unlike NETBAG and MAGI, which use phenotype-neutral networks, DAWN’s approach favors links to already known ASD genes. It predicts ASD genes by assigning a posterior risk score to each gene based on its interactions with other genes, using a hidden Markov random field-based approach. We also would like to mention the method by Krishnan et al. (2016), which uses a data-driven tissue-specific network, where thousands of experiments from the literature are integrated in a Bayesian framework (Greene et al., 2015). Instead of predicting a module like the other described methods, this method uses the known ASD genes and their connectivity patterns as features to train an Support Vector Machine (SVM) classifier, and then assign every gene a probability of being associated with ASD.
Clearly, none of the above-mentioned methods consider the fact that gene interactions (co-expressions) evolve over time. It is demonstrated that different neurodevelopmental spatio-temporal windows have different topologies and consequently, the clustering of ASD susceptibility genes changes drastically (Willsey et al., 2013). Moreover, dysregulation of pathways in earlier periods has cascading effects on the circuitry of the future time periods. For instance, Belinson et al. (2016) show that abnormalities in β-catenin/BRN2/TBR2 transcriptional cascade during embryonic brain development affects production of deep layer projection neurons, which leads to abnormal brain structures and autism-like behavioral abnormalities during adulthood. Hence, we argue that the state-of-the-art methods are limited in predictive power, since static networks they use would fail to capture the dynamic nature of neurodevelopment.
In this article, we propose a novel ASD gene discovery algorithm termed ST-Steiner. The algorithm modifies the prize-collecting Steiner forest (PCSF) problem and extends it to spatio-temporal networks in order to mimic neurodevelopment. Instead of performing gene discovery on a single network or any number of networks separately, ST-Steiner solves an optimization problem progressively over a cascade of spatio-temporal networks while leveraging information coming from earlier neurodevelopmental periods. The algorithm has three novel aspects: (i) for the first time, the problem is solved on a cascade spatio-temporal co-expression networks so that the dynamic nature of neurodevelopment is taken into account; (ii) the results are more interpretable compared with other methods in the literature, since the decisions made by the algorithm can be traced back on the spatio-temporal cascade; (iii) as the problem is formulated as a PCSF prediction problem, the algorithm predicts only the genes that are essential for the connectivity of known risk genes. Note that this is in contrast to the other approaches which can return redundant paths between known risk genes.
We apply the algorithm on exome sequencing data from De Rubeis et al. (2014) and identify gene clusters using two gene co-expression network cascades of early- and mid-fetal periods. Incorporation of the information from the early-fetal period enables ST-Steiner to predict genes that were not captured by other methods due to the limitation of their static networks. ST-Steiner predicts genes that are related to kinesins (i.e. KIF23 and 4 others) and kinetochore-microtubule attachment processes (NDC80, SGOL2). These two functions work closely for chromosome alignment during mitosis but has very subtle ties to ASD in the literature.
For the first time, we benchmark the performances of the network-based ASD gene discovery algorithms on common training data. We validate the predicted clusters with independent exome sequencing data and find that ST-Steiner’s predictions (i) more favorable with respect to a precision–recall scan when compared with the state-of-the-art methods; (ii) overlap more with targets of known ASD-related transcription factors and (iii) enriched more in ASD-related KEGG pathways. We also show in various controlled settings that using temporal information boosts the predictive power, which supports our claim that the clustering of risk genes is spatio-temporal.
2 Materials and methods
2.1 Overview and background of ST-Steiner
The method we propose to remedy the problems posed by using static networks is built on prize-collecting Steiner tree (PCST) problem. The goal is to find a tree that maximizes the sum of the prizes of the selected nodes while penalizing the total cost of the connecting edges. PCSF problem is a relaxation of PCST such that multiple disconnected components (trees) are allowed. In the biology domain, PCSF has been used to identify multiple independent signaling pathways on a single network (Tuncbag et al., 2013). Later, PCSF is extended to predict a single tree shared among multiple samples (networks with identical topology) with different mutation profiles (different seed genes) (Gitter et al., 2014).
ST-Steiner, selection of similar genes across multiple networks is rewarded in a similar manner to Gitter et al. (2014). However, in contrast, (i) ST-Steiner works with networks of different topologies; (ii) networks are organized in a temporal hierarchy; (iii) reward mechanism is weighted by the prize of a node and only affects networks of future time windows; (iv) networks represent spatio-temporal windows in brain development rather than samples with different mutation profiles; (v) multiple brain regions in the same time window can be simultaneously analyzed without constraining to be similar to each other, where all selected genes in a given time frame can be assigned an additional prize in the analysis of the next time frame.
A motivating toy example for ST-Steiner and it’s decision-making process is illustrated in Figure 1. Consider the co-expression network of spatio-temporal window 1. By solving PCSF on this network, the known risk genes (black) are minimally connected by selecting a set of genes (red-bordered). This selection affects which genes will be chosen on the co-expression network of spatio-temporal window 2. Assume genes X, Y and Z are equally likely to be selected (equal prizes and related edge costs) to connect the seed genes. Then, the algorithm prefers gene X, because it is selected in the earlier period and its prize is increased. Next, we formally define PCST, PCSF and then ST-Steiner.
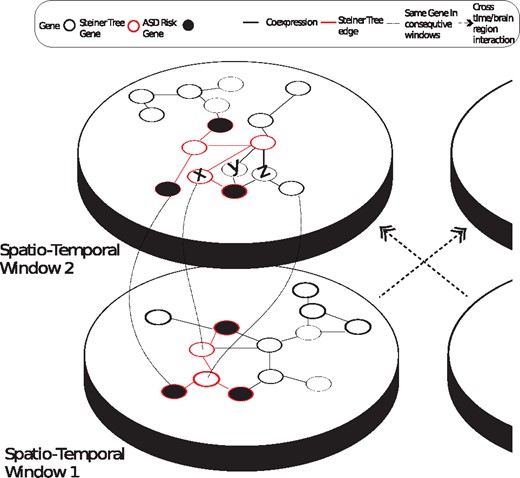
Two spatio-temporal windows (plates) and respective co-expression networks along with a parallel brain region and its plates (partially shown, on the right). Circles represent genes and black edges represent pairs of genes that are co-expressed. Red-bordered nodes form the Steiner tree found on plate 1 (linked with red edges), which minimally connects black seed genes. In ST-Steiner, genes that are selected in Plate 1 are more likely to be selected in Plate 2. Curved lines between windows show the mapping of selected genes from Plate 1 to Plate 2. On the second plate ST-Steiner can pick X, Y or Z to connect the seed genes. Assuming that they all have identical priors and identical edge costs, the algorithm would pick X, because it is selected in the prior window and its prize is increased. If other brain regions in the first temporal window are also considered, then selected genes in those regions would also be used (from the plate on the right)
2.2 PCST problem
2.3 PCSF problem
2.4 Spatio-temporal PCSF problem (ST-Steiner)
In order to model the spatio-temporal dynamics of neurodevelopment, we consider a spatio-temporal system G=G1, G2, …, GT, a list of T consecutive time windows.
The ith time window is a set of spatio-temporal networks, with a cardinality of n. The network (with node prize function and edge cost function ), captures the topological state of the system G for the jth spatial region in the ith temporal window. In the context of spatio-temporal gene discovery for ASD, the network represents the co-expression of genes during human brain development at the jth brain region cluster out of n regions in total during the ith time interval , where is the granularity parameter.
2.5 Datasets and generation of the spatio-temporal networks
In order to model neurodevelopment, we use the BrainSpan microarray dataset of the Allen Brain Atlas (Sunkin et al., 2012) and generate a spatio-temporal system (cascade) of co-expression networks. To partition the dataset into developmental periods and clusters of brain regions, we follow the practice in Willsey et al. (2013) as described next.
Brain regions are clustered according to their similarity and four clusters are obtained: (i) V1C (primary visual cortex and superior temporal cortex) (ii) PFC (prefrontal cortex and primary motor-somatosensory cortex), (iii) SHA (striatum, hippocampal anlage/hippocampus and amygdala) and (iv) MDCBC (mediodorsal nucleus of the thalamus and cerebellar cortex). The time windows which are associated with these brain regions: 1–3 which corresponds to early-fetal period, 3–5 and 4–6 which correspond to mid-fetal periods (τ = 2). Note that these time windows represent early-neurodevelopment, which is an important stage for ASD. Each graph is a spatio-temporal co-expression network, where i denotes one of the time intervals and j denotes one of the four brain region clusters. In this work, a spatio-temporal window of neurodevelopment and its corresponding co-expression network is denoted by the abbreviation for its brain region cluster followed by the time window of interest, e.g. ‘’ represents the region PFC at the specific time interval 1–3.
We report our results on the following spatio-temporal cascades: (i) , as the precursor network for , (ii) , as precursor network for , (iii) all spatial regions in time window 1–3 as precursor networks for , and (iv) all spatial regions in time window 1–3 as precursor networks for . The target networks of interest, and , are suggested as hotspots for ASD risk (Willsey et al., 2013). Furthermore, these are also the subject matter of DAWN (Liu et al., 2015), which allows us to directly compare our results to theirs.
An edge between two nodes is created if their absolute Pearson correlation coefficient is in the related portion of BrainSpan data. This threshold has also been used in the literature (Liu et al., 2014, 2015; Willsey et al., 2013). Each edge between a pair of genes is assigned a cost of . We set node (gene) prizes to the negative natural logarithm of the TADA q-values. Thus, in all experiments, the prize function is identical for all networks. We obtain TADA q-values on ASC WES cohort, which is reported on 17 sample sets consisting of 16, 098 DNA samples, 3, 871 ASD cases and also 9, 937 ancestry-matched/parental controls (De Rubeis et al., 2014).
3 Results
3.1 Comparison with the state-of-the-art methods
We compare the performance of ST-Steiner with three state-of-the-art network-based ASD gene discovery algorithms which predict a module of ASD genes: NETBAG (Gilman et al., 2011, 2012), DAWN (Liu et al., 2014, 2015) and MAGI (Hormozdiari et al., 2015). Input parameters and implementation details for all methods are given in Supplementary Text 1.2.
3.1.1 Input training data
The data from the ASC WES cohort from De Rubeis et al. (2014) are inputs to all three methods. ST-Steiner makes use of TADA values. NETBAG utilizes a list of genetic events: we treated each gene with one or more dnLoF as if it was hit by a separate event targeting that gene only. DAWN uses z-score transformed TADA P-values, and ST-Steiner uses TADA q-values. MAGI, by design, uses de novo mutation counts. In addition, MAGI uses a control cohort: we use the control data reported in and made available with their paper (https://eichlerlab.gs.washington.edu/MAGI/).
3.1.2 Input networks
ST-Steiner uses the two cascades that are explained in Section 2.5. For the other three methods, the suggested networks in the corresponding papers are used. NETBAG is run with the likelihood-of-interaction-in-a-phenotype network it generates, as explained in Gilman et al. (2011). DAWN uses the PFC(3–5) and PFC(4–6) partial co-expression networks obtained from BrainSpan, as reported in (Liu et al., 2015). MAGI is run using the STRING (Szklarczyk et al., 2010) and HPRD (Keshava Prasad et al., 2008) PPI networks and the full co-expression network obtained from the BrainSpan dataset (Sunkin et al., 2012).
3.1.3 Validation of the predicted networks
A dnLoF mutation has a very high signal-to-noise ratio, and the genes that are hit are considered to be high risk genes. In this experiment, we validate the predicted gene networks of each method, using the autism-associated dnLoFs obtained from denovo-db [Seattle, WA, USA, denovo-db.gs.washington.edu (October 2018)] that contains all such mutations published in the literature. We remove all probands used in De Rubeis et al. from the validation set to obtain 493 genes with at least one dnLoF mutation (dubbed validated genes). Since the two cohorts are completely independent, this is a powerful validation experiment and constitutes a benchmark for all methods. In order to prune possible false positives, we further removed the genes that has a de novo LoF mutation in siblings in the Simons Simplex Collection (SSC) cohort, and genes with pLI <0.9, to obtain the final set of 200 genes. Note that we are comparing all methods when they are provided with identical training data in terms of dnLoF mutations (of ASC WES cohort): in this sense, this work is the first benchmark of the state-of-the-art network-based ASD gene discovery algorithms when the training data are kept the same.
Since all methods have various parameters that adjust their decisions, we compare the algorithms in a precision–recall curve as shown in Figure 2. For ST-Steiner, the results obtained on networks from 1 to 3 period are kept unchanged and resulting trees on PFC(3–5) and PFC(4–6) are obtained by varying β and λ; for DAWN, the False Discovery Rate (FDR) threshold is varied to obtain resulting networks of different sizes; for NETBAG, the most significant network produced for each cluster size is plotted; for MAGI, the control/ESP cutoff has been relaxed and variations are plotted.
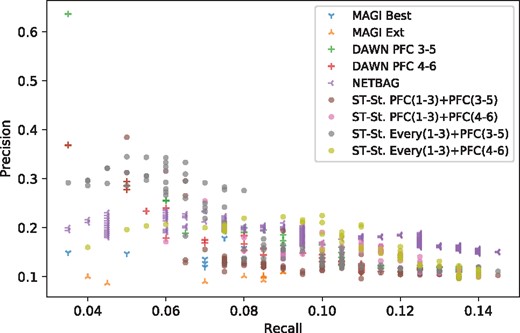
Precision–recall curve for all benchmarked methods when their parameters/thresholds are varied. The ground truth set contains 200 genes which have at least one de novo LoF mutation in denovo-db after removing (i) the probands included in De Rubeis et al. (2014), (ii) genes with de novo LoF mutations in SSC siblings, and (iii) removing genes with pLI<0.9
One would like to see their method balance precision and recall (middle region) and dominate other methods’ points. Results show that ST-Steiner (brown and purple dots) provides a nice balance between the two metrics and mostly dominate a very large portion of the covered range (recall ∼[0.025–0.07], precision ∼[0.2, 0.33]). DAWN is the closest to ST-Steiner.
ST-Steiner’s success can be attributed to both (i) using the cascaded information coming from a preceding neurodevelopmental window and (ii) ST-Steiner predicting a tree (rather than a forest), which only includes high prize low-cost genes that are essential for connectivity. Also, we explore other ways of utilizing the time dimension in detail in Supplementary Text 1.4 and show that ST-Steiner’s approach is the most effective way.
Aside from the state-of-the-art methods described above, we also compare the same predictions of ST-Steiner with other predicted ASD-risk gene modules from the literature: NETBAG (Gilman et al., 2011), AXAS (Cristino et al., 2014), and co-expression-based modules from Willsey et al. (2013) and Parikshak et al. (2013). As done in Hormozdiari et al. (2015), we take their outputs as is for these comparisons. Results are given in Supplementary Table S10. We note that none of the predicted modules get close to the precision of ST-Steiner.
Supplementary Text 1.6, we also compare ST-Steiner with the state-of-the-art methods on gene sets that are not ground truth, but deemed as enriched in ASD-risk genes: SFARI CATI and CATII gene sets, FMRP targets, RBFOX targets, WNT pathway genes, Histone modifier genes and Synaptic genes. Furthermore, a GO term enrichment and Kyoto Encyclopedia of Genes and Genomes (KEGG) pathway enrichment comparison is provided in Supplementary Text 1.7.
3.2 Spatio-temporal information promotes selecting validated genes
To see if information coming from a precursor improves the performance, we compare ST-St. PFC(1–3)+(3–5) and with ST-Steiner results only on and PFC(4–6), respectively. For this purpose, we obtain ST-St. PFC(3–5) and ST-St. PFC(4–6) independently, with no time effect (λ=0, ρ =0, β is selected such that ). We use the same input data and parameters as described in Section 3.1. The former identifies 20 validated genes by making 211 predictions (p=8.272e−12), while identifies 21 validated genes by choosing 234 genes (p=7.0e−12). identifies 18 validated genes by predicting 235 genes (p=3.018e−9), whereas identifies 19 validated genes by predicting 256 (p=1.836e−9). The increase in the number of validated genes demonstrate that ST-Steiner can leverage temporal information.
Due to ρ, the network size is increased to include more genes by considering the time dimension (i.e. if network is 10% larger compared with using a static network—see Supplementary Text 1.1 for details on selecting parameters). Therefore, the above comparison is slightly unfair. What we want is to see if the leveraged information comes just from network getting bigger or is due to the incorporated spatio-temporal information. To investigate this, we obtain two additional results: ST-St. PFC(3–5)+10% and ST-St. PFC(4–6)+10%. With these results, we are investigating if the algorithm would be as successful by just adding 10% more genes to PFC(3–5) and to PFC(4–6) without any spatio-temporal analysis. We use the following parameters: λ = 0, β is selected such that they have comparable sizes to PFC(1–3)+(3–5) and PFC(1–3)+(4–6), respectively. ST-St. PFC(3–5)+10% and ST-St. PFC(4–6)+10% contain 230 and 266 genes and identify 20 and 19 validated genes, respectively. These numbers are less significant compared with PFC(1–3)+(3–5) and PFC(1–3)+(4–6) despite having similar sizes. This suggests that the spatio-temporal prize mechanism successfully promotes selecting ASD-related genes.
We also perform a robustness analysis similar to the one in Liu et al. (2014). That is, we remove the genetic signal from 1/30 randomly selected genes and rerun ST-Steiner. This is repeated 30 times for each fold to see how frequently each gene is selected. The visualization of ST-St. PFC(1–3)+(3–5) in comparison to is illustrated in Figure 3 along with these robustness values. See Supplementary Figure S1 for a similar comparison of and PFC(4–6)+10%. We provide a detailed investigation of alternative uses of spatio-temporal information and effect of parameter selection in Supplementary Text 1.4.
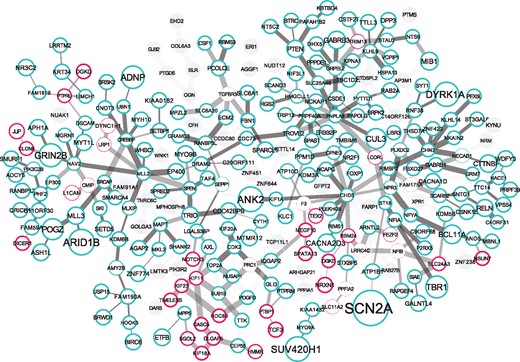
Image visualizes ST-St. PFC(1–3)+(3–5) network which is laid over ST-St. PFC(3–5)+10%. Turquoise bordered genes are common in and . Pink bordered genes are only in ST-St. PFC(1–3)+(3–5), highlighting the effect of using the temporal dimension and information coming from PFC(1–3). Gray genes are present only in PFC(3–5)+10% and are not included by ST-St. PFC(1–3)+(3–5). Size of a node indicates its significance w.r.t. its TADA q-value in De Rubeis et al. (2014) (the larger, the more significant). The thickness of the border of a node indicates its robustness. The thickness of an edges represents the correlation coefficient between the gene pair (the thicker, the higher). Visualized using the CoSE layout (Dogrusoz et al., 2009) in Cytoscape (Shannon et al., 2003)
3.3 Biological insights from ST-Steiner’s predictions
3.3.1 ST-Steiner predicts new ASD-risk genes related to motor activity over microtubules
We investigated the biological meaning of the genes predicted by ST-Steiner. We performed a GO analysis and found strong enrichment for the following top two biological process terms: mitotic sister chromatid segregation (adjusted P-value: 0.0009), regulation of cytokinesis (adjusted P-value: 0.002). These are followed by positive regulation of excitatory postsynaptic potential (adjusted P-value: 0.002), Notch signaling pathway (adjusted P-value: 0.002). Notch signaling pathway and excitatory postsynaptic potential (hence, synaptic transmission) are well known disrupted circuitries in ASD etiology (Cau and Blader, 2009; De Rubeis et al., 2014). However, cytokinesis and chromatid segregation are less pronounced in the ASD literature. The genes associated with these two GO terms are BIRC6, CUL3, DLGAP5, KIF18A, KIF20A, KIF23, KLHL9, NCAPG, NDC80, NUSAP1, POGZ, PRC1, PRPF40A and SPAST. Among these 14 genes, only 5 (BIRC6, CUL3, POGZ, PRPF40A and SPAST) have de novo LoF mutations in De Rubeis et al. (2014), which shows relatively low prior association. Despite not annotated, ST-Steiner detects 2 other KIF genes: KIF1A and KIF11. Note that TADA q-values are available only for 6 KIF genes and ST-Steiner selects 5 of them. Investigating the top GO molecular function terms also shows that motor activity and microtubule motor activity are ranked first and third (adjusted P-values: 0.002 and 0.03, respectively). These terms capture all five KIF genes predicted by ST-Steiner. In addition, an enrichment test on MSigDB pathways shows that the Reactome Kinesin pathway has the most significant overlap with the genes detected by ST-Steiner (5/24, P-value = ). Kinesins are known to transport cargo to dendritic spines undergoing synaptic plasticity over microtubules (McVicker et al., 2016). They also play a role in organization of spindle microtubules during mitosis (Ems-McClung and Walczak, 2010). In summary, the algorithm returns a coherently co-expressed functional cluster of genes related to kinesins and their activity on microtubules during cell division and it predicts that the disruption of this circuitry is potentially related to ASD risk.
3.3.2 ST-Steiner predicts new genes with temporal information
Next, we investigate the genes whose prediction is enabled by the use of temporal information. That is, we evaluate only genes that are included both in and ST-St. PFC(1–3)+(4–6), but excluded from or PFC(4–6)+10%. Here, focus on novel predictions, only. There are nine such genes and we focus on the six that are detected neither by DAWN nor by MAGI. Furthermore, these genes are not pointed out in WES studies: they all have low scores in TADA, and ranked at most as Category 4 in SFARI gene which stands for ‘minimal evidence’, if included at all. Among these six genes, we did not find any evidence of association with ASD for the following ones: KIF23, NDC80 and SGOL2. Interestingly, NDC80 and SGOL2 also take part in kinetochore-microtubule attachment during cell division. These two genes and five KIF genes closely interact in Figure 3 and form a module of their own. We checked if a similar module exists on an orthogonal source of interaction information such as PPI. Using InWeb-InBiomap tool (Li et al., 2017), we found a striking motif in the PPI network of the predicted genes by ST-Steiner. The only clique with more than three genes was formed by BUB1B, CASC5, KIF18A, NDC80 and SGOL2. BUB1B is localized to the kinetochore and performs spindle checkpoint function. CASC5 links BUB1B to kinetochore and performs spindle assembly checkpoint signaling for chromosome alignment during cell division. These results further support our findings in Section 3.3.1.
Among the above-mentioned six genes, the following genes have subtle clues in the literature. MEGF10 is also related to cell proliferation and adhesion, and recently variants in its regulatory region have tied it to ASD (Wu et al., 2017). The fifth gene is CMIP, which is a signaling protein previously associated with language delay and whose truncation is found to be related to cytoskeleton reorganization (Grimbert et al., 2003). There are two studies (one very recent) indicating haploinsufficiency of CMIP leads to ASD (Luo et al., 2017; Van der Aa et al., 2012). Selection of CMIP in ST-St. PFC(1–3) + (3–5) enables inclusion of another gene L1CAM with a link to CMIP, which is related to neurite outgrowth and cell migration. The final gene, which is time induced (ironically), is TIMELESS. It is related to circadian rhythm, and it is also linked to ASD before in a study (Yang et al., 2016).
3.3.3 Synaptic and chromatin genes form distinct modules
Here, we analyze how genes representing some well-known and predicted biological processes are laid out on the subnetwork shown in Section 3. Supplementary Figure S6 shows how synaptic genes (green), chromatin modeling genes (blue) and cytoskeleton-related genes (pink) are organized within the topology of the predicted Steiner tree. The list of synaptic genes is obtained from Genes to Cognition (http://www.genes2cognition.org/). We use lists L09–L16, which include the human orthologues of various synaptic complexes in mouse. The list of chromatin modifiers is obtained from Khare et al. (2012) and Huang et al. (2013). List of cytoskeleton-related genes is obtained by a manual search on GeneCards (Stelzer et al., 2016).
Despite being two of the major affected circuitries in ASD etiology, it was reported in literature that synaptic and chromatin genes are not interacting and form separate groups on protein interaction networks (De Rubeis et al., 2014; Sanders et al., 2015). We confirm this finding in our results which is based on a gene co-expression network. We observe six interactions between these two groups, which is much lower than expected (expected: 8.93, P-value: 0.777, 1000 random draws for two distinct gene sets of respective sizes on this subnetwork). On the contrary, synaptic genes and chromatin genes are tightly interacting within their modules (number of connections: 12 and 10; expected: 4.24 and 4.45; P-values: 0.004 and <0.001, respectively). This result may indicate two functionalities. We observe that cytoskeleton genes are almost uniformly distributed interacting and even overlapping with synaptic and chromatin genes.
3.3.4 ST-Steiner provides interpretable predictions
Here, we focus on genes that are relatively more established in literature compared with the genes in the previous subsection. However, them not being selected by ST-Steiner without the time information allows us to traceback the information and show that ST-Steiner is able to also return more interpretable results.
The first two genes are NOTCH2 and NOTCH3, membrane receptors of NOTCH signaling pathway. The former gene is selected in both and , the latter is selected in . This pathway is important for neuron differentiation (Cau and Blader, 2009). More importantly, it is active during embryogenesis (time-point 1) (Wolter, 2013). Thus, its disruption is expected to have a cascaded effect during time window 3–5. Another gene that is retained is TCF3, which has been highlighted in De Rubeis et al. (2014) as one of the few hub transcription factors to regulate many ASD-risk genes along with many histone modifiers. Similar to NOTCH signaling pathway, which regulates neuron differentiation, TCF3 is found to promote differentiation in embryonic stem cells (Merrill et al., 2001; Nguyen et al., 2006). More importantly, it represses neuron differentiation in neural precursor cells (Kuwahara et al., 2014; Ohtsuka et al., 2011), which again corresponds to the time window 1–3. Thus, in line with our hypothesis that clustering of genes is spatio-temporal, ST-Steiner predicts these genes by considering the effect of the earlier time window. This also means that one can trace back the information source which enables the selection of these genes. This adds further interpretability to our results.
3.4 ST-Steiner is not specific to ASD: epilepsy analysis
ST-Steiner can work with any disorder with a progression model and corresponding cascade of ‘gene-interaction’ networks. One such disorder is epilepsy, which was shown to might have its genetic roots during embryogenesis (Vadlamudi et al., 2010) and could be progressive (Pitkänen and Sutula, 2002). It is also known to be comorbid to ASD (Jeste and Tuchman, 2015). We analyze the epilepsy WES data of 356 trios and corresponding extTADA (an extension of the TADA method) results provided in Nguyen et al. (2017). We use the PFC(1–3) + (3–5) cascade as frontal lobe epilepsy is one of the most prominent types and the disorder and prenatal period is known to be a factor in the future phenotype (Scher, 2003). This cascade also enables us to compare the results of ASD and epilepsy analyses. Details about the analysis are given in Supplementary Text 1.8 and the resulting network is shown in Supplementary Figure S7. As expected ST-Steiner picks up a very different subnetwork compared the ASD results despite using the same underlying network. We find that the predicted cluster is mostly enriched in genes related to GABA receptor activity, which has a well-established tie to epilepsy (Treiman, 2001). The next enriched term is ‘myosin V binding’ and the related genes RAB27B and RAB6B have very low TADA priors (q = 0.98). There are not many associations of myosins to epilepsy in the literature. One rare example is Mercer et al. (1991) in which a mutation in MYO5A causes epileptic phenotype in a mouse model (Pitkänen et al., 2017). Note that MYO5A is also detected by ST-Steiner despite its low prior (q = 0.55). Despite the direct link between myosins and epilepsy is blurred, myosin Vb was shown to mediate glutamate receptor subunits in developing neurons (Lisé et al., 2006). As glutamatergic signaling is a key pathway that is denoted as a potential therapeutic target for epilepsy (Barker-Haliski and White, 2015), myosins could as well have a role in this disorder, as suggested by ST-Steiner.
4 Discussion and conclusion
ASD is a common neurodevelopmental disorder which is a life-long challenge for many families all around the world. Gaining an understanding of the cause of ASD and opening a way to the development of new treatments would certainly have a major impact on the lives of many. Even though we have long ways to go to understand the etiology of the disorder, network-based gene discovery algorithms have proven useful for gene discovery. In this work, we propose a novel ASD gene discovery algorithm that for the first time models the cascading effect of disrupted functional circuits in neurodevelopment.
We show that ST-Steiner achieves a good balance between precision and recall. While other methods output a graph of genes, ST-Steiner outputs a tree/forest. That is, no multiple paths exist between any pair of genes and some genes can be left out if they are not essential for connectivity due to having low prior risk or high-cost edges. Precision is also achieved via rewarding selected genes from earlier periods, which makes the algorithm more confident on the predictions it makes. We show that once the temporal information is employed, predictive power increases, which supports our hypothesis that the clustering of genes is spatio-temporal rather than static.
We also think there is still room for improvement in ST-Steiner’s formulation. Considering that PPI networks give MAGI an orthogonal source of information, one future extension direction would be the incorporation of information from this source. Note that the goal of this paper is to show that the clustering of ASD genes are dynamic rather than static. This is the reason why we do not consider PPIs, but restrict the problem definition and our tests to observe the cascaded effects of dysregulation in earlier time windows.
Acknowledgements
We thank Fereydoun Hormozdiari and Li Liu for help with their methods; Oznur Tastan and Serhan Yilmaz for their feedback on the design of ST-Steiner, Kerem Ayoz and Oguzhan Karakahya with the help on testing the program and Lambertus Klei for the help on processing BrainSpan data.
Funding
This work was supported by a grant from the Simons Foundation (SFARI 416835, AEC).
Conflict of Interest: none declared.
References
Developmental Disabilities Monitoring Network Surveillance Year 2010 Principal Investigators;Centers for Disease Control and Prevention (CDC).

