


Abstract
We present the first tool for unbiased quality control of top-down proteomics datasets. Our tool can select high-quality top-down proteomics spectra, serve as a gateway for building top-down spectral libraries and, ultimately, improve identification rates.
We demonstrate that a twofold rate increase for two E. coli top-down proteomics datasets may be achievable.
http://patternlabforproteomics.org/tdgc, freely available for academic use.
Supplementary data are available at Bioinformatics online.
1 Introduction
The two major data generation approaches for proteomics are bottom-up (BUP) and top-down (TDP). In BUP, a complex protein mixture is digested and peptide sequences can be identified after a chromatographic separation coupled online with tandem mass spectrometry. TDP skips the digestion step, in an ambitious attempt to characterize the intact proteins (proteoforms) present in the mixture.
In a typical BUP experiment, about 75% of all mass spectra remain unidentified (Griss et al., 2016). Various groups have therefore developed unbiased quality control (QC) filters to single out high-quality mass spectra before the database search. For example, Na and Paek developed the cumulative spectral peak intensity (Xrea) QC (Na and Paek, 2006). More recently, Silva et al. introduced the balance QC, which uses machine learning to assess the distribution of spectral-peak intensities of tandem mass spectra originating from HCD (Higher energy collision dissociation) of 2+ and 3+ peptides (Silva et al., 2017).
For the fragmentation of intact proteins, electron transfer dissociation (ETD) based fragmentation (including EThcD) has been shown to lead to high sequence coverages and is therefore often used in TDP (Brunner et al., 2015). In these approaches, high-intensity ions arising from the charge reduction of precursor ions are often observed and largely alter the general spectral peak-intensity pattern, rendering existing BUP QC tools useless. Here, we present TDGC (Top-Down Garbage Collector), the first unbiased automatic QC filter for TDP. We show that, for our datasets, almost twice as many quality spectra leading to identification are retained as well as other high-quality, potentially informative spectra.
2 Materials and methods
Two E.coli lysates were analyzed using LC-MS/MS on an Orbitrap Fusion Lumos® mass spectrometer with EThcD fragmentation, as described in Supplementary Material. From the resulting datasets we manually selected 100 (very) good and 100 (very) poor spectra without any prior knowledge regarding identification, seeking mainly well-defined isotopic envelopes and high signal-to-noise ratios. These spectra were then input to TDGC’s learning algorithm. For each spectrum, this algorithm first uses Y.A.D.A. Carvalho et al. (2009) to count the isotopic envelopes of fragment ions with a charge state greater than 1+ and less than 8+ (Feature 1). Then it bins the spectrum’s peak intensities (bin size = 25 m/z) over the 500–1500 m/z range, assigning to the kth of the 40 bins the sum of the corresponding peak intensities. These sums lead to the log-ratio vector , which is then sorted in a nonincreasing order. The algorithm’s second feature consists in computing the Mahalanobis distance of this vector to the distribution of sorted log-ratio vectors of the good spectra. The overall rationale is that high-quality spectra should have more isotopic envelopes than spectra of low quality (for Feature 1) and that noisy spectra should generate log-ratio vectors of lower Mahalanobis distances to the uniform distribution than to the distribution of good spectra. Finally, the numbers of isotopic envelopes and the Mahalanobis distances are used to train a Bayesian classifier.
3 Results
Note first that, while comparing the good spectra to the poor ones in the training set, a different pattern clearly emerges regarding their log-ratio vector profiles. Similarly, the number of isotopic envelopes and the Mahalanobis distance are distributed very differently for good and poor spectra. This is shown in Figure 1.
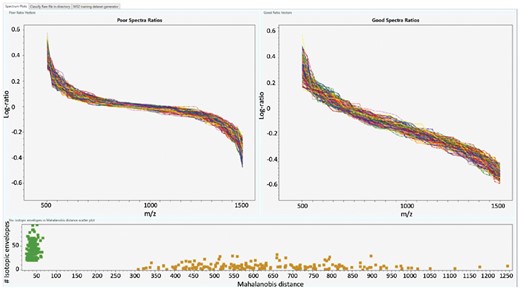
A screenshot of the TDGC graphical user interface, showing in the top panel plots of the log-ratio vectors and in the lower panel a scatter plot (number of isotopic envelopes versus Mahalanobis distance). The dots set between 0 and 90 Mahalanobis distance represents good spectra, and from 300 Mahalanobis distance, poor spectra
The two complete datasets obtained for the E.coli samples, comprising 7172 and 7121 MS/MS spectra, are available as F1.raw and F2.raw, respectively, at http://patternlabforproteomics.org/tdgc. Classification models for EThcD and HCD are also made available. Analyzing the data files with ProSightPD yielded 128 and 161 identifications, respectively, for a threshold score of 100. For a threshold score of 50 973 and 1049 spectra were identified. We then used TDGC on each complete dataset; 3469 and 3541 spectra, respectively were considered as high quality and retained after the QC. When applying ProSightPD on these spectra (with a threshold score of 50), 960 and 1039 spectral identifications were obtained (corresponding respectively to 13.6 and 14.6% identification rates). These identifications correspond to 98.7 and 99.0% of the identifications obtained from the raw files without a priori selection.
4 Final remarks
QC tools have played a key role in BUP. For TDP, we have shown that TDGC can efficiently select high-quality top-down spectra, in fact estimating an upper bound for identifications. It can also speed up large-scale TDP searches and, most importantly, we anticipate that it will play a key role in the development of TDP spectral libraries for next-generation search engines and diagnostic tools. To facilitate its use, a protocol is included in the tool’s website.
Funding
This work has been supported by Fiocruz, the Brazilian National Research Council (CNPq) and Graduate Studies Agency (CAPES), a FAPERJ BBP grant and an Agence Nationale de la Recherche (project ANR-15-CE18-0021) grant.
Conflict of Interest: none declared.
References
Author notes
The authors wish it to be known that, in their opinion, Diogo B. Lima and André R. F. Silva authors should be regarded as Joint First Authors.

