


Abstract
Pushed by the growing availability of Electronic Health Records for data mining, the identification of relevant patterns of co-occurring diseases over a population of individuals—referred to as comorbidity analysis—has become a common practice due to its great impact on life expectancy, quality of life and healthcare costs. In this scenario, the availability of scalable, easy-to-use software frameworks tailored to support the study of comorbidities over large datasets of patients is essential. We introduce Comorbidity4j, an open-source Java tool to perform systematic analyses of comorbidities by generating interactive Web visualizations to explore and refine results. Comorbidity4j processes user-provided clinical data by identifying significant disease co-occurrences and computing a comprehensive set of comorbidity indices. Patients can be stratified by sex, age and user-defined criteria. Comorbidity4j supports the analysis of the temporal directionality and the sex ratio of diseases. The incremental upload and validation of clinical input data and the customization of comorbidity analyses are performed by an interactive Web interface. With a Web browser, the results of such analyses can be filtered with respect to comorbidity indexes and disease names and explored by means of heat maps and network charts of disease associations. Comorbidity4j is optimized to efficiently process large datasets of clinical data. Besides a software tool for local execution, we provide Comorbidity4j as a Web service to enable users to perform online comorbidity analyses.
Doc: http://comorbidity4j.readthedocs.io/; Source code: https://github.com/fra82/comorbidity4j, Web tool: http://comorbidity.eu/comorbidity4web/.
1 Introduction
Two or more diseases are referred to as comorbid when they co-occur in the same patient. The aggregation of data of comorbid diseases over a population of patients to spot significant, global co-occurrences is known as comorbidity analysis (Valderas et al., 2009). During the last decades, this type of data analysis has acquired great relevance in clinical practice because of its ability to provide valuable insights for patients and healthcare systems (Starfield et al., 2003): the outcome of comorbidity analyses has indeed a substantial impact on the estimation of life expectancy, quality of life and healthcare costs (Cho et al., 2013; Repetto et al., 2001; Sharabiani et al., 2012). Moreover, in recent years, the growing availability and exploitation of Clinical Health Records for data mining has considerably increased the amount of data that can be studied by comorbidity analyses (Bagley et al., 2016; Holmes et al., 2011; Roque et al., 2011). This trend has also been strengthened by the increased interest of the biomedical community towards the use of clinical data for research purposes (Jensen et al., 2012).
In this scenario, the availability of software tools to easily perform systematic studies of comorbidities is essential. Besides user-friendliness and scalability to big datasets, a key requirement of such kind of tools is the high level customization of data input and analysis parameters in order to support the distinct clinical research settings that can characterize a study of comorbidities: the criteria to select or aggregate diseases, the approach to stratify patients or the strategy to model diseases with respect to their time span and sequence represent only some of the aspects to define when we study comorbidities.
In this paper, we present Comorbidity4j, an open-source Java tool useful to perform systematic analyses of comorbidities over large collections of clinical data obtained from EHR databases or health registries, generating interactive Web-based visualizations of results. Thanks to the platform-independent nature of the Java programming language, users can easily execute Comorbidity4j on their own machines, in a private environment. Users can also opt for performing their comorbidity analyses on-line, by accessing the Comorbidity4j Web Service at: http://comorbidity.eu/comorbidity4web/.
2 Design and implementation
Comorbidity4j reads demographic data, stratification facets (e.g. gender, race, etc.) and disease history of each patient from a set of tabular textual files (e.g. Comma or Tab Separated Values). A Web-based interface enables users to upload these files by interactively specifying their format (e.g. separator character, quotation of cell contents, presence of a header row) and the semantics of their columns, and validating their contents. Users are left total freedom with respect to the choice of the disease identifiers to use. The tool can import out-of-the-box datasets compliant with the Observational Medical Outcomes Partnership (OMOP) Common Data Model specifications (Hripcsak et al., 2015).
After uploading input data, users can also interactively select groups of diseases to be merged and thus treated as a single one during the analysis of comorbidities and define which pairs of diseases should be analyzed to spot relevant comorbidities. Filters to scope the study to subgroups of patients or diseases can be defined so as to consider only the most relevant pairs of comorbid conditions or to examine the temporal directionality of diseases. The availability of a Web-based interface tailored to interactively specify and validate all the data and parameters needed to perform a comorbidity analysis is meant to increase the user-friendliness of the tool by improving three of the aspects that often most affect the usability of comorbidity analysis tools: (i) the adaptation of the input clinical data to the format required by the tool: (ii) the validation of the input clinical data; (iii) the customization of the parameters to perform a comorbidity analysis. In Comorbidity4j all these steps are performed by means of an interactive, incremental Web-based workflow.
Comorbidity4j computes a comprehensive set of comorbidity indexes, verifying the statistical significance of disease co-occurrences. Besides the creation of a tabular file providing detailed results for each disease pair, Comorbidity4j enables the exploration of disease comorbidities by means of a set of interactive Web visualizations. By a Web browser, users can access: (i) a summary of the input parameters and the processing log; (ii) a rich collection of charts with an overview of the input patient dataset (patient distribution by age, gender, birth date, disease, etc.); (iii) a heat map to explore the sex ratio of disease pairs; (iv) an interactive interface where the analyzed disease pairs can be filtered by combining comorbidity indexes and diseases, and then visualized by heat maps and disease networks.
A functional overview of Comorbidity4j is shown in Figure 1. Comorbidity4j is available as open-source software, implemented in Java, thus ensuring platform-independent execution. A set of unit tests enables the automated verification of the correctness of the results of comorbidity analysis performed by Comorbidity4j with respect to eventual future modifications or extensions of the tool. The Web visualizations rely on the Javascript libraries: Jquery (UI), Tabulator, Plotly.js and Vis.js. Users can perform comorbidity analyses on their private workstations to guarantee data privacy or exclusively online by accessing Comorbidity4j on the Web. A detailed documentation of Comorbidity4j is available at: http://comorbidity4j.readthedocs.io/. Comorbidity4j is distributed under the terms of the AFFERO GPL Version 3 software license (https://www.gnu.org/licenses/why-affero-gpl.html).
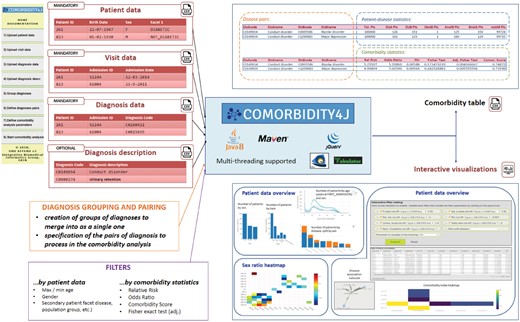
Functional overview of Comorbidity4j
3 Comparison with other tools
Currently there are few software tools for comorbidity analysis, most of them implemented in R and tailored to specific sets of diseases. Noteworthy examples are the comoRbidity R package (Gutiérrez-Sacristán et al., 2018) that performs analysis of disease comorbidities from both the clinical and molecular perspectives, the Medicalrisk R package (McCormick and Thomas, 2015) that generates risk estimates and comorbidity flags from ICD-9 codes, the Elixhauser SAS package (Elixhauser et al., 1998) that computes 29 metrics supporting ICD-9 and ICD-10 disease coding, the Coxnet R package (Hokeun et al., 2014) that exploits the Cox proportional hazard model and the Icd R package (https://github.com/jackwasey/icd) that provides several utilities to analyze ICD-9 and ICD-10 disease codes, but can be easily customized to support other disease coding schemes.
With respect to these tools Comorbidity4j presents the following advantages: (i) provides users with a easy-to-use Web-based interface to incrementally upload and validate clinical input data and to customize the analyses of comorbidity; (ii) can ingest any kind of clinical dataset by giving users the possibility to interactively specify the format and semantics of data; (ii) is optimized for exploratory comorbidity analysis over large clinical databases; (iii) generates Web-based interactive visualizations to explore and refine the results of comorbidity analyses; (iv) is also provided as a Web tool to perform comorbidity analyses completely online.
We compared the performance of Comorbidity4j with comoRbidity (Gutiérrez-Sacristán et al., 2018), a publicly available R tool that supports comorbidity analyses of clinical data. By consdiering clinical datasets of different size in terms of number of patients, visits and number of diagnosis pairs to analyze, we noticed that Comorbidity4j manages to reduce the execution times of comorbidity analyses by at last one order of magnitude by requiring a comparable amount of memory for its computations. Further details of our benchmarking results can be accessed online at: https://comorbidity4j.readthedocs.io/en/latest/Performance/.
4 Conclusion
Comorbidity4j is an easy-to-use, Web-based, open-source tool that supports systematic analyses of clinical comorbidities over large patient databases. Comorbidity4j can be executed both on private workstations and online, as a Web service. The execution of comorbidity analyses can be extensively customized according to user needs. Thanks to the use of modern Web technologies to visualize, interactively browse and refine the results of comorbidity studies, Comorbidity4j provides users with new visual tools to easily identify and filter significant comorbid disease as well as to execute exploratory data analyses.
Funding
We received support from ISCIII-FEDER (PI13/00082, PI17/00230, CPII16/00026), IMI-JU under grants agreements no. 116030 (TransQST) and no. 777365 (eTRANSAFE) resources of which are composed of financial contribution from the EU-FP7 (FP7/2007- 2013) and EFPIA companies in kind contribution, and the EU H2020 Programme 2014-2020 under grant agreements no. 634143 (MedBioinformatics) and no. 676559 (Elixir-Excelerate). The Research Programme on Biomedical Informatics (GRIB) is a member of the Spanish National Bioinformatics Institute (INB), PRB2-ISCIII and is supported by grant PT13/0001/0023, of the PE I + D+i 2013-2016, funded by ISCIII and FEDER. AGS acknowledges financial support from the Spanish Ministry of Economy and Competitiveness, through the ‘María de Maeztu’ Programme for Units of Excellence in R&D (MDM-2014-0370). The DCEXS is a ‘Unidad de Excelencia María de Maeztu’, funded by the MINECO (MDM-2014-0370).
Conflict of Interest: none declared.
References

