


Abstract
The promise of higher phylogenetic stability through increased dataset sizes within tree of life (TOL) reconstructions has not been fulfilled. Among the many possible causes are changes in species composition (taxon sampling) that could influence phylogenetic accuracy of the methods by altering the relative weight of the evolutionary histories of each individual species. This effect would be stronger in clades that are represented by few lineages, which is common in many prokaryote phyla. Indeed, phyla with fewer taxa showed the most discordance among recent TOL studies. We implemented an approach to systematically test how the identity of taxa among a larger dataset and the number of taxa included affected the accuracy of phylogenetic reconstruction.
Utilizing an empirical dataset within Terrabacteria we found that even within scenarios consisting of the same number of taxa, the species used strongly affected phylogenetic stability. Furthermore, we found that trees with fewer species were more dissimilar to the tree produced from the full dataset. These results hold even when the tree is composed by many phyla and only one of them is being altered. Thus, the effect of taxon sampling in one group does not seem to be buffered by the presence of many other clades, making this issue relevant even to very large datasets. Our results suggest that a systematic evaluation of phylogenetic stability through taxon resampling is advisable even for very large datasets.
Supplementary data are available at Bioinformatics online.
1 Introduction
The promise of phylogenomic approaches consisted in higher phylogenetic accuracy and stability even in the presence of incomplete datasets (e.g. missing data or incomplete taxon sampling) (Boore, 2006; Felsenstein, 1985; Huelsenbeck and Rannala, 1997). This promise stems from an increased availability of sequenced genomes and faster algorithms for the analysis of thousands of species, which support the reconstruction of increasingly more inclusive trees of life (TOL). In an ideal case scenario, these TOL should be able to represent the full extent of the evolutionary processes of life over 4 billion years (Delsuc et al., 2005). Phylogenomic approaches have been used widely in both Eukaryotes and Prokaryotes but it is especially in Eukaryotes that increased samplings have resolved the phylogenetic placement of groups that are taxonomically diverse and that have been phylogenetically unstable with smaller datasets (Burki et al., 2016). For example, deep relationships within the phylogenies of insects (Shin et al, 2018) and angiosperms (Massoni, 2014) have shown increased resolution when taxon numbers are increased. However, TOL reconstructions have also shown poor phylogenetic convergence for many important nodes and this is especially true in the deepest parts of the trees, raising doubts that higher accuracy can be achieved purely by larger datasets (sites and taxa) (Shen, 2017).
Within TOL, relationships among prokaryotic phyla are particularly unstable most likely because of compounding effects of horizontal gene transfers, difficult orthology determination, inaccurate evolutionary models and compositional biases (Som, 2015). All these factors are inherently linked to taxon sampling because different species will have unique gene histories and other biases (e.g. compositional biases) that will weigh differently on the overall phylogenetic signal. These lineage-specific histories are drawn out when large numbers of species are used but in clades in which genomic information is limited, the individual histories of each lineage is likely to have a stronger effect on the overall phylogeny (Gatesy et al., 2007; Heath et al., 2008; Rokas et al., 2003). Therefore, there is a reasonable expectation that changes in number and identity of species within a dataset can affect the outcome of phylogenetic reconstruction. Because of this, it is important to test phylogenetic robustness under scenarios with variable numbers of species (i.e. high or low taxon sampling) and also with identical taxon sampling but different choice of species. This approach will lead to more focused hypothesis-testing when searching for causes of conflicting signals among TOL because it allows to test sequence properties (e.g. compositional biases, rate of evolution) of those species with diverging signals (Gatesy et al., 2007). These fewer and more streamlined tests can then be applied easily to more extensive datasets enabling comprehensive evaluations of the robustness of the conclusions based on the obtained tree.
A recent example of phylogenetic instability in the presence of very large datasets is provided by the comparison of studies by Lang et al. (2013), Rinke et al. (2013) and Hug et al. (2016), each of which utilized hundreds to thousands of species to reconstruct a TOL. These TOL show overall agreement for the monophyly of domains and phyla but disagree in many of their relative relationships despite broad similarities in dataset sizes and methodologies. For example, within prokaryotes all three maximum-likelihood phylogenies confirm the strong associations among phyla of the Planctomycetes, Verrucomicrobia and Chlamydiae, and recover a well-known resolved monophyly for this superphylum (Wagner and Horn, 2006). However, clades formed by phyla in the Terrabacteria superphylum, are inconsistent (Fig. 1) and their variability is more frequently observed when clades include phyla represented by few species [e.g. Deinococcus–Thermus (DT)]. This suggests that the incongruence seen in reconstructions of even large datasets could be directly correlated with taxon sampling and, indirectly, with the evolutionary histories of the species used to represent a single clade among many others.
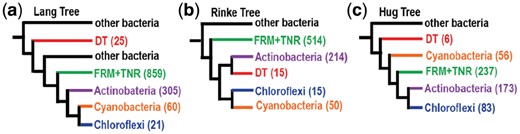
ML phylogenies showing backbone of Terrabacteria phyla. In parenthesis is shown the number of species used for each phylum or group. (a) Collapsed tree from Lang et al. (2013). (b) Collapsed tree from Rinke et al. (2013). (c) Collapsed tree from Hug et al. (2016). DT, Deinococcus–Thermus; FRM+TNR, Firmicutes+Tenericutes
To test this, we created a phylogenetic pipeline that removed a user-defined number of species within a single phylum from a concatenated alignment of orthologous genes, while keeping all other phyla intact (Fig. 2). Working under the simple hypothesis that the instability of the Terrabacteria is a result of the species chosen to represent a clade, we created permutations of species for one clade at a time to investigate the stability of the phylogeny in light of different sampling scenarios (SSs). We tested this hypothesis using phyla with relatively low taxon sampling (i.e. DT, 20 species, and Chloroflexi, 14 species) and using a phylum with high taxon sampling (Actinobacteria, 265 species) as a control. In general, if the identity of the taxon sampled (and its correlated lineage-specific properties) has no influence on phylogenetic reconstruction we would expect all altered datasets to recover the same topology as the complete, unaltered dataset. However, this is not what we found. In addition to previously observed effects of reduced taxon sampling on phylogenetic stability, we also found that species identity impacts the overall congruence in phylogenetic reconstruction under equal number of taxa. This effect is stronger when a clade is represented by one or a few species but it is still present when large numbers of lineages are used.
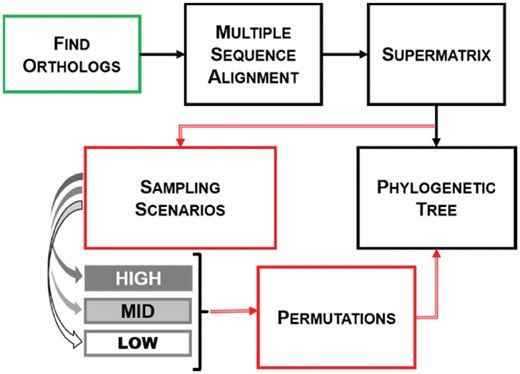
Phylogenetic pipeline to produce taxon resamplings. Standard reconstruction steps are indicated through solid black arrows. To test hypotheses about the effect of taxon sampling within this process, we implemented the steps shown in red that create resamplings with different species numbers (‘Sampling Scenarios’ in gray) and different lineages with the same number of species (‘Permutations’). Sampling and permutations were implemented either after the alignment step or from the beginning by reassessing orthologs (green box)
2 Materials and methods
We assembled a dataset of 766 Terrabacteria species to explore the effect on phylogenetic reconstruction of two variables: (i) the identity of the species used to represent a given phylum and (ii) the number of species sampled for that phylum. We automated a phylogenetic pipeline that implements standard phylogenetic reconstruction approaches (i.e. orthology determination, alignment, tree building) on different SSs (HIGH, MID, LOW) that modified the identity of taxon sampling within a chosen phylum (Fig. 2). Each permutation resulted in a tree that was then compared to the others within that scenario to determine if the identity of the species isolated had an effect on the topology of the tree. Each scenario was iterated exhaustively in the small phyla analyzed and heuristically in a large phylum to explore the effect that each individual species or group of species might have on the reconstructed phylogeny (Fig. 2: red arrows). After evaluating available options, software and parameters selections for the pipeline were systematically optimized based on computational demands and overall performance (Supplementary Sections 1.1 and 1.2).
2.1 Dataset
The initial dataset was composed of fully sequenced proteomes for six phyla within the Terrabacteria superphylum available from the National Center for Biotechnology Information as of March 7, 2016. Species with multiple strain representatives were manually filtered to include only the strain that had the largest genome, resulting in a total of 766 species (we refer to this dataset as FULL; Fig. 3). Within the Terrabacteria, Actinobacteria had 265 fully sequenced species, Firmicutes (which, for the purpose of this study, include also Tenericutes) 394, DT 20, Chloroflexi (CHF) 14 and Cyanobacteria 73. We implemented different SSs to the alignment by removing a set number of taxa for a chosen phylum (e.g. DT) without altering the number of species present for other phyla. Among these phyla, we chose the two smallest ones (DT and CHF) to test changes in their phylogenetic position within each scenario and Actinobacteria (ACT), as a control group, with a large number of species.
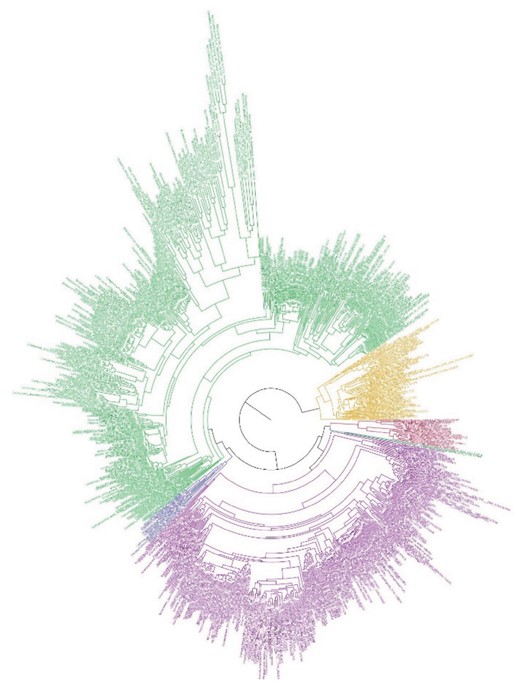
ML tree estimated with FastTree using FULL (766 species) dataset. Estimation based on the concatenation of 30 orthologs (6227 sites). Cyanobacteria, orange; Firmicutes/Tenericutes, green; Actinobacteria, purple; Deinococcus–Thermus, red; Chloroflexi, blue
2.2 Phylogenetic pipeline
ProteinOrtho v5.16b (Lechner et al., 2011) was used to identify homologous genes based on results of bidirectional BLASTp scores at the most relaxed setting (connectivity = 0), which creates clusters of orthologous and paralogous genes. We then refined the results using an in-house script to filter the homologous groups and identify orthologs only based on a minimum threshold of species represented in each ortholog. We tested multiple values (100, 99, 97, 95, 90 and 80%) and found that the 90% threshold optimized the number of orthologs (30 orthologs) and amount of missing data (<2%) (Supplementary Tables S1 and S2). Each ortholog was aligned using MUSCLE (Edgar, 2004) with default parameters. The alignments were filtered to exclude sites with more than 25% gaps. After concatenating each individually aligned ortholog into a supermatrix, we obtained an alignment consisting of 6227 sites.
Due to the heavy computational requirements necessary to identify the best substitution model, we applied ProtTest v3.4 (Darriba et al., 2011) to 15 datasets with 100 species each, which were randomly sampled from the original concatenation. In all cases the most complex model (LG) was found to be the best fit. We then implemented this model in FastTree (Price et al., 2010) and IQ-TREE (Nguyen et al., 2015) to estimate maximum likelihood (ML) phylogenies for all scenarios and permutations.
2.3 Experimental design
The basic SSs implemented in our experimental design resulted in the creation of 120 data matrices from which phylogenetic trees where estimated; 1 for FULL, 54 for each LOW and HIGH (DT: 20, CHF: 14, ACT: 20) and 11 for MID (DT: 2, CHF: 4, ACT: 5) (Tables 1 and 2). In groups with low species representatives (i.e. DT, CHF), the LOW SS was obtained by removing all species, except for one, from the dataset resulting in 747 total species in the DT permutations and 753 species in the CHF permutations. HIGH taxon sampling was represented by the inverse, where 19 of 20 DT and 13 of 14 Chloroflexi species were kept resulting in trees consisting of 765 species. For each HIGH and LOW scenario, each species within a given phylum was either kept or removed resulting in 20 permutations for DT and 14 permutations for Chloroflexi, per scenario. Each permutation resulted in a tree that was then compared to the others within that scenario to evaluate if the identity of the species isolated had an effect on the topology of the tree (Table 1).
Summary of dataset sizes based on SS
| SS | PS | F/T | Cyn. | ACT | DT | CHF | Total | Trees |
|---|---|---|---|---|---|---|---|---|
| FULL | All | 394 | 73 | 265 | 30 | 14 | 766 | 1 |
| HIGH | DT | 394 | 73 | 265 | 19 | 14 | 765 | 20 |
| CHF | 394 | 73 | 265 | 20 | 13 | 765 | 14 | |
| ACT | 394 | 73 | 239 | 20 | 14 | 740 | 20 | |
| LOW | DT | 394 | 73 | 265 | 1 | 14 | 747 | 20 |
| CHF | 394 | 73 | 265 | 20 | 1 | 753 | 14 | |
| ACT | 394 | 73 | 3 | 20 | 14 | 504 | 20 |
Note: Listed for each PS is the total number of species kept per phyla, total number of species for each dataset and total number of trees produced. Each listed dataset is based on the concatenation of 30 orthologs (6227 sites). F/T, Firmicutes/Tenericutes; Cyn., Cyanobacteria; ACT, Actinobacteria; DT, Deinococcus–Thermus; CHF, Chloroflexi.
Summary of number of species (sp.) for each MID-level SS
| Phylum | Genus/order | # sp. kept | Total # sp. |
|---|---|---|---|
| DT | Deinococcus | 10 | 755 |
| Thermus | 6 | 752 | |
| CHF | Chloroflexus | 3 | 755 |
| Dehalococcoides | 2 | 754 | |
| Dehalogenimonas | 2 | 754 | |
| Roseiflexus | 2 | 754 | |
| ACT | Corynebacteriales | 86 | 587 |
| Streptomycetales | 32 | 533 | |
| Bifidobacteriales | 19 | 520 | |
| Pseudonocardiales | 17 | 518 | |
| Propionibacteriales | 10 | 511 |
Note: Selection was initially based on monophyly of a genus (DT, CHF) or order (ACT) whose species were kept in the reconstructed phylogeny. DT, Deinococcus–Thermus; CHF, Chloroflexi; ACT, Actinobacteria.
In the MID-level SS the choice of species to keep was based on monophyly of a genus that had two or more species representatives. Once identified, the selected group was kept in the phylogeny while all other species in the phylum were removed. DT had two monophyletic groups, the genus Deinococcus represented by 10 species and the genus Thermus represented by 6 species (resulting in trees of 756 species and 752 species, respectively). Chloroflexi had four monophyletic genera: Chloroflexus with three species and three genera with two species each: Dehalococcoides, Dehalogenimonas and Roseiflexus (resulting in trees of 753 species and 754 species, respectively). The number of permutation trees under the MID scenario depended on the number of groups identified (two for DT, four for CHF) (Table 2).
We also considered a group with a high number of species representatives as a control for the sparsely represented phyla. Although, both Firmicutes/Tenericutes and Actinobacteria have relatively high number of species within our Terrabacteria dataset, we chose Actinobacteria to function as our control since this phylum is consistently shown to be monophyletic and showed variance in its position relative to poorly represented groups both among literature trees (Hug et al., 2016; Lang et al., 2013; Rinke et al., 2013) and within our results. Moreover, the Firmicutes/Tenericutes group shows large variance in branch length within the group with Tenericutes having longer branches than the Firmicutes. This suggests that there is stronger rate variation within the F/T group than the ACT which could cause phylogenetic instability that would conflate with any effect caused by taxon sampling. Thus, we used Actinobacteria as a control to remove additional confounding factors unrelated to taxon sampling. Because of the large number of species within ACT (265) an exhaustive search approach like the one used for DT and CHF is not feasible. Therefore, we modified our approach as follows: LOW taxon sampling was represented by keeping 1% (3 species) of the 265 species of Actinobacteria in the alignment and removing the remaining 262 species leaving 504 total species in the resulting trees. For HIGH taxon sampling, we removed 10% of species from the Actinobacteria phylum which resulted in an alignment of 740 species. There were 20 permutations generated for each LOW and HIGH SS using randomly selected species (Table 1). For MID-level sampling we included orders where nodes were monophyletic in the FULL phylogeny, with the additional requirement that these groups had to be represented by more than 10 species. There were five permutations generated by keeping only the species within respective orders and removing all other species in the Actinobacteria phylum. The following orders were kept in each iteration: Streptomycetales (32 species), Pseudonocardiales (17 species), Propionibacteriales (10 species), Corynebacteriales (86 species) and Bifidobacteriales (19 species) (Table 2; species names for each scenario tested are available in Supplementary Tables S10–S12).
In the DT and Actinobacteria phyla we also created an additional MID-level sampling based on random sampling (MIDran), instead of genus or order monophyly. This random sampling of a subset of species acted as a control to the monophyly-based analysis and used the same number of species identified for each of our ancestry driven (MIDanc) datasets (Table 3). We repeated each scenario 20 times, each time with the same number but different set of randomly chosen species. For example, we created 20 random datasets of 19 species in ACT to compare it to the results from the Bifidobacteriales MIDanc sampling (Supplementary Table S18). This resulted in an additional 40 trees produced for DT under these conditions and an additional 100 for Actinobacteria.
DT closest relative frequencies
| DT | CHF | ACT | |||||||
|---|---|---|---|---|---|---|---|---|---|
| LOW | MID | HIGH | LOW | MID | HIGH | LOW | MID | HIGH | |
| CTP/TSN | 0.70 | 0.50 | 1.00 | 0.07 | 0.50 | 1.00 | 0.05 | 0.00 | 0.90 |
| ACT | 0.30 | 0.50 | 0.00 | 0.93 | 0.50 | 0.00 | 0.95 | 1.00 | 0.10 |
| Basal | 0.70 | 0.50 | 0.00 | 0.00 | 0.50 | 0.00 | 0.05 | 0.00 | 0.00 |
| ACT | 0.30 | 0.50 | 1.00 | 1.00 | 0.50 | 1.00 | 0.95 | 1.00 | 1.00 |
Note: Frequencies are represented per phylum analyzed [DT, Chloroflexi (CHF) and Actinobacteria (ACT)] for 119 trees produced. For trees produced with CTP and TSN, DT either had Actinobacteria (ACT) or CTP/TSN as its closest relative. If CTP/TSN branch were not present, DT either had ACT as its closest relative or moved basal to the rest of the ingroup. In the 120th tree (the FULL phylogeny), DT’s closest relative is CTP/TSN (not shown in the table).
2.4 Analytical framework
Our experiment was designed to make comparisons within a relative framework based on the selection of an arbitrary outgroup, Cyanobacteria, within the Terrabacteria phylum. We chose to use Cyanobacteria for three primary reasons: first, it is a group of medium size (73 species) and, thus, does not fall under an either poorly or well-represented category; second, it is a consistently monophyletic group; third, because it is a group within Terrabacteria, it does not decrease the number of orthologs shared by most of the Terrabacteria species and helps maintaining a high total number of sites in the alignment. The topology of all rooted trees reconstructed was compared at two levels: the backbone, which compares relationships among phyla, and all internal nodes, which includes the relationships among and within phyla.
At the internal nodes level, only the permutated phylum (DT, CHF or ACT) was collapsed leaving the other phyla represented by all their species. We collapsed permutated branches under each given SS to assess the discord introduced to other nodes by the given permutation. To evaluate the similarity among trees produced from our pipeline we used Robinson–Foulds (RF) distance (Robinson and Foulds, 1981) obtained with IQ-TREE (Nguyen et al., 2015). We treated all the trees produced under a given permutation scenario (PS) as a set and normalized Robinson–Foulds (nRF) the results using the maximum RF value possible based on number of nodes [i.e. for n lineages, maximum RF is 2(n−3); DT: n = 747, CHF: n = 753, ACT: n = 502]. In addition, because each SS has a different number of total trees that need to be compared, we weighted the standardized RF scores by the total number of trees in each category (nRF*) (Tables 1 and 2). At the backbone level, we collapsed monophyletic groups that are classified as the same phylum to easily evaluate the relationship among phyla in the estimated tree. Each of these trees is composed of six branches that represent the five phyla. The sixth branch represents an exception made for two species, Coprothermobacter proteolyticus (CTP) and Thermodesulfobium narugense (TSN) that, despite being classified as Firmicutes, consistently clustered outside of this phylum and thus were collapsed independently (Fig. 3).
2.5 Additional considerations
The phylogenetic comparisons we perform are within a relative framework that is delimited by a tree with the full set of taxa and trees with reduced taxa sets. Although this provides consistency in the variables tested (i.e. taxon sampled), it also assumes that, in altering the sampling, the orthology assessment, and related difference in alignment length, does not influence topology. To evaluate this assumption, we extended the pipeline to (i) re-estimate orthologous groups for each permutation dataset at the first step of the pipeline (Fig. 2, green box) as opposed to permutating species from the supermatrix and (ii) bootstrap (50 times) the length of resulting alignments to the same number of sites as the full dataset (Supplementary Section 1.4). These analyses allowed us to test the influence of orthology determination and alignment length on our results.
Although the ‘true’ phylogeny of the Terrabacteria superphylum was not relevant to our study, differences in algorithms used to estimate phylogeny based on ML methods have the potential of producing alternative phylogenies given the same dataset (Zhou et al., 2017). Current literature disagrees on the strengths and weaknesses of each phylogenetic program. In particular, two recent studies showed contrasting results on the agreement of phylogenies obtained by FastTree (Price et al., 2010) and IQ-TREE (Nguyen et al., 2015). We repeated our analyses with both these methods which showed overall congruency in patterns (IQ-TREE results are reported in Supplementary Section 2.1).
3 Results
Within a relative framework we compared permutated trees to a tree estimated using the FULL dataset (Fig. 3) and to each other by measuring their nRF distances based on all internal nodes. We also quantified frequencies of backbones produced by each permutation to explore changes in relative relationships within Terrabacteria. For the purpose of these comparisons, all trees were rooted using Cyanobacteria. We repeated this approach under three scenarios (collectively referred to as ‘reduced datasets’): LOW (single or <1% species), MID (intermediate number of species) and HIGH (all but one or >90%). Two MID scenarios were created to evaluate the phylogenetic signal produced when sampled species are closely related (MIDanc) or not (MIDran).
Overall, the reduced datasets produced seven different topologies that did not agree with the full dataset. A comparison of FastTree and IQ-TREE results showed that the phylogenies reconstructed by the two methods differ (using both the full and the reduced datasets) but both recovered multiple phylogenies using fewer taxa (7 in FastTree and 7 in IQ-TREE). On average, IQ-TREE also produced higher RF scores (i.e. higher tree disagreements) than FastTree especially under the LOW and HIGH SSs (the only exception was the MIDran SS in Actinobacteria where IQ-TREE showed excellent consistency compared to FastTree) (Supplementary Tables S5 and S7, respectively). Because of this, we consider the results from FastTree more conservative and report these in the main text. The IQ-TREE results are shown and discussed in the Supplementary Information (Supplementary Section 2.1).
Across all analyses performed, we found progressively weaker phylogenetic robustness when fewer species are used to represent a phylum. However, we also found that the choice of species used alters the final phylogenetic reconstruction outcome when the species numbers remain identical. This result held irrespective of the ML method used (FastTree or IQ-TREE), although the two methods identify different species as the source of topological discordance (see Supplementary Section 2.1).
3.1 Comparisons of internal nodes
When we compared the dissimilarity among trees, using the RF metric, obtained across species permutations and the tree from the complete dataset (FULL), we found that trees produced under LOW sampling resulted in the most discord for all three phyla analyzed (Fig. 4). However, the discord seen within Chloroflexi is ∼3 times lower than either DT or Actinobacteria (Fig. 4: CHF, blue bar). Based on total standardized RF scores for each given set we found that, across all SSs, permutations of Actinobacteria (large groups) resulted in more than 2-fold higher dissimilarity among internal nodes than in small groups (Actinobacteria: 8.65, DT: 4.29, Chloroflexi: 1.18). Comparing our ancestry driven MID sampling (MIDanc) to a control of randomly selected species (MIDran), we found that in the majority of samples from MIDran produced higher RF values then MIDanc (Supplementary Section 2.2).
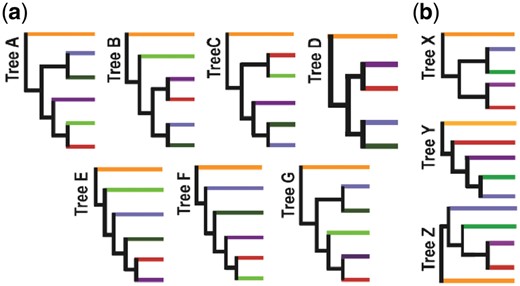
Backbone topologies. Each branch represents species within a given phylum of Terrabacteria: Cyanobacteria (orange), Chloroflexi (blue), Actinobacteria (purple), DT (red) and Firmicutes/Tenericutes (dark green). (a) Trees A–G show the different backbone topologies of all trees produced with reduced datasets in FastTree. Within these trees Firmicutes are paraphyletic; the two species clustering outside Firmicutes/Tenericutes (dark green) are CTP and TSN (light green). (b) Trees X–Z show the reduced set of topologies represented without the CTP/TSN branch
3.2 Comparison of backbone nodes
The backbone topology produced when all 766 species (FULL) were used is shown as tree A in Figure 5a. Collapsing the monophyletic groups at the phylum level from our dataset leaves five phyla as the backbone, assuming Firmicutes and Tenericutes as a single branch. CTP and TSN were consistently not clustering according to their classification (Firmicutes) but forming a monophyletic group of their own, which we counted as a separate, sixth clade (Fig. 5a, light green branches). Excluding Cyanobacteria that we used as outgroup, there are 15 possible different unrooted topologies with 5 phyla (105 with 6 phyla) (Felsenstein, 1978), but, throughout our analyses with the reduced datasets, we recovered only seven topologies (Fig. 5a).
![Comparison of RF scores from SSs (LOW, MID, HIGH) to FULL tree. Results are shown for all three phyla that were analyzed [(DT (red), Chloroflexi (blue) and Actinobacteria (purple)]. RF scores were obtained for the comparison of FULL tree to each permutated tree, then they were nRF and weighted according to the number of trees produced within each SS (nRF*)](https://oup.silverchair-cdn.com/oup/backfile/Content_public/Journal/bioinformatics/35/19/10.1093_bioinformatics_btz121/2/m_bioinformatics_35_19_3608_f5.jpeg?Expires=1716372289&Signature=XiwFto4e6NHdePdhtPc8NiMZuCC5L173ald9BjiZlq5WRZ3r0VA~94T0ZgitLgng1ATW5TQH5cB-daA3qAVWSVuJvowvMpwd9TWUEqj-XRdJXJuiW6hHUze~fc~okcBp4XdQofCuBOIdUhDaQ4wAM439FyVuqjzzYLTEnQN-JAIrQ0Ehmfyyrtb-~tB~QNsSlwTf5XoGp2l2Ahu9hluxqJU-Nj1Sf0BaHpK6rXJC8s-UZExgLM8TiSYtd3H4Jmi1woxVQv7kLl7aCgqUHlL-L9nM0lX6CsY8MnsjDPEg1V~xFoHickD6-dQehMoLmpXAhzvSwOKePq21WoCLOTGUUg__&Key-Pair-Id=APKAIE5G5CRDK6RD3PGA)
Comparison of RF scores from SSs (LOW, MID, HIGH) to FULL tree. Results are shown for all three phyla that were analyzed [(DT (red), Chloroflexi (blue) and Actinobacteria (purple)]. RF scores were obtained for the comparison of FULL tree to each permutated tree, then they were nRF and weighted according to the number of trees produced within each SS (nRF*)
In HIGH sampling, the permutations of small groups had no effect on the backbone recovered (i.e. taxon composition had no influence); however, taxon composition did have an influence on 10% of the trees recovered in our large group (Fig. 6a: tree B, solid purple bar). As expected, the most discord is seen in LOW sampling where the chosen phylum is represented by the lowest number of species (Fig. 6a: empty bars). The MIDanc SS also shows discordance, and the most common signal obtained is not congruent with the most common signal from either HIGH or LOW sampling (e.g. tree B in MID and trees C–F in LOW; Fig. 6b). However, the backbones recovered under MIDran are not the same as backbones recovered from MIDanc, with MIDran often recovering the FULL tree (Supplementary Section 2.2). Therefore, within both LOW and MID sampling, taxon composition strongly influenced the backbone recovered and revealed conflicting signals irrespective of the size of the group being altered (small or large). Across all SSs, <50% of the trees produced the same backbone topology as the FULL tree (Fig. 6b: tree A). This result is largely driven by the HIGH SS, as tree A is not recovered by permutations in any other SS (Fig. 6b: dark gray bar).
![Backbone topology frequencies. Trees A–G as shown in Figure 5. (a) Frequencies are represented per phylum analyzed [Deinococcus–Thermus (DT), Chloroflexi (CHF) and Actinobacteria (ACT)] for 120 trees produced for each SS [HIGH (solid), MID (shaded) and LOW (empty)]. (b) Frequencies (0–100% for each bar) are represented per SS for 120 trees produced. Legend shows color coding of SSs with number of trees produced for each shown in parenthesis](https://oup.silverchair-cdn.com/oup/backfile/Content_public/Journal/bioinformatics/35/19/10.1093_bioinformatics_btz121/2/m_bioinformatics_35_19_3608_f6.jpeg?Expires=1716372289&Signature=TaWIMBgH08jbmjWsGd3HGTVIBRGk4PIoFMEwdnK-mxblaYglGeseKekjCOysLg~YUo4c~kX85z0mmUThIAOiMQfOJ27oRb4uCqQ69McmAcS34-wmDJcZLyXNWEdiJrBAYBsUasi5jOwN~8A-CY2yTyJnNBiHF2NGf2pFrgBKGdqSE-fde2ssGl0QoasDVdLAyTejjct-UTdw1fMwSVT9kFEkmR~X9~JcB1-BXRX8F9E2ObFzSjlwMT7iz-oraDepV1PK6XvSEtnBELJ2gKxOHuwCFR9TgeGfXZwHbmzVPlQm4rrYAsYBzPXZYxZeryYDafPEy8Pa0mR9XmG8A4soNA__&Key-Pair-Id=APKAIE5G5CRDK6RD3PGA)
Backbone topology frequencies. Trees A–G as shown in Figure 5. (a) Frequencies are represented per phylum analyzed [Deinococcus–Thermus (DT), Chloroflexi (CHF) and Actinobacteria (ACT)] for 120 trees produced for each SS [HIGH (solid), MID (shaded) and LOW (empty)]. (b) Frequencies (0–100% for each bar) are represented per SS for 120 trees produced. Legend shows color coding of SSs with number of trees produced for each shown in parenthesis
3.3 Classification conflicts
Because CTP/TSN clustered outside their current classification (Firmicutes) and created an additional branch in the backbone tree, we evaluated our patterns in the absence of these two species. Simply eliminating the branch containing CTP and TSN from our backbone trees (A–G), showed that the FULL tree, as well as most of the trees produced from the permutations across all SSs, recovers ACT as the closest relative to DT (>85%) while the others place DT basal to the ingroup. Despite this reduction in variance seen among the backbone (from seven trees to three; Fig. 5b), the overall patterns of discordance among sampling and PSs observed with and without CTP/TSN remain (Fig. 7). We repeated our analyses eliminating both these species, and each individually, from our original 766 species dataset, and we found that these species, together and individually, alter the topologies recovered in unique ways (see Supplementary Section 2.4).
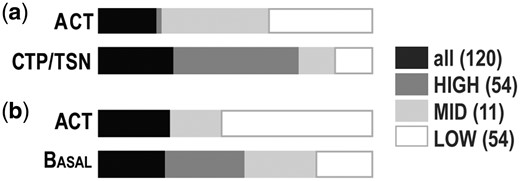
DT closest relative frequencies. Frequencies (0-100% for combined bars) are represented per SS for 120 trees produced. Legend shows color coding of SSs with number of trees produced for each shown in parenthesis. (a) Results of trees produced with CTP and TSN, where DT either had Actinobacteria (ACT) or CTP/TSN as its closest relative. (b) For trees produced if CTP/TSN branch was not included, either ACT is the closest relative to DT or DT is basal to the rest of the ingroup phyla
3.4 Changes in alignment
Because all backbone analyses were conducted on alterations of the original alignment (FULL: 6227 sites; Section 2 and Supplemental Section 1.1), we evaluated the effects that new alignments obtained from different sets of orthologs might have on phylogenetic reconstructions. We focused on the DT phylum under LOW sampling because it is the one that produced the least stable results and evaluated (i) changes in orthologous groups and (ii) changes in the composition of alignment sites. Removal of 19 out of 20 DT species prior to the orthology assessment step, resulted in the addition of one ortholog for 19 of 20 permutations, producing alignments that were on average 10% longer. Whether we used these longer alignments or reduced their length by bootstrapping the sites to the same length of the FULL alignment (see Section 2), we found that the backbone topology recovered remained the same in ∼55% of the trees and none of those that changed recovered the FULL phylogeny (Supplementary Table S4).
4 Discussion
Recent TOL studies still show many incongruences especially in deep nodes despite the use of large-scale datasets and the complexity of the approaches applied to closely model evolutionary processes. While many studies share similar broad taxonomic sampling, details of numbers and identity of lineages used as representatives of each clade differ. In addition, some clades are represented by hundreds of lineages and others by only a few. This variability in taxon sampling led us to hypothesize that it may be a major cause of the discrepancies in TOL reconstructions observed even when datasets and methods are broadly overlapping.
The idea that taxon sampling can negatively affect reconstruction efforts has been extensively tested in previous studies (Hedtke, 2006; Zwickl and Hillis, 2002), primarily focusing on eukaryotes or simulated data. However, many of the phylogenetic disagreements observed in TOL studies involve the deepest nodes of Bacteria and Archaea (Hug et al., 2016; Lang et al., 2013; Rinke et al., 2013), which can evolve using different evolutionary processes compared to eukaryotes. For example, compositional biases are more extreme in prokaryotes as is the frequency of horizontal gene transfer (HGT) and challenges in identifying true orthologs (Daubin et al., 2002; Jain et al., 1999,Som, 2015). Ultimately, the effect of taxon sampling is interconnected with these underlying evolutionary processes because each species used to represent a clade will inevitably carry its own genomic properties and unique evolutionary history (Gori et al., 2016). While this can make it difficult to isolate the effect of each individual genomic characteristic, it allows the use of simple taxon resampling procedures to identify those lineages that show discordant phylogenetic signals and flag them for further analyses to determine the leading cause of these signals.
4.1 Insights from a Terrabacteria dataset
We investigated the use of this approach in prokaryotes by modeling different permutations of a Terrabacteria dataset to create scenarios that alter the number of taxa (and their identity) representing a given phylum while keeping other variables constant. Our results show two main trends: (i) the lower the number of taxa in a phylum the larger the variance in tree reconstruction and (ii) even with identical number of taxa, the identity of the species chosen to represent the phylum affects the reconstructed phylogeny. Interestingly, different tree reconstruction methods (FastTree and IQ-TREE) identify different species as primary causes of the observed topological discordances although the effect of these species is detectable only in the reduced datasets phylogenies. These results suggest that random sampling of species representatives to build phylum- or domain-level phylogenies could be problematic unless many iterations of different random samples are completed. Overall, the trends observed across the two methods are similar showing that phylogenetic instability caused by different taxon sampling is not algorithm-dependent. However, IQ-TREE produces more stable phylogenies when only the backbone nodes are analyzed compared to FastTree and FastTree produces less discordant phylogenies when all internal nodes are compared. Although additional analyses need to be carried out, a preliminary interpretation of these initial results could suggest that IQ-TREE is more accurate in the reconstruction of deep internal nodes and FastTree is more accurate for shallower nodes. These results could, at least partially, explain the contrasting results obtained when the two methods have been compared in previous studies (Lees et al., 2018; Zhou et al., 2017).
When we tested for possible phylogenetic artifacts driven by alignment length, compositional biases and branch lengths we found no strong correlation with topological changes (Supplementary Section 1.3). However, multiple other factors have been proposed as potential sources of tree incongruences with permutated datasets and our results suggest that the species we identified as producing alternate trees are more likely to be sensitive to one or more of these sources of bias (Philippe et al., 2011; Som, 2015).
Irrespective of the samples of taxa used to reconstruct the Terrabacteria phylogeny, two Firmicutes (CTP and TSN) were consistently phylogenetically displaced outside of their phylum. This result supports previous findings based on large TOL analyses (Lang et al., 2013) and more specific phylum-level evolutionary characters that are different in these two species compared to other Firmicutes (Kunisawa, 2015; Zhang and Lu, 2015). For example, Lang et al. (2013) show differences in their placement based on reconstructed methods: in their 16S rRNA trees, these species group together and are part of a basal polytomy of Bacteria, while in their ML trees TSN is sister to Dictyoglomus and those two are sister to a clade of Thermotogae and CTP. Another study that focused on these species in particular showed an indel pattern unique to them, questioning their classification with the Firmicutes (Kunisawa, 2015). Given the mounting evidence of incongruences of CTP and TSN with the remaining Firmicutes, we agree with previous studies that suggested that their classification should be revised (Pavan et al., 2018).
The effect of CTP/TSN on the backbone phylogeny of Terrabacteria becomes clear when the relative position of DT is considered. When these two species are present, in most cases they are the closest relative of DT while in the absence of these two species, DT is closely related to ACT even when large numbers of species are used (Table 3, HIGH SS). Thus, the closest relative of DT varies between CTP/TSN and ACT across sampling and PSs with lower taxon sampling favoring a clustering different from the high taxon sampling results.
Although the trends we identified are generally applicable to all scenarios we tested, a few exceptions exist. For example, Chloroflexi has lower discord among permutations than DT and Actinobacteria and the variance within the discord is lower (Fig. 8, panels l and n). This is in agreement with the identification of molecular signatures within the Chloroflexi that show 28 conserved signature indels (CSIs) specific to different clades of Chloroflexi (Gupta, 2010). The evolutionary relationships between these CSIs indicate that the four different genera analyzed here form two clusters: Chloroflexus/Roseiflexus and Dehalococcoides/Dehalogenimonas (Gupta et al., 2013). While similarity between the members of each cluster is high, comparisons between clusters show lower similarity as seen also in our MID sampling permutations (Fig. 8, panel e). Our results also show that our large group permutations produced greater discord than permutations of our small groups for both HIGH and LOW SSs (Fig. 8, purple violin in panels j–l). This suggests that the presence of large number of taxa does not shield the group and the phylogeny overall from topological instability when the group size is reduced even by just a few taxa (10%) (Fig. 8: panel j). Moreover, permutations of ACT produce opposite results to permutations of DT when few species are used (Table 3, LOW SS) suggesting that deep relationship among clades can be easily affected by the choice of species made to represent each group, especially when only a few species are used.
![Discord among permutations and SSs. Discord among 120 trees is quantified per PS in each of the three phyla analyzed [red: Deinococcus–Thermus (DT), blue: Chloroflexi (CHF) and purple: Actinobacteria (ACT)] using RF distances. Scores were nRF for each phylum permutation. (a–i) Heatmaps of nRF scores corresponding to the given phylum permutations (top) and SSs (right). Each heatmap is calculated independently so that the colors are not directly comparable across panels (all values are provided in Supplementary Tables S29–S31). (j–l) Violin plots of nRF scores showing variance resulting from phylum permutations under a given SS (right). (m–o) Violin plots of nRF scores showing variance resulting from altered sampling under a given PS (top). Note the changes in y-axis scale in each violin plot](https://oup.silverchair-cdn.com/oup/backfile/Content_public/Journal/bioinformatics/35/19/10.1093_bioinformatics_btz121/2/m_bioinformatics_35_19_3608_f8.jpeg?Expires=1716372289&Signature=LrscizPC1okWSKT1Z1ze~r~RFF5Fkt~w-m7D1KIiNOjYZ-KKCtdbbaP6BoancxjbTBF3yXolx7ZweHcbgw2vEYFyASn0Rd9pDOOmz6jvSCMcBNfrftE4dBmaCqC4Qf2CkFruW-xAWXq8aW0zpVGKUUiF3RXfF13CtsXyfZ0DvFDeanv~jyIn2S~CzLyQxavUL7RjTl8r7cbffSdZ7~EhuKniyRwRZY-UEC53aGSWpNLXC8YLCrb4OQOnSfL7w8XwWhw3fUWYh7MS01aqzBUW7L7cN~6vHyKWm4cu~d~U~ggS6zyPU7Z2AchsNWOSSMD5osaDED3ApljTRj68SZv-eQ__&Key-Pair-Id=APKAIE5G5CRDK6RD3PGA)
Discord among permutations and SSs. Discord among 120 trees is quantified per PS in each of the three phyla analyzed [red: Deinococcus–Thermus (DT), blue: Chloroflexi (CHF) and purple: Actinobacteria (ACT)] using RF distances. Scores were nRF for each phylum permutation. (a–i) Heatmaps of nRF scores corresponding to the given phylum permutations (top) and SSs (right). Each heatmap is calculated independently so that the colors are not directly comparable across panels (all values are provided in Supplementary Tables S29–S31). (j–l) Violin plots of nRF scores showing variance resulting from phylum permutations under a given SS (right). (m–o) Violin plots of nRF scores showing variance resulting from altered sampling under a given PS (top). Note the changes in y-axis scale in each violin plot
4.2 Application to larger datasets
Based on these results obtained with a phylogeny of five phyla, we applied our procedure to one recent TOL composed of >120 phyla (Hug et al., 2016). In this case, our prediction was that we would observe less phylogenetic instability because the effect of permutating a single phylum ( DT, six species) would be diluted by the presence of many other groups. Instead, we found that the amount of destabilization of the phylogeny was 10-fold higher than in our smaller example (Supplementary Section 1.6). Thus, the effect of contrasting signals in a single, small phylum has far-reaching effects across a phylogeny.
Overall, these results point to the importance of testing phylogenetic stability even when using very large datasets. Inevitably, some clades are represented by fewer number of taxa compared to others and these are the most sensitive to phylogenetic destabilization produced by choice of species. In the absence of in-depth analyses, the phylogeny produced is driven by the signal present in the majority of the species, whether accurate or not, while alternate signals remain undetected. These alternative phylogenies could, however, provide important information on the evolutionary histories of specific lineages and genes and identifying the species that produce them is a necessary first step.
4.3 Implications
Despite significant advancements in computation and the feasibility of working with large genomic data, phylogenetic reconstruction efforts are unable to resolve the backbone phylogeny of many extant clades. Thus, a straightforward approach to test phylogenetic robustness under multiple scenarios is imperative, especially in very large datasets that require large computational times to analyze and are still sensitive to dataset changes. Although our study makes no claims on the ‘true’ phylogeny of the Terrabacteria superphylum, we showed that simply using a relative framework it is possible to determine the robustness of a dataset to taxon sampling. In particular, we have shown that it is important to iterate through many possible combinations of the same number of species to disentangle signals produced purely by the number of taxa from those produced by unique properties in each species genome or evolutionary history. These species can then become the target of further analyses to evaluate the presence of unique genomic properties, such as unique compositional biases or different gene evolution histories. This is especially important for clades represented by only a few genomes as any bias within these genomes will have a stronger overall weight on the reconstructed phylogeny of even distantly related groups. The presence of sparsely represented clades in prokaryotes is relatively common and is likely to remain so for the foreseeable future considering that over 70% of the sequenced and on-going sequencing projects represent only three phyla (Actinobacteria, Firmicutes and Proteobacteria) (Ncbi, 2017). Thus, many other phyla will remain represented at a much lower level and more susceptible to taxon sampling issues similar to those identified here.
Funding
This work was supported by the National Aeronautics and Space Administration (NASA) [NNX16AJ30G] and the Michigan Space Consortium.
Conflict of Interest: none declared.
References

