


Abstract
Data visualization is often regarded as a post hoc step for verifying statistically significant results in the analysis of high-throughput datasets. This common practice leaves a large amount of raw data behind, from which more information can be extracted. However, existing solutions do not provide capabilities to explore large-scale raw datasets using biologically sensible queries, nor do they allow user interaction based real-time customization of graphics. To address these drawbacks, we have designed an open-source, web-based tool called Systems-Level Interactive Data Exploration, or SLIDE to visualize large-scale -omics data interactively. SLIDE’s interface makes it easier for scientists to explore quantitative expression data in multiple resolutions in a single screen.
SLIDE is publicly available under BSD license both as an online version as well as a stand-alone version at https://github.com/soumitag/SLIDE.
Supplementary data are available at Bioinformatics online.
1 Introduction
Effective visual presentation of large-scale molecular datasets is challenging. A global visualization of the entire raw data can unveil overall trends across samples and discern useful patterns that may be overlooked after statistical filtering. Moreover, user-driven exploration into functionally related features (genes) allows users to quickly identify gene sets and biological functions relevant to their question. Although there are numerous open-source computational tools to visualize –omics data (Perez-Llamas and Lopez-Bigas, 2011; Saeed et al., 2003; Saldanha, 2004; Xia et al., 2013), the data volume that can be handled and the level of user interactivity remain limited (Supplementary Material).
Here, we present SLIDE, a web-based, interactive tool for visualizing -omics datasets. It allows users to interactively navigate through the entire data, visualized using heatmaps, at multiple resolutions. Hierarchical clustering in SLIDE uses highly optimized implementation (Müllner, 2013) that can scale up to very high-dimensional datasets (e.g. 50 000 genes with hundreds of samples, with data clustered within a few minutes). SLIDE comes integrated with biological pathway and Gene Ontology information for subsequent gene selection. Users can quickly create and maintain customized lists of genes, create independent sub-analyses or test enrichment of particular biological functions. These functionalities help users interpret the data at the quantitative expression level and at the function/pathway level, simultaneously. The tool has a convenient interface to input sample meta-data and can be used for various study designs such as group comparisons and time-course analysis.
SLIDE was designed as a Java driven web application to address cross-platform compatibility issues. SLIDE’s interface can be accessed from standard computers using a modern web browser. Detailed description of SLIDE’s architecture and implementation are provided in Supplementary Section S2.
2 Interactive visualization
The components in SLIDE can be grouped into feature-level module and group-level module. Feature-level modules visualize quantitative data for individual features (e.g. mRNA or protein level expression of genes), whereas group-level modules visualize biological functions or pathways enriched in user-selected gene sets. The two modules are bridged with connecting queries, enabling user’s smooth transition from one level to the other. We illustrate these capabilities using a whole lung mouse transcriptomics dataset from an influenza virus infection study with complex time-course design (Brandes et al., 2013) in Supplementary Section S3.
2.1 Feature-level visualization
SLIDE offers simultaneous views at multiple resolutions that can be used to navigate through the data. SLIDE’s web-based interface is shown in Figure 1. The control panel lists parameters for visualization and clustering that can be dynamically applied. The global view visualizes the result of agglomerative hierarchical clustering performed on the entire whole lung mouse transcriptomics data. The graphics can be customized in real-time by adjusting the parameters, such as heatmap color binning range to set a proper range of colors for intuitive graphics.
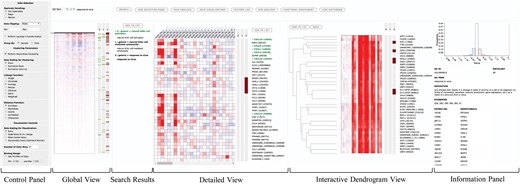
Feature-level visualization interface of SLIDE on a web browser. The global view heatmap visualizes the entire expression data matrix after hierarchical clustering of the features. The search panel on top of the global view allows real-time search and tagging of features. Search tags highlight features with horizontal (green and brown) stripes alongside the heatmaps, while the search terms are displayed in the search results panel. The detailed view heatmap gives a zoomed-in view of a portion of the entire data while in the interactive dendrogram view, the branches of the tree can be clicked to visualize a subset of the clustered data. See Supplementary Figure S1B for the group-level visualization interface
Once the global view is optimized with visualization parameters, users can perform multiple operations from there on, such as searching for specific genes by gene identifiers. Users can also search for genes associated with different pathways/ontologies using the search bar. The results are shown in the search results panel and simultaneously marked as colored stripes next to all heatmaps. Clicking on a search keyword highlights associated search tags (the search key ‘response to virus’ in Figure 1.) and displays its details in the information panel.
The detailed view shows the quantitative data of individual genes in a zoomed-in view. A slider attached to the heatmap in the global view allows users to scroll through the entire data and select the portion of the data to be visualized in detailed view.
In the interactive dendrogram view, the result of hierarchical clustering is shown as a dendrogram alongside the heatmap. The branches of the dendrogram can be clicked to visualize a subset of features to further explore the data in smaller and closely related clusters of genes. Additionally, users can maintain multiple lists of individual genes, called feature lists and create sub-analyses on separate tabs. Each sub-analysis creates visualizations in a new browser tab, where further querying and clustering can be performed. Multiple sub-analyses can be recursively created from the existing ones.
2.2 Group-level visualization
In –omics data, systems-level interpretation often requires analysis of enrichment of biological pathway/ontologies in selected gene sets. In SLIDE, this is referred to as group-level analysis. Users can initiate this analysis from feature-level visualization through the user-created feature lists. SLIDE uses the hypergeometric test to evaluate statistical significance of function enrichment in the selected feature lists. In group-level visualization, columns in the heatmap represent feature list and rows represent functional terms. Enrichment analysis can be performed for biological pathways from the ConsensusPathDB (Kamburov et al., 2011) and Gene Ontology terms (Ashburner et al., 2000). Supplementary Figure S1B shows enrichment levels of biological pathways in four user-created feature lists. SLIDE also allows users to customize group-level visualization in real-time by specifying various filtering parameters to remove irrelevant functional terms. In group-level visualization, search and tagging functionalities are also available for the biological functions.
Funding
Authors thank Hiromi Koh for critical reading of the manuscript and testing of the implementation. This work was supported in part by Institute of Molecular and Cell Biology, Agency for Science, Technology and Research, Singapore Ministry of Education (MOE2016-T2-1-001) and Singapore National Medical Research Council (NMRC-CG-M009).
Conflict of Interest: none declared.
References

