


Abstract
Plant breeding aims to improve current germplasm that can tolerate a wide range of biotic and abiotic stresses. To accomplish this goal, breeders rely on developing a deeper understanding of genetic makeup and relationships between plant varieties to make informed plant selections. Although rapid advances in genotyping technology generated a large amount of data for breeders, tools that facilitate pedigree analysis and visualization are scant, leaving breeders to use classical, but inherently limited, hierarchical pedigree diagrams for a handful of plant varieties. To answer this need, we developed a simple web-based tool that can be easily implemented at biological databases, called PedigreeNet, to create and visualize customizable pedigree relationships in a network context, displaying pre- and user-uploaded data.
As a proof-of-concept, we implemented PedigreeNet at the maize model organism database, MaizeGDB. The PedigreeNet viewer at MaizeGDB has a dynamically-generated pedigree network of 4706 maize lines and 5487 relationships that are currently available as both a stand-alone web-based tool and integrated directly on the MaizeGDB Stock Pages. The tool allows the user to apply a number of filters, select or upload their own breeding relationships, center a pedigree network on a plant variety, identify the common ancestor between two varieties, and display the shortest path(s) between two varieties on the pedigree network. The PedigreeNet code layer is written as a JavaScript wrapper around Cytoscape Web. PedigreeNet fills a great need for breeders to have access to an online tool to represent and visually customize pedigree relationships.
PedigreeNet is accessible at https://www.maizegdb.org/breeders_toolbox. The open source code is publically and freely available at GitHub: https://github.com/Maize-Genetics-and-Genomics-Database/PedigreeNet.
Supplementary data are available at Bioinformatics online.
1 Introduction
A deeper knowledge of genotypic relationships between plant varieties enables breeders to successfully select and cross varieties to create better, high-yielding plants that resist to biotic and abiotic stressors, such as drought, chemical imbalance (Cooper et al., 2014) and pests (Karjagi et al., 2017). Despite the importance of breeding that strives to produce food to feed a growing world population that has surpassed 7.5 billion people, breeders do not always have access to the best analysis and visualization tools due to biological complexities, curatorial barriers (Odell et al., 2017) and technical challenges: sequencing technologies allow fast identification of genotypes (i.e. their genetic constitution), but establishing exact genotypic relationships between pedigrees relies on highly empirical, and consequently imprecise, mathematical representations. Even when pedigree relationships between plant varieties are known, available visualization tools are limited, and breeders consequently rely on either hierarchical, layered diagrams limited in scope (similar to showing parental relationships in a family) or hand-drawn box-arrow illustrations. Some desktop visualization applications exists to fill this gap, such as GeneaQuilts (Bezerianos et al., 2010), Cranefoot (Makinen et al., 2005), GraphViz [http://www.graphviz.org] and Helium (Shaw et al., 2014), but desktop applications require system-specific installation and setup, and to the best of our knowledge, no visualization application specific to breeding is available as an easy-to-use web service for the general breeder community.
The need of web-based tools to represent pedigrees was shown in a recent survey (Sen et al., 2017) conducted among maize geneticists and breeders by the MaizeGDB model organism database (Andorf et al., 2016). The necessity for such a tool was in the top two requests from researchers [the other was a web-based tool for visualizing genotypes—for which we recently created a tool called SNPversity, and implemented it at MaizeGDB (Schott et al., 2018)].
2 Features
The MaizeGDB PedigreeNet page (Fig. 1a) has 5487 dynamically-generated relationships for a set of 4706 maize lines. This curated data was previously only available as text on the MaizeGDB Stock Pages. The webpage is organized with a brief description of the tool followed by several tools and features. The users have the ability to filter a breeding network by applying different criteria based on (a) plant variety provenance, (b) developers and (c) ordering availability. The users can also create a pedigree network by: 1) Finding the shortest path between two plant varieties in a breeding network, 2) Building a ‘first-neighbor’ network around a plant variety (i.e. varieties that are immediate parents or descendants of that variety) and 3) Building a network around the lowest common ancestor of two varieties (i.e. the lowest variety that has both of these two varieties as descendants). Examples are provided for each tool to help the first-time users to demonstrate PedigreeNet’s capabilities.
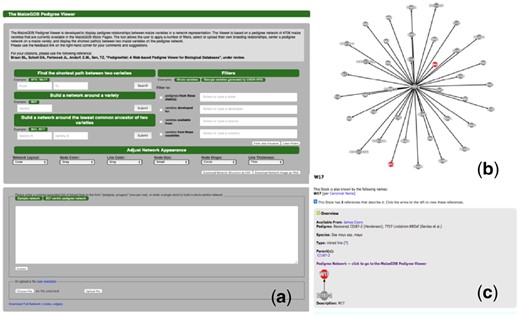
(a) The front page of PedigreeNet. (b) An example pedigree network. The network representation is displayed in the box in PedigreeNet, (c) a first-neighbor network view around W17 embedded on a MaizeGDB Stock page
As a use case, let us assume that a researcher found a region in a variety that controls an agronomically important phenotype (such as drought resistance), and would like to know which other varieties that are not yet genotyped or sequenced may have that region. Such knowledge would be important because this will allow the researcher the ability to cross all these varieties that contain that region with the variety he/she would like to improve, with the aim of imparting the drought-resistant genes in that region to the variety of interest. To accomplish this aim, he/she will want to look at the immediate progenies/pedigrees of that variety through building a first-neighbor network around it. If the researcher knows that two varieties in fact have the same region (e.g. B41 and Mo17), then he/she can either find the shortest path between them to identify other candidate varieties that may have this region, or she can identify the lowest common ancestor between them to investigate whether the region propagated through generations. In the latter case, after the user submits the request to find the lowest common ancestor between B41 and W17, PedigreeNet will then display a network view shown in Figure 1b, powered by a Cytoscape JavaScript plugin (Franz et al., 2016). Here, the plant varieties are represented as nodes (i.e. circles), and the breeding relationships as edges (i.e. lines). The nodes B41 and W17 are painted in red to facilitate visual identification. In this example, the network is displayed in the default ‘random’ view, however several other options are available to users to adjust the network layout such as random, circle, grid and concentric. The detailed descriptions and examples of these layouts can be found on the documentation pages at http://js.cytoscape.org.
Although PedigreeNet itself does not provide information about plant varieties, when a node is clicked, a popup window appears with the appropriate link to MaizeGDB Stock Page with more information about that plant variety, along with a PedigreeNet network view showing the first-neighbor network around that plant variety (Fig. 1c). PedigreeNet allows custom datasets to be uploaded as pairwise comma-separated lists of entries, in which each row represents a pedigree relationship. Alternatively, data can be directly entered in the text box located at the bottom of the PedigreeNet front page (Fig. 1a). Users can also download the customized network representation shown in the viewer area as a high-quality image file to use in their presentations and publications.
3 Implementation
The software installation has been developed and tested using the CentOS 6.6 operating system. The server backend runs on PHP 5.3.3, that can be installed on many operating systems, including Windows, Mac OSX and Linux. The backend database is PostgreSQL. The interface is functionalized with Javascript with the JQuery library (https://jquery.com/) with the JQuery UI plugins (https://jqueryui.com/). The network is created with Cytoscape.js (http://js.cytoscape.org/).
Acknowledgements
We thank the maize community and to MaizeGDB team who provided feedback. USDA is an equal opportunity provider and employer.
Funding
This work was supported by United States Department of Agriculture, Agricultural Research Service (Projects 5030-21000-068-00D and 2030-21000-024-00D) by funding salaries and open access charges. The funding agency played no role in the design of the study and collection, analysis, and interpretation of data and in writing the manuscript.
Conflict of Interest: none declared.
References

