


Abstract
Complex diseases often involve a wide spectrum of phenotypic traits. Better understanding of the biological mechanisms relevant to each trait promotes understanding of the etiology of the disease and the potential for targeted and effective treatment plans. There have been many efforts towards omics data integration and network reconstruction, but limited work has examined the incorporation of relevant (quantitative) phenotypic traits.
We propose a novel technique, sparse multiple canonical correlation network analysis (SmCCNet), for integrating multiple omics data types along with a quantitative phenotype of interest, and for constructing multi-omics networks that are specific to the phenotype. As a case study, we focus on miRNA–mRNA networks. Through simulations, we demonstrate that SmCCNet has better overall prediction performance compared to popular gene expression network construction and integration approaches under realistic settings. Applying SmCCNet to studies on chronic obstructive pulmonary disease (COPD) and breast cancer, we found enrichment of known relevant pathways (e.g. the Cadherin pathway for COPD and the interferon-gamma signaling pathway for breast cancer) as well as less known omics features that may be important to the diseases. Although those applications focus on miRNA–mRNA co-expression networks, SmCCNet is applicable to a variety of omics and other data types. It can also be easily generalized to incorporate multiple quantitative phenotype simultaneously. The versatility of SmCCNet suggests great potential of the approach in many areas.
The SmCCNet algorithm is written in R, and is freely available on the web at https://cran.r-project.org/web/packages/SmCCNet/index.html.
Supplementary data are available at Bioinformatics online.
1 Introduction
With the development of high-throughput technologies and reduction in costs, different quantitative omics measurements on the same subjects are becoming more common (Hasin et al., 2017). For example, there are large consortia such as the Genotype-Tissue Expression project and The Cancer Genome Atlas (TCGA) to study regulation and human disease. To study complex traits within these studies and others, there may be a variety of available omics measurements, such as gene expression, methylation and metabolite abundance. By combining two omics data types with phenotype information, one may find more complex and subtle relationships with the traits, outcomes or disease of interest. Prediction methods are useful for identifying the most informative features among the omics studies that are predictive of the phenotype. Network-based methods are complementary approaches that allow for the discovery of integrated networks for gene regulation, metabolism and other processes that influence an individual phenotype.
Research in single omics networks is often based on co-expression of RNA expression levels of protein-coding genes (Saelens et al., 2018). One popular expression-based network reconstruction method is weighted gene co-expression network analysis (WGCNA) (Langfelder and Horvath, 2008). It was originally designed for microarray expression measurements. More recently, it has been extended for sequencing expression data, as well as other data, such as proteomic and metabolomic (DiLeo et al., 2011; Langfelder et al., 2016; Shirasaki et al., 2012; Zhang et al., 2013). While WGCNA has gained popularity, it was originally designed for a single data type. However, WGCNA has recently been extended for integrating multiple data types (Mamdani et al., 2015), by first constructing relevant homogeneous networks in parallel and then combining the separate networks. However, it is not clear how to best combine networks based on different data types. Other integrative extensions include incorporating additional omics data to identify candidate regulators of gene-expression modules (Bonnet et al., 2015) or integrating different expression datasets (e.g. mRNA and non-coding RNA) (Li et al., 2017; Miao et al., 2016).
Another popular expression-based network reconstruction approach is modeling gene interactions with Gaussian graphical models (GGMs) (Dobra et al., 2004). Under the assumption of multivariate normality of gene expression data, the GGM uses the inverse of the gene covariance matrix as a measure for gene associations. Since the GGM does not naturally integrate multiple data types, similar to WGCNA, it is also less used in recovering multi-omics networks. Other common methods for gene network reconstruction include (probabilistic) boolean network, (dynamic) Bayesian networks, ordinary differential equations and neural networks (Chai et al., 2014). While each of those methods has its own strength, such as the ability to integrate prior knowledge, to handle time-series expression data or to capture nonlinear interactions, all of those methods are not easily scalable (Chai et al., 2014). It is worth noting that none of above methods is designed for building multi-omics networks with a priori information about a (quantitative) phenotype.
Multi-omics analysis methods, reviewed in Huang et al. (2017), can primarily be categorized into supervised or unsupervised approaches. Within those categories, the goal of supervised (or predictive) methods is often to develop a parsimonious model to predict the outcome of interest, which tends to prioritize prediction performance over interpretability for understanding the complex underlying biological processes. While many of these methods may consider interactions about omics features, network inference across data types is not the primarily goal (Boulesteix et al., 2017; Broom et al., 2012; Chaudhary et al., 2018; Kim et al., 2013), or is only considered as a final step with a small set of features found with independent analyses of each omics type (Acharjee et al., 2016). Furthermore, some methods focus on binary phenotypes (e.g. disease versus control) and may not be generalizable to continuous phenotypes (Oliveira et al., 2018). For unsupervised methods, phenotypes are not considered in the process of identifying features of interest, and primarily integrate data for the purpose of clustering omics features or samples in an unsupervised way (Lock et al., 2013; Mo et al., 2013; Wang et al., 2014). Other supervised or unsupervised methods incorporate known pathways or protein/genetic inter- action information, but are limited by the quality and comprehensiveness of this available information (Vaske et al., 2010). But are limited by the quality and comprehensiveness of this available information. In summary, unsupervised omics integration methods do not consider phenotypes a priori, while many supervised methods do not consider interactions between omics features.
We propose a canonical correlation analysis (CCA) based approach, sparse multiple canonical correlation network discovery (SmCCNet), that simultaneously integrates multiple omics profiles and phenotype information to build interpretable networks that model the underlying mechanisms. First introduced by Hotelling (1936), CCA investigates the relatedness between two sets of variables. There have been many applications in biology and medicine in the last decade, including pharmacogenomics (Chalise et al., 2012), microbiome investigations (Chen et al., 2013), cancer studies (Larson et al., 2014), medical image analysis (Lin et al., 2014; Vounou et al., 2010) and biomarker discovery (Rousu et al., 2013; Waaijenborg et al., 2008). Almost all of these focused on extending CCA to high-dimensional data and integrating two data types. Witten and Tibshirani (2009) proposed an extension to incorporate phenotype data, but focused on categorical traits. They also proposed another CCA extension for integrating more than two quantitative data types in the same work, but they did not recommend it for incorporating phenotypes (Witten and Tibshirani, 2009). Other CCA methods are less automated for network inference (Rohart et al., 2017).
To our knowledge, there have not been any CCA extensions specifically designed for integrating genomic data and quantitative traits for the purpose of deriving phenotype-specific multi-omics networks in a robust and automated manner. Our proposed method can be used to integrate three or more quantitative data types simultaneously. It is particularly suitable for incorporating information from quantitative traits. We add a subsampling scheme (Wang et al., 2015) to avoid specifying the number of subnetworks a priori. We motivate the use of SmCCNet by focusing on the identification of miRNA–mRNA networks. miRNAs typically negatively regulate gene expression through mRNA degradation and/or translation repression, subsequently controlling many cellular mechanisms. Modeling miRNA–mRNA networks not only helps to better understand the underlying biological mechanism, but also enables the identification of therapeutic targets at the miRNA level.
2 Materials and methods
2.1 CCA and sparse CCA
2.2 Sparse multiple CCA
Suppose that besides X1, X2, we have also a phenotype of interest Y that has been measured for the same n subjects. As mentioned earlier, it is beneficial to investigate the biological mechanism that is specific to such a phenotype. One way to incorporate such information is to prioritize omics features (e.g. miRNA and mRNA) based on their individual correlation with the phenotype. Witten and Tibshirani referred to this as a semi-supervised version of SCCA (SsCCA) and demonstrated with categorical data that SsCCA is more sufficient in feature selection than the traditional SCCA method (Witten and Tibshirani, 2009).
The unweighted version (i.e. a = b = c), is a special case of sparse multiple CCA (SmCCA) introduced in Witten and Tibshirani (2009). SmCCA can be used to integrate three or more data types simultaneously. The weighted version (i.e. a, b, c are not all equal), can be particularly useful when the phenotype Y has a weaker correlation with omics data compared to correlation between omics data, e.g. X1 and X2. The weights can be used to prioritize correlations with the phenotype data rather than between omics data types. SsCCA does not consider these types of weights, as omics features are prioritized separately by the phenotype as a first step and the phenotype is not part of the objective function [Equation (2)].
2.3 SmCCNet
The SmCCNet framework combines SmCCA and a feature subsampling scheme to create robust network construction (Fig. 1). Step I of the SmCCNet algorithm is to identify the best penalty parameters (Fig. 1). These parameters c1, c2 control the proportion of omics features with non-zero canonical weights, in other words the sparsity level of selected features. We choose those parameters through a K-fold cross validation (CV) (see Supplementary Section S1.1) with prediction error on the pseudo canonical correlation [Supplementary Equation (S1)]. Step II generates robust canonical weights through SmCCA. Those weights indicate which features contribute the most to the set correlation. For each randomly subsampled data, a relationship matrix A is constructed based on the canonical weights as following , where . The ijth entry Aij measures the relatedness of the ith and jth features. Taking the average over all such A matrices, and rescaling it to have a maximum relatedness of 1, we arrive at a similarity matrix that describes the connections of omics features taking into account the phenotype correlation. In Step III, using the complete linkage method, a hierarchical tree can be constructed based on . We apply a liberal height threshold (1) to the hierarchical tree and trim off singletons and clades with only one data type. The intent of this step is to narrow our focus to miRNA–mRNA relationships. The remaining clades are used to construct relevant subnetworks (Fig. 1). We will refer to the resulting subnetworks as full modules. To focus on the stronger network connections, we apply an edge threshold d to the similarity matrix, and remove all edges with weights less than d. Subsequently, the network nodes (features) without any edge are also removed. We will refer to the post-edge-cut networks as trimmed modules.
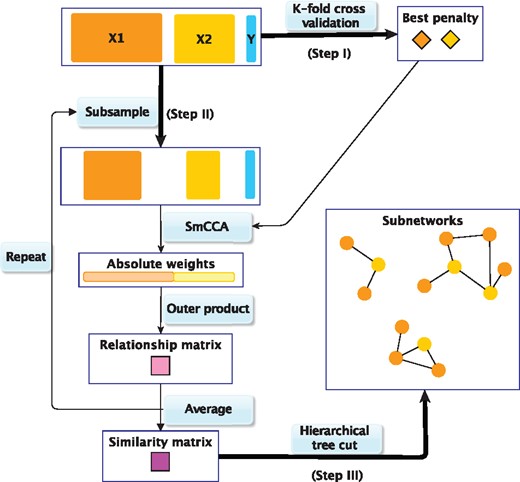
SmCCNet work flow overview. X1, X2 and Y indicate mRNA expression levels, miRNA expression levels and phenotype measurements, respectively. Step I: Identify the best penalty pair through a K-fold CV. Step II: Randomly subsample (omics) features without replacement, apply SmCCA with the chosen penalties and compute a feature relationship matrix for each subset. Repeat the process many times and define the similarity matrix to be the average of all feature relationship matrices. Step III: Apply a hierarchical tree cut to the similarity matrix to find the multi-omics networks
2.4 Simulations
The key simulation parameters and settings are described in Supplementary Section S1.2.
To create realistic simulations, we generated background data without any feature–phenotype associations using two real multi-omics datasets by independently permuting subjects and feature order within each omics dataset. The first multi-omics dataset came from a large recombinant inbred mouse panel that had been bred from reciprocal crosses between the Inbred Long Sleep(ILS) and Inbred Short Sleep (ISS) strains, called the ILSXISS (LXS) panel (n = 57 strains, i.e. subjects). The second multi-omics dataset came from TCGA breast invasive carcinoma project (n = 358 subjects). The LXS- and the TCGA-based backgrounds represent small and large sample size scenarios, respectively. See Supplementary Section S1.3 for more details on the two background datasets. Starting with a background dataset, if an mRNA was simulated to be targeted by a miRNA, its expression was replaced by the value generated using Supplementary Equation (S2). The trait value Pheno was generated using Supplementary Equation (S3). Note that the background dataset determined sample size (n) and total feature numbers (p1, p2). With each background dataset, we considered four scenarios to compare method performance:
I. Naïve: following Equation (4), 2 groups of 1 miRNA → 5 mRNAs → Pheno.
II. Realistic: similar to Case I, but with 2 out of 5 mRNAs → Pheno.
III. MoreGroup: similar to Case II, increase the group number G to 5.
IV. Noisy: similar to Case II, increase the mRNA variance .
The simulation parameter values are listed in Supplementary Table S1. For each case, we used a 5-fold CV for determining the LASSO penalties (Fig. 1, Step I). Wang et al. (2015) argued that the subsampling proportion level is not critical and suggested 70% for genes. Since the number of miRNAs is much smaller, we chose the subsampling proportions to be 70% and 90% for mRNA and miRNA, respectively. The subsampling procedure (Fig. 1, Step II) was repeated 1000 times. For each simulation case, we applied not only SmCCNet, but also two competing methods: WGCNA and SsCCA (see Supplementary Section S1.5).
2.5 Chronic obstructive pulmonary disease data
These data were generated as part of the COPDGene Study, which is a multicenter genetic epidemiology study to identify genetic factors associated with chronic obstructive pulmonary disease (COPD) (Regan et al., 2011). The miRNA and mRNA high-throughput sequencing data were from peripheral blood samples. Details on the RNA extraction, expression quantification, filtering and normalization can be found in Supplement Section S2.1. The final dataset consisted of 414 miRNA and 5001 mRNA, in 27 subjects. Based on the Global Initiative for Obstructive Lung Disease (GOLD) criteria, the samples include 13 controls (current and former smoker without COPD) and 14 cases (9 severe cases with GOLD 3 and 5 very severe cases with GOLD 4). There were two quantitative phenotypes of interest: forced expiratory volume during the first second as a percent of the predicted normal based on gender, age, ethnicity and height (FEV1pp), and chest computed tomography scan detected extent of emphysema (percent emphysema), which was measured by the percentage of lung voxels below −950 Hounsfield units. FEV1pp reflects the severity of airflow limitation or airflow obstruction. It is a commonly used measurement of lung function in COPD. Emphysema is characterized by destruction of the air sacs in lungs (alveoli). Due to high skewness, we applied a log-transformation to the percent emphysema measurements.
We applied SmCCNet to miRNA and mRNA data with phenotypes, FEV1pp and percent emphysema. The sparse penalty parameters c1, c2 were chosen through a 4-fold CV (Fig. 1, Step I), due to the small number of subjects. The subsampling procedure was repeated 1000 times (Fig. 1, Step II). The proportions of miRNA and mRNA features subsampled were 90% and 70%, respectively. The unweighted version of SmCCNet [Equation (3)] was used since the correlations between omics features and the correlations between phenotypes and omics features are in a similar range.
2.6 TCGA breast cancer
These data were obtained from the TCGA breast invasive carcinoma project and the only quantitative phenotype with sufficient number of subjects was survival time. To demonstrate SmCCNet on this public dataset, we chose to focus on the 80 female deceased subjects with positive response to estrogen and progesterone, who had both miRNA and mRNA expression data. The phenotypic trait of interest was overall survival months. Details on the filtering and normalization can be found in Supplement Section S2.2. Unlike the COPD data, the range for the feature–phenotype correlations is much smaller than the range for between-feature correlations. To prioritize the feature–phenotype correlations, we applied the weighted version of SmCCA [Equation (3)] in the SmCCNet method, and set the weights . The sparse penalties were chosen through a 5-fold CV (Fig. 1, Step I). The subsampling procedure was repeated 1000 times (Fig. 1, Step II). The proportions of miRNA and mRNA features subsampled were 90% and 70%, respectively.
To evaluate results for the COPD and TCGA data, we assess how each identified module is correlated with the phenotype by either (i) calculating the correlation of the phenotype with the first principal component (PC1) of the matrix of mRNA and miRNA in the module or (ii) calculating the correlation between the phenotype and each individual miRNA or mRNA in the module separately.
3 Results
3.1 Simulations
The four simulation cases, Naïve (I), Realistic (II), MoreGroup (III) and Noisy (IV), allow us to compare methods under different scenarios. For each simulation, we examine the miRNAs and mRNAs in the final modules and compare them with underlying truth for prediction success. The performance of the simulations is measured by the area under the curve (AUC) of the precision–recall curve (Table 1). For the LXS-based simulations, SmCCNet has the best performance, SsCCA follows and WGCNA performs the worst. In one Naïve (I) case, WGCNA fails to identify any Pheno-related multi-omics networks. The corresponding AUC is recorded as 0. As the complexity of the underlying structure increases [from Naïve (I) to Noisy (IV)], the performance of all three methods follows a decreasing trend and the advantage of SmCCNet over the other two methods generally becomes more pronounced. For the TCGA-based simulations, all three methods show similarly strong performance for the Naïve (I) and Realistic (II) cases, indicating the benefit of large sample size. In the TCGA MoreGoup (III) case, WGCNA out-performs the two CCA-based methods. In additional simulations (not shown here), we observed that even with the LXS background, with larger number of phenotype-related groups (e.g. 10) is assumed, WGCNA performs the best. For the TCGA Noisy (IV) case, WGCNA fails to identify any Pheno-related multi-omics network for any of the 10 simulations. As the relationship between the miRNA and mRNA becomes noisier (IVa to IVc), SmCCNet has an advantage over ScCCA. In summary, as module complexity increases WGCNA shows significant decreased AUC compared to the other methods. SmCCNet and SsCCA are similar for some scenarios but SmCCNet has improved performance over SsCCA with smaller or noisier datasets.
Simulation performance comparison
| Median AUC (interquartile range) | ||||
|---|---|---|---|---|
| SmCCNet | SsCCA | WGCNA | ||
| LXS | I | 0.968 (0.798, 0.997) | 0.791 (0.738, 0.986)** | 0.749 (0.749, 0.999)** |
| II | 0.967 (0.731, 0.993) | 0.743 (0.725, 0.993)*** | 0.748 (0.748, 0.749)** | |
| III | 0.804 (0.776, 0.885) | 0.691 (0.654, 0.783)* | 0.697 (0.622, 0.770)* | |
| IV | 0.793 (0.727, 0.872) | 0.761 (0.708, 0.810)** | 0.499 (0.499, 0.645)* | |
| TCGA | I | 0.999 (0.992, 1.000) | 0.999 (0.996, 1.000) | 1.000 (0.999, 1.000)** |
| II | 0.999 (0.999, 0.999) | 0.999 (0.999, 0.999) | 0.999 (0.999, 0.999) | |
| III | 0.927(0.914, 0.979) | 0.949 (0.927, 0.979) | 0.996 (0.996, 0.997)** | |
| IVa | 0.983 (0.960, 0.999) | 0.971 (0.899, 0.985) | 0 (0, 0) | |
| IVb | 0.917 (0.876, 0.996) | 0.849 (0.760, 0.937)** | 0 (0, 0) | |
| IVc | 0.910 (0.870, 0.987) | 0.838 (0.750, 0.900)*** | 0 (0, 0) | |
Note: The performance is recorded by the AUC of the precision–recall curve for Cases I, Naïve; II, Realistic; III, MoreGroup; IV, Noisy. For TCGA, we explore increasing variances σ1 for the Noisy scenario, which are labeled a, b, c (Supplementary Table S1). There are 30 repeated simulations for each LXS scenario and 10 replicates for TCGA scenarios. The median and the interquartile range of AUCs are compared. An AUC value of 0 corresponds to no Pheno-relevant multi-omics networks identified. Pairwise Wilcoxon test has been applied to compare SsCCA and WGCNA AUC results to SmCCNet.
P-value < 0.001.
0.001 P-value < 0.05.
0.05 P-value < 0.10.
Additional simulations (not shown here) investigate more naïve cases [no additional groups following Supplementary Equation (S4)] and complex cases with smaller noise (e.g. ). We see that SmCCNet, SsCCA and WGCNA all had high AUC for the scenario of smaller noise. This indicates that all three methods provide accurate results when the signal to noise ratio is high.
3.2 COPD application
We applied SmCCNet to 414 miRNA and 5001 mRNA from the COPDGene study with phenotype FEV1pp. The optimal mRNA and miRNA penalty parameters are (25.44, 2.51) (Fig. 2a), which favor multi-omics modules (include both miRNAs and mRNAs) with few miRNAs and many mRNAs. The FEV1pp results include 12 connected miRNA–mRNA modules before filtering the network edges by the strength of relatedness. The number of miRNA and mRNA within each of those modules range from 1 to 12 and from 8 to 1182, respectively. The miRNA/mRNA ratio ranges from 0.010 to 0.143, indicating that the number of mRNAs is always more than miRNAs. In the 12 full modules, we identify 14 694 negative connections between miRNA and mRNA. Out of those connections, 147 miRNA–mRNA targets have been validated and 988 additional miRNA–mRNA targets have been predicted using MultiMir Version 1.1.0 (Ru et al., 2014). Compared to SsCCA, SmCCNet identified a higher percentage of predicted and validated miRNA–mRNA target pairs (Supplement Section S3.1). For each module, we computed its correlation with FEV1pp through the first PC1 (Fig. 2b). Modules 2, 3, 6, 8 and 10 have a strong correlation (P-value < 0.05). Furthermore, there is a wide spread of pairwise correlation values for the individual features in the 12 modules. All the modules with low correlations with FEV1pp (P-value > 0.1) include relatively many miRNA and mRNA features with very small individual correlations with the phenotype (around 0). However, the modules with higher correlation with the phenotype still contain some features with low individual correlation with the phenotype. This demonstrates the SmCCNet advantage of keeping features that might be missed by a pairwise search.
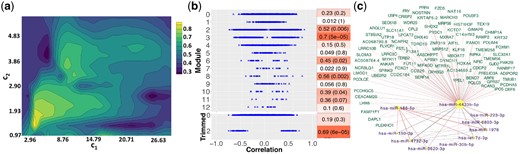
FEV1pp results. (a) Total prediction error contour. The x- and y-axes indicate LASSO penalties considered for mRNA and miRNA, respectively. Blue to yellow scale indicates increasing of total prediction error. (b) Correlations with FEV1pp for full (top) and trimmed (bottom) modules. The mRNAs are circles and the miRNAs are triangles. All features excluded in identified modules are grouped as Module 0. Heatmap indicates module–trait correlations (with P-values in parentheses). (c) Trimmed module network. Negative edge is in red; positive edges are in gray. Width of the network edges indicates the connection strength. Yellow nodes with purple labels are miRNAs; magenta nodes with green labels are mRNAs. Node size corresponds to the number of edges connections
To better visualize the top (strongest) connections in the modules, we applied the absolute edge threshold value 0.1. Only Module 2 contains edge connections stronger than 0.1. Post edge trimming, 10 miRNAs and 97 genes remain. The module–trait correlation has improved from 0.52 to 0.69 (P-value = 6e-05). Most individual miRNA or mRNA with weak feature–trait correlations are dropped (Fig. 2b). Yet, some features with moderate individual correlations with the phenotype are also removed. This suggests that applying a moderate network edge threshold helps to remove noise. In the top identified FEV1pp-related miRNA–mRNA subnetwork (trimmed Module 2), miR-4433b-5p is a hub, connected to all 97 genes and 10 miRNAs (Fig. 2c). miR-4433b-5p has been recently identified as a biomarker for multidrug-resistance tuberculosis (Wang et al., 2016a). It shows a strong network connection to miR-186-5p, which has been found to be upregulated in COPD patients in the Li ethnic population (Ding et al., 2017). The hub, miR-4433b-5p, has also a moderate connection to miR-223-3p, which controls the expression of histone deacetylase 2, a recently identified axis in COPD (Sundar et al., 2018). Levels of miR-223 are induced by interleukin-1β and tumor necrosis factor-α. It is known to be upregulated and inversely correlated with HDAC2 expression in COPD subjects and it is associated with airway obstruction, which suggests that miR-223-3p could contribute to airway inflammation (Maes et al., 2016). Other known COPD-related miRNAs that are identified include let-7d, miR-150-3p and miR-3620-3p (Christenson et al., 2013; Wang et al., 2016b).
For both trimmed and untrimmed FEV1pp networks, we found marginal enrichment of the Cadherin pathway (unadjusted P-value < 0.05) using the PANTHER Classification System Version 13.1 with PANTHER homo sapiens whole-genome gene list as background dataset (Mi et al., 2019). The genes in the pathway that are in the trimmed network include Frizzled Class Receptor 5 (FZD5), Follistatin-like 1 (FSTL1), protocadherin gamma subfamily C 5 (PCDHGDC5) and protocadherin alpha-5 (PCDHA5), which serve as important components in Cadherin and Wnt pathways (MacDonald et al., 2009; Nelson and Nusse, 2004). Recent evidence demonstrates that there are many connections among Cadherin, β-Catenin and Wnt pathways (Nelson and Nusse, 2004). For example, FZD5 protein serves as the receptor for the Wnt5A ligand to activate the β-Catenin canonical signaling pathway, which leads to the activation of nuclear accumulation of β-Catenin and activation of Wnt target genes (Grumolato et al., 2010). Several studies have demonstrated that aberrant Wnt/Catenin signaling plays an important role in the development and progression of COPD (Jiang et al., 2016), where it leads to epithelial-to-mesenchymal transition, pulmonary fibroblast proliferation and airway remodeling (Shi et al., 2017). It was also reported that FSTL1 is dysregulated in patients with pulmonary hypertension related to COPD (Zhang et al., 2017). Reactivation of Wnt/β-Caternin signaling could lead to airspace enlargement with a restored alveolar epithelial structure in emphysema COPD models (Shi et al., 2017).
As another illustration of the method, we applied SmCCNet to a different phenotype (percent emphysema) but on the same miRNA and mRNA expression data (Supplement Section S3.2). We identified two trimmed modules with strong module–trait correlations (). All features in the trimmed modules exhibit moderate or strong pairwise correlation to percent emphysema (Supplementary Fig. S3c). One notable miRNA in the resulting networks is miR-150-3p, which is known to be upregulated with increasing emphysema severity (Christenson et al., 2013). However, there is no pathway enrichment for genes identified in the percent emphysema networks.
3.3 TCGA breast cancer
We also applied SmCCNet to the TCGA breast cancer data with 348 miRNA, 7978 mRNA and uncensored survival time. The CV process proposed the penalty pair (36.61, 5.13) for mRNA and miRNA, respectively. Before thresholding network edges, there are eight connected miRNA–mRNA modules. The number of miRNA and mRNA within each module ranges from 1 to 42 and 5 to 2482, respectively. The ratio of the number of miRNA to the number of mRNA in a module ranges from 0.02 to 0.2, indicating that there are more mRNA than miRNA in each module. In the eight full modules, we find 55 584 negative miRNA–mRNA connections. Of these, 75 of the miRNA–mRNA targets have been validated, and 1176 targets have been predicted using MultiMir (Ru et al., 2014). Out of the eight full modules, only Module 1 shows strong correlation with survival time (P-value = 0.01, Supplementary Fig. S4a). The individual correlations of mRNA and miRNA with phenotype have a wide range. We found enrichment of five PANTHER pathways (unadjusted P-value < 0.05): interferon-gamma signaling pathway (INFg), ionotropic glutamate receptor pathway (iGluRs), 2-arachidonoyglycerol biosynthesis, toll receptor signaling pathway (TLRs) and thyrotropin-releasing hormone receptor signaling pathway. With pronounced anticancer activity, INFg induces tumor suppressors (Clarke et al., 2004), blockade of iGluRs has been proposed for cancer treatment (Ribeiro et al., 2017) and TLRs has also been discussed as a part of effective breast cancer treatment strategies (La Creis et al., 2013).
To better visualize the top connections, we trimmed the modules with edge threshold 0.1. Only Module 1 contains edge strengths >0.1. The individual feature–phenotype correlations for the trimmed module indicate that many features with weak feature–phenotype correlations in full Module 1 have been dropped (Supplementary Fig. S4a). The trimmed Module 1 include 36 miRNAs and 314 genes. The module–trait correlation for Module 1 has increased from 0.29 to 0.37; the P-value has improved to 8e-04. The hub, miR-148, connects to all other 349 features in the trimmed module (Supplementary Fig. S4b). Aberrant hypermethylation has been associated with miR-148 in a series of breast cancer specimens (Lehmann et al., 2008). The feature with second most connections, miR-381, has been linked to metastatic breast cancer, which is one of the main causes of cancer death in women (Farré et al., 2018). Out of the 36 miRNAs identified, 29 of them have been found to be associated with breast cancer tumor growth and metastasis or survival outcome through a PubMed search (Al-Khanbashi et al., 2016; Raychaudhuri et al., 2017).
4 Discussion
We presented a novel network approach SmCCNet, for integrating multiple omics data types with a quantitative phenotypic trait, and constructing phenotype-specific multi-omics networks. To evaluate its performance, we compared SmCCNet to a popular gene network analysis approach: WGCNA, and another CCA-based integration method: SsCCA. Through simulations, we have shown that the SmCCNet method has the best overall performance under more complex scenarios (e.g. Noisy). One explanation for why SsCCA has a slightly worse performance than SmCCNet is that SsCCA does not fully utilize the phenotype information. It only excludes features with weak correlation with phenotype, but does not include the magnitude of feature–phenotype correlations in the network construction. As for WGCNA, it identifies miRNA–mRNA modules first, and then relates them to phenotype by module–trait correlation through the first PC1. A WGCNA module may include extra features that are not relevant to given phenotype. Its PC1 can be biased by the extra features and result in a small module–trait correlation (P-value > 0.05), in which case the entire module will be excluded for the final result. As seen in the simulation cases, WGCNA may fail to identify any phenotype-related multi-omics networks. Our simulations cover both small (LXS) and large (TCGA) sample size settings. While larger n guarantees higher statistical power, in reality the number of subjects (sample size) is often restricted by various factors. As an illustration on real data, we applied our method to both a small (COPD) and a large dataset (TCGA). Run times on these two datasets for fixed penalty were <30 min for all methods. WGCNA is notably faster and not significantly affected by the sample size or features, while SsCCA and SmCCNet are slower when there is an increase in the sample size or features, respectively (Supplementary Table S2 and Section S3.4).
Although our method targeted phenotype-related modules, it is unlikely that all modules identified are related to the phenotype as suggested by Figure 2b. There are two potential contributors to the excess modules. If the sparse canonical correlation between the miRNA and the mRNA groups are very strong but their correlations with the phenotype are weak, then the algorithm might still keep the module, since the total canonical correlation could be large. The other potential reason for excess modules is noise. Some of the network edge weights are nonzero but close to zero. Setting an edge threshold is one way to de-noise. It could also be helpful for identifying the strongest connections in the networks. The SmCCNet algorithm incorporates phenotype information through SmCCA. The unweighted SmCCA version [Equation (3), a = b=c] maximizes the sum of three pairwise canonical correlations among miRNA, mRNA and phenotype. In some cases, it may be necessary to prioritize feature–phenotype correlations. Since the correlation ranges for the simulations and the COPD application are comparable, we applied the unweighted version of SmCCNet. The TCGA application, however, has much weaker feature–phenotype correlations. Therefore, for the TCGA application, the weighted version [Equation (3)] is more suitable for the objective function since it allows increasing the weights for the canonical correlations that include the phenotypes. The choices of weights a, b, c should depend on prior knowledge and the study goal. As a general guideline, we suggest to first check the ranges of between-omics correlation and feature–phenotype correlation. If the latter is relatively small, we recommend using the weighted version and increasing the values of b and c.
SmCCNet allows the user to include multiple phenotypes, which may not be available for supervised phenotype prediction methods (Acharjee et al., 2016; Boulesteix et al., 2017; Broom et al., 2012; Chaudhary et al., 2018; Kim et al., 2013). Other unsupervised-omics methods are focused on dimension reduction or subtyping, and not network inference (Lock et al., 2013; Mo et al., 2013). Furthermore, SmCCNet is specifically designed for continuous phenotypes. For categorical variables, we recommend methods such as (McKenzie et al., 2016; Oliveira et al., 2018; Tesson et al., 2010). Other advantages of SmCCA include the ability to include more than two omics datasets by expanding the objective function. With more omics datasets, there may be the potential to focus on correlations between omics datasets, with less emphasis on the phenotype–omics correlations due to the increase in the combinations of possible pairs of omics datasets. However, the user can adjust the weights in Equation (3) to give more weight to the parts of the objective function that involves the phenotype to avoid this potential outcome. Finally, in the COPD results we reported SmCCNet predictions that overlaps with validated and predicted target pairs from MultiMir. Not all of our findings are in the MultiMir databases. This is expected since SmCCNet focuses on phenotype-specific networks, while the miRNA–mRNA target predictions are phenotype-independent. In addition, the predictions in MultiMir are based on sequence. The emphasis on phenotype sets our approach apart from software programs like DIANA-microT (Paraskevopoulou et al., 2013) and miRDB (Wong and Wang, 2015), and provides new perspectives to multi-omics network discovery.
5 Conclusions
While there have been many methods for integrating miRNA and mRNA expression, very few of them incorporate quantitative phenotypes or construct phenotype-specific gene regulatory networks. We introduce SmCCNet, a canonical correlation-based network discovery algorithm that integrates expression data with a quantitative phenotype and reveals phenotype-specific multi-omics networks. To our knowledge, SmCCNet is the first application of CCA in constructing phenotype-specific multi-omics networks. Through simulations we show that our approach out-performs one of the most popular gene network construction method and another CCA extension that naturally incorporates phenotype information. We applied SmCCNet to a COPD dataset and identify miRNA–mRNA networks for two phenotypes FEV1pp and percent emphysema. We also demonstrated the utility of SmCCNet with a public breast cancer dataset. Although we focus on single phenotype, SmCCNet can be easily generalized for incorporating multiple-related traits at once. Furthermore, our applications focused on expression data but are also generalizable to any other continuous omics features (e.g. metabolomic, proteomic). We believe that the potential and flexibility of SmCCNet makes it suitable for many applications in biology and other fields.
Acknowledgements
We thank Dr Sonia Leach for helpful discussions on network reconstruction.
Funding
This work was supported by the National Institute of Health [T15LM009451 to W.J.S., R01AA021131 to P.H.R., P.R., B.V., L.S. and K.K., R01HL125583 to K.K., Y.Z. and C.P.H, P30DA044223 to L.S. and K.K., K08HL136928 to B.H., R01HL130512, U01HL089897 and U01HL089856 to C.P.H., R01HL124233 and R01HL126596 to P.C.]; and Francis Family Foundation [Parker B. Francis Research Opportunity Award to B.H.].
Conflict of Interest: none declared.
References
Author notes
The authors wish it to be known that, in their opinion, W. Jenny Shi and Yonghua Zhuang authors and should be regarded as Joint First Authors.

