


Abstract
Tumor purity (TP) is the proportion of cancer cells in a tumor sample. TP impacts on the accurate assessment of molecular and genomics features as assayed with NGS approaches. State-of-the-art tools mainly rely on somatic copy-number alterations (SCNA) to quantify TP and therefore fail when a tumor genome is nearly euploid, i.e. ‘non-aberrant’ in terms of identifiable SCNAs.
We introduce a computational method, tumor purity estimation from single-nucleotide variants (SNVs), which derives TP from the allelic fraction distribution of SNVs. On more than 7800 whole-exome sequencing data of TCGA tumor samples, it showed high concordance with a range of TP tools (Spearman’s correlation between 0.68 and 0.82; >9 SNVs) and rescued TP estimates of 1, 194 samples (15%) pan-cancer.
TPES is available as an R package on CRAN and at https://bitbucket.org/l0ka/tpes.git.
Supplementary data are available at Bioinformatics online.
1 Introduction
Genomic and molecular analyses of tumor samples require the quantification of tumor and admixed normal cells proportion [tumor purity (TP) or cellularity] in order to assess the somatic lesion detection boundaries and to perform proper comparative analyses. Several tools were developed to quantify TP from NGS data, including ABSOLUTE (Carter et al., 2012), ASCAT (Van Loo et al., 2010), Sequenza (Favero et al., 2015) and CLONET (Prandi et al., 2014) based on somatic copy-number alterations (SCNAs); ESTIMATE (Yoshihara et al., 2013) on transcriptomic data; LUMP (Aran et al., 2015) and PAMES (Benelli et al., 2018) on methylation data, and PurityEst (Su et al., 2012) on mutations. Large efforts, as TCGA (Chalmers et al., 2017), favor the use of SCNAs-based tools to estimate TP. These approaches fall short for samples with ‘quiet’ (‘non-aberrant’ in terms of identifiable SCNAs) genomes, a feature of specific tumor subclasses or of entire tumor types, as thyroid carcinoma (THCA) and kidney renal clear cell carcinoma (KIRC) (Supplementary Fig. S1). Here we present the full implementation of tumor purity estimation from SNVs (TPES), a novel computational approach that allows for the estimation of DNA purity from the distribution of variant allelic fractions (VAFs) of somatic single-nucleotide variants (SNVs) within copy-number neutral tumor segments. Concordance analysis between state-of-the-art tools and TPES demonstrated high concordance in terms of TP assessment, suggesting that TPES is a reasonable alternative strategy to estimate TP in copy-number neutral tumor genomes.
2 Materials and methods
The VAF distribution of a set of clonal monoallelic SNVs from pure tumor samples NGS data should be centered in 0.5. Technical and cancer specific factors may influence the observed VAF values (Supplementary Fig. S2), as due to the reference mapping bias (Degner et al., 2009) (Supplementary Material) and to tumor-specific features. For instance, a SNV within a copy-number three segment may present with three VAF values, namely ⅓, ⅔ or 1. In addition, in case of subclonal events, the VAF is further altered. Overall, we reasoned that clonal monoallelic SNVs within diploid segments are suited for TP estimation, named p-SNV. Given a set of p-SNVs, TP could in principle be computed as [Equation (1)], where observed VAF is computed from the tumor NGS data, while expected VAF is the value expected from a pure tumor sample accounting for the reference mapping bias. Amenable p-SNVs need to be selected with a conservative procedure for the TP estimates to be reliable and the minimum number of SNVs required to determine a purity value should be defined. To minimize the number of false positive p-SNVs for each sample, the TPES pipeline (Supplementary Fig. S3) introduces two main filtering steps to the whole set of observed SNVs (Supplementary Material). In the first filtering step, TPES (i) selects SNVs in copy-number neutral segments, by applying a conservative filter on the log2R value of each genomic segment (log2 of the tumor and matched normal coverage ratio), i.e. [−0.1, 0.1] (Mermel et al., 2011), (ii) accounts for aneuploidy genomes by adjusting the log2R distribution by ploidy (TPES input parameter as continuous real value) and (iii) selects putative heterozygous SNVs by retaining those with a number of reads mapping the alternative base and AF above and below defined thresholds, respectively (defaults set to 5 and to 0.55). Furthermore, to avoid gender stratifications, chromosomes X and Y are excluded from the analysis. This first step nominates a set of heterozygous copy-number neutral SNVs, cnn-SNVs, such that cnn-SNVs ⊆ SNVs. In the second filtering step, TPES removes putative subclonal mutations from the set cnn-SNVs. Observed VAF distribution of cnn-SNVs is smoothed by kernel density estimation (KDE) using a range of bandwidth values. For each bandwidth, the first derivative of the KDE allows for the detection of the local maxima (peaks) of the underlying distribution. The peak with the highest VAF value is the candidate observed VAF for Equation (1). As expected, this procedure applied to the TCGA datasets resulted in a wide range of per sample p-SNVs across tumor types (Supplementary Fig. S4); with uterine carcinosarcoma (UCS), testicular germ cell tumors (TGCT), acute myeloid leukemia (LAML) in the lower tail. To systematically evaluate the minimum number of p-SNVs to reliably estimate TP, we compared TPES with SCNAs-based methods. Figure 1A shows that >9 p-SNVs provide great correlation with CLONET estimates; similar trends are observed with ABSOLUTE and ASCAT (Supplementary Fig. S5).
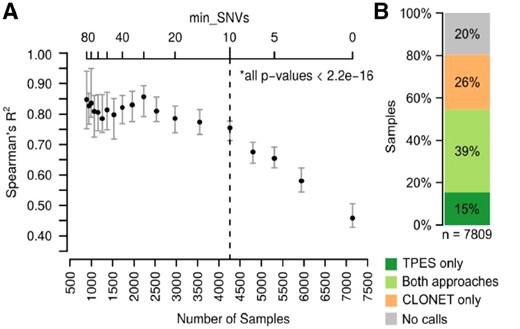
Performance on 7809 TCGA WES samples across 30 tumor types. (A) Correlation between TPES and CLONET estimates as a function of the minimum number of p-SNVs (top x-axis) used by TPES. The bottom x-axis indicates the number of samples for which TP is estimated by TPES, while varying the minimum number of top x-axis); 400 samples are randomly selected and Spearman’s correlation against CLONET estimates is computed; the procedure is repeated 60 times. For each value of min_SNVs, error bars represent the 1st to the 3rd quartile of the computed R2, while the dot represents the median value. All P-values are significant (alpha = 0.01). (B) TP call rates of study dataset samples compared to CLONET calls. Applied filters for purity assessment are >9 p-SNVs for TPES and >2 putative mono-allelic deletion segments for CLONET
3 Results
The concordance of TP calls between TPES estimates and seven tools based on a range of genomic, molecular or morphological features is in line with what observed among all tools on the same input. Supplementary Figure S6 includes head-to-head comparisons (data in Supplementary Tables). The results indicate that the concordance between ABSOLUTE and TPES (Spearman’s correlation: 0.725, P-value < 0.001) is higher than between ABSOLUTE and ASCAT (0.688, P-value < 0.001), two SCNA-based tools. As TPES is meant to extend the ability of SCNA-based tools in case of quiet genomes, we also estimated the number of private calls (provided by only one tool) in head-to-head comparisons. On a set of 7809 TCGA samples and 30 tumor types, CLONET and TPES returned high concordant calls (Spearman’s correlation: 0.737, P-value < 0.001) across 3067 cases (Fig. 1B), with average TP of 66% (IQR: 0.30, SD: 0.19) and of 69% (IQR: 0.27, SD: 0.19), respectively. CLONET did not return TP calls for 2719 samples (35%); of those, TPES recovered 1194 samples (44%). Conversely, CLONET provided TP calls for 2023 (26%) samples for which TPES did not return a value, either due to lack of CN neutral segments and/or to insufficient number of p-SNVs. Percentages of private and shared TP calls varied across tumor types (Supplementary Fig. S7). Data show that TPES private estimates are enriched in samples with low genomic burden and that CLONET is more proficient with high genomic burden cases (Supplementary Fig. S8), overall suggesting that TPES is complementary to SCNA-based tools (Supplementary Figs S9 and S10). The ability to compare TPES to ABSOLUTE was impaired by lack of published fail rate reports (Supplementary Material and Supplementary Fig. S11). TPES is available as R package on CRAN. It is fast and low demanding in terms of computational resources (Supplementary Fig. S12) and is therefore suitable for the rapidly emerging big data analysis requirements from deep coverage sequencing data.
Acknowledgements
The authors thank Alessandro Romanel, Yari Ciani and members of the Caryl and Israel Englander Institute for Precision Medicine for input.
Funding
NIH/NCI SPORE in Prostate Cancer [P50-CA211024], European Reasearch Council [ERC 648670] to F.D.
Conflict of Interest: none declared.
References
Author notes
The authors wish it to be known that, in their opinion, Alessio Locallo and Davide Prandi authors should be regarded as Joint First Authors.

