


Abstract
Complementary advances in genomic technology and public data resources have created opportunities for researchers to conduct multifaceted examination of the genome on a large scale. To meet the need for integrative genome wide exploration, we present epiTAD. This web-based tool enables researchers to compare genomic 3D organization and annotations across multiple databases in an interactive manner to facilitate in silico discovery.
epiTAD can be accessed at https://apps.gerkelab.com/epiTAD/ where we have additionally made publicly available the source code and a Docker containerized version of the application.
1 Introduction
The hierarchical organization of the genome is organized as insulated neighborhoods or loops called Topologically Associating Domains (TADs) (Dixon et al., 2012). Techniques such as Hi-C allow TADs to be observed as quantitative ‘peaks’ of chromosomal interaction or contact. In parallel, genome-wide associations studies (GWAS) have identified numerous risk loci defined by single nucleotide polymorphisms (SNPs), with almost 90 000 published SNP-trait associations (https://www.ebi.ac.uk/gwas/) (Manolio, 2010). Further efforts such as the GTEX project (Battle et al., 2017) have accelerated analysis and understanding of genetic mechanisms by providing large public data resources. To date, TAD annotations and molecular data of epidemiologic interest (e.g. GWAS SNPs, genes of clinical/translational relevance, eQTLs) have existed in isolation. Integrating TADs with data from molecular epidemiology may allow researchers to bridge the gap between genomic architecture and public health relevance. Accordingly, we present epiTAD, a web tool for visualizing Hi-C data alongside epidemiologically driven genomic annotations.
2 Materials and methods
2.1 Data collection
Hi-C reads provided in epiTAD are from human fibroblast IMR90 cell profiles (Dixon et al., 2012). TAD boundaries were also taken from the Dixon experiments and were determined on the basis of a ‘bi-directionality index’ of chromatin interactions (Dixon et al., 2012). The application is preloaded with the IMR90 data under the assumption that TADs are cell type independent in non-diseased settings. Emerging evidence suggests TAD heterogeneity in cancer cells (Sauerwald and Kingsford, 2018); users may leverage the dockerized open source features of epiTAD to load custom Hi-C in a local computing environment, as needed. Linkage disequilibrium (LD) measures are queried from HaploReg, with data originating from the 1000 Genomes project (Ward and Kellis, 2012). eQTLs are obtained through GTEx Version 7, which determines eQTLs from 635 donors over 53 tissues (Carithers et al., 2015). Coordinates and HGNC symbols for genes are taken from ENSEMBL, while data from various sources are scraped from the annotation aggregator Oncotator. All data are queried in real time from publicly available resources.
2.2 Implementation
epiTAD is available for public use online at the author’s website https://apps.gerkelab.com/epiTAD, which also permits installation of a containerized version of the application via Docker Hub. The user interface is built using R Shiny (Chang et al., 2018), and real-time data querying, table production and visualization is enabled by the R packages haploR (Zhbannikov et al., 2018), HiTC (Servant et al., 2012), Sushi (Phanstiel, 2018) and biomaRt (Durinck et al., 2009). Full source code for the application is available at https://github.com/GerkeLab/epiTAD.
3 Access and display
epiTAD is freely available online from https://apps.gerkelab.com/epiTAD/, and is compatible with all major web browsers (Chrome, Internet Explorer and Safari). No login or user information is required for use. The interface contains four panels: inputs, visualizations, variant and gene annotations, with an additional information page available by selecting the ‘i’ button. Pre-loaded examples can be queried from a drop-down menu.
At minimum, users need to input at least one SNP, in the form of a dbSNP rs id (e.g. rs10486567). Multiple SNPs can be uploaded and queried at once either as a comma separated list or as a text file, however the variants must all reside on the same chromosome.
Variant annotations from the HaploReg and RegulomeDB databases are available under separate tabs. The amount of information shown can be customized by the user, from a drop down panel in each tab. The TADs tab informs the user if the SNP(s) are located within a known TAD and if so, provides the coordinates and also contains a link to the Hi-C Browser for additional visualization options.
A query region is created that contains all SNPs within the maximum of the LD or TAD boundaries. If there are no SNPs above the selected LD threshold and the variants of interest are not located within a TAD, then a region of 53 500 (base pairs) bp is added to either side of the SNP to create the query region. This query region is then used for all gene level annotations and for the initial coordinates for the visualization. The gene names and coordinates can be downloaded from the site as a CSV file. Oncotator queries are broken down by source and can pull information from the Cancer Gene Census, HUGO Gene Nomenclature Committee and UniProt. If eQTLs are available from GTEx, the user can select tissue(s) of interest to subset results.
Live links to additional resources and tools, including ClinVar, the UCSC Genome Browser, Juicebox, Hi-C Browser and GTEx, are made available to the user (Wang et al., 2018).
A figure is automatically rendered that spans the query region and contains four tracks. The first track displays the Hi-C contact matrix scores, the second contains gene coordinates within the region, the third shows the query SNP(s) (color) and SNPs in LD (grey) and the final track shows the TAD boundaries. The figure is interactive, allowing users to mouse over each piece and receive additional annotations, such as SNP ID and alleles or gene coordinates. By selecting ‘Plot Options’, the user can update the bounding bp coordinates (as long as the coordinates are at least 20 000 bp apart, as Hi-C is binned in 10 000 bp) or return to the original coordinates, choose from 15 color schemes, or download the image as a high-resolution PDF. Users can bookmark any queries to return to the page setup as-is, saving all edits or selections made.
Figure 1 demonstrates the output for rs10486567 as an example of utility gained through combining epidemiologic and TAD data. This prostate cancer risk SNP was previously found to be significantly associated with HIBADH expression in prostate tumor tissue and with TAX1BP1 expression in normal prostate tissue (Penney et al., 2015), despite not collocating with either gene. This finding may be, in part, explained by observing that both genes as well as rs10486567 are located within the same TAD, with the Hi-C data showing a large amount of contact across this area.
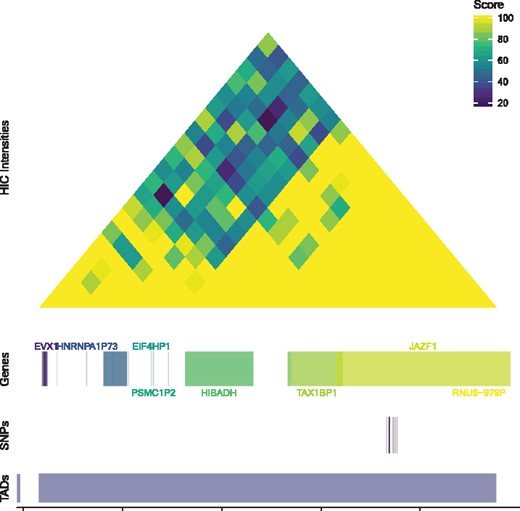
An example of the epiTAD figure output for rs10486567
4 Discussion
EpiTAD provides a single application to integrate genomic annotations and measurements across multiple public databases covering a region of interest. The application allows researchers to access and plot large amounts of data related to major genome organization structures without programming knowledge. The resulting web app may prove a broadly useful component of in silico functional genomics discovery.
Funding
This work was partially funded by H. Lee Moffitt Cancer Center Miles for Moffitt Award (PI: Monteiro).
Conflict of Interest: none declared.
References

