


Abstract
A cancer genome includes many mutations derived from various mutagens and mutational processes, leading to specific mutation patterns. It is known that each mutational process leads to characteristic mutations, and when a mutational process has preferences for mutations, this situation is called a ‘mutation signature.’ Identification of mutation signatures is an important task for elucidation of carcinogenic mechanisms. In previous studies, analyses with statistical approaches (e.g. non-negative matrix factorization and latent Dirichlet allocation) revealed a number of mutation signatures. Nonetheless, strictly speaking, these existing approaches employ an ad hoc method or incorrect approximation to estimate the number of mutation signatures, and the whole picture of mutation signatures is unclear.
In this study, we present a novel method for estimating the number of mutation signatures—latent Dirichlet allocation with variational Bayes inference (VB-LDA)—where variational lower bounds are utilized for finding a plausible number of mutation patterns. In addition, we performed cluster analyses for estimated mutation signatures to extract novel mutation signatures that appear in multiple primary lesions. In a simulation with artificial data, we confirmed that our method estimated the correct number of mutation signatures. Furthermore, applying our method in combination with clustering procedures for real mutation data revealed many interesting mutation signatures that have not been previously reported.
All the predicted mutation signatures with clustering results are freely available at http://www.f.waseda.jp/mhamada/MS/index.html. All the C++ source code and python scripts utilized in this study can be downloaded on the Internet (https://github.com/qkirikigaku/MS_LDA).
Supplementary data are available at Bioinformatics online.
1 Introduction
Cancer cells carry a number of somatic mutations, which are roughly subdivided into two categories: (i) driver mutations that contribute to the proliferation of cancer genomes and (ii) passenger mutations that do not contribute to the proliferation (Stratton et al., 2009). In the past research, hypothesis-driven studies whose target is driver mutations have mainly been conducted (Smalheiser, 2002). On the contrary, due to the development of next-generation sequencers (NGS), large-scale data on cancer genomes are rapidly accumulated worldwide (Forbes et al., 2015; Tomczak et al., 2015). Accordingly, because many studies that are focused on passenger mutations have been conducted (Rubin and Green, 2009; Wong et al., 2011), passenger mutations are also considered important for understanding carcinogenic mechanisms (Alexandrov et al., 2013a; Barba et al., 2014; Greenman et al., 2007).
Regardless of whether it is a driver mutation or passenger mutation, each somatic mutation has its own cause. For instance, it is known that genome sequences of lung cancer patients with a smoking habit have many typical substitutions, cytosine (C) to adenine (A), in their tumor suppressor genes, such as TP53 (Toyooka et al., 2003). In this case, we call the smoking habit a ‘mutational process’ (causes mutations), and a ‘mutation signature’ is defined as a preference for mutations (mutational distribution, e.g. C to A substitutions frequently occur) corresponding to the mutational process. Every mutational process leads to a specific mutation signature, and accumulation of mutations from birth up to now is considered a result of a combination of some mutation signatures (Stratton, 2011). Hence, clarification of mutation signatures is expected to reveal carcinogenic mechanisms and may serve as biomarkers for early diagnosis (Harris, 2013; Temko et al., 2018; Wagener et al., 2015). Note that Zou et al. (2018) recently reproduced mutation signatures with a knockout of individual genes in vitro using the CRISPR-Cas9 technology; this result supports the existence of mutation signatures.
There exist many studies on prediction of mutation signatures by means of cancer mutation catalogs. Nik-Zainal et al. (2012, 2016) and Alexandrov et al. (2013a, 2015) used non-negative matrix factorization (NMF) (Lee and Seung, 2001) for estimating mutation signatures and revealed 30 mutation signatures in various cancer types (http://cancer.sanger.ac.uk/cosmic). The ‘signeR’ also utilized NMF (in combination with the empirical Bayesian approach) for signature discovery (Rosales et al., 2017). On the other hand, Shiraishi et al. (2015) used the topic model [in particular, latent Dirichlet allocation (LDA) (Blei et al., 2003)] for modeling and clarifying mutation signatures. In comparison with NMF, topic models assume probabilistic structures of mutations behind samples; this approach is expected to improve generalization performance (Hofmann, 1999).
Although those methods are effective at estimating mutation signatures, they involve ad hoc approaches to prediction of the variety (number) of mutation signatures; this arrangement prevents clarification of the whole picture of mutation signatures. In addition, during a search for a new signature, model selection is an important basis for deciding whether a signature is new. A notable approach to determining the number of mutation signatures is to employ the EMu method (Fischer et al., 2013) where the Bayesian information criterion (BIC) is utilized for model selection. However, BIC is mathematically suitable only for probabilistic models whose Fisher information matrix is regular because the posterior distribution of parameters can be Laplace approximated in the statistical regular model where the central limit theorem holds. Thus, BIC should not be used in mixed models including latent variables such as LDA (Yamazaki and Watanabe, 2005). Note that signeR described in the previous paragraph also utilized BIC for model selection. To address these issues, we propose a novel method for prediction of mutation signatures and select a plausible model for LDA with variational Bayes (VB) inference. We confirmed that our method is sufficiently accurate in a numerical simulation. In experiments with real datasets, we introduced clustering analyses for estimated mutation signatures in addition to known signatures to discover reliable signatures present in several cancer types. As a result, we found several interesting mutation signatures that could be novel.
2 Materials and methods
2.1 Representation of mutations in cancer genomes
Due to the recent advances of next-generation sequencers, the number of known cancer genomes is rapidly growing in the world. With a specific cancer genome, we obtain a set of mutations (e.g. a substitution from A to C, denoted by [A > C]) present in the genome. Here, the variety of mutations is defined by a mutation dictionary (denoted by ), and we utilize four mutation dictionaries ( and ) according to the purpose of analyses as described below.
2.1.1 Mutation dictionaries without insertions and deletions (indels)
![A known mutation signature in the COSMIC database. This signature (Signature 1) was taken from the COSMIC database (http://cancer.sanger.ac.uk/cosmic), whose mutational process is considered the deamination reaction of methylated cytosine. The horizontal and vertical axes show types of mutations and their probabilities, respectively. The four arrows indicate the peaks at A[C > T]G, C[C > T]G, G[C > T]G and T[C > T]G, suggesting that methylated cytosine tends to become thymine if the 3′ adjacent base is guanine](https://oup.silverchair-cdn.com/oup/backfile/Content_public/Journal/bioinformatics/35/22/10.1093_bioinformatics_btz266/3/m_bioinformatics_35_22_4543_f1.jpeg?Expires=1716400992&Signature=I6lwsvDUjn5wN9DBjmBuyMbETuEX69hjGIhJSj7GJgc0gGgbI~OZKrvD0qsrNbJn1-b1Y4TSta60WBatdBYkNpEG29Fyd7yE9JlteTKB79VOFHhn6ttv6TQhUo1DU5aCs6k38NA4tf3TMppmwA~T-GK7uFBoQcxRB3LeyEQpzggI2rmJWvzAGFm6PxT6v7jw-mQKZhHReSlsua~n3og~xmLFt9zS0tju7vdkqWM5qCZuIOrhqm0bnVEUldEsdXIY4l7xCIQXFBTrm12A~jmWghpPiOrS4PqQD7r7NKNHjPWY6qat5YNIQm5S4xgHV9vrXWj9OzbazQDwtYC5uNELnA__&Key-Pair-Id=APKAIE5G5CRDK6RD3PGA)
A known mutation signature in the COSMIC database. This signature (Signature 1) was taken from the COSMIC database (http://cancer.sanger.ac.uk/cosmic), whose mutational process is considered the deamination reaction of methylated cytosine. The horizontal and vertical axes show types of mutations and their probabilities, respectively. The four arrows indicate the peaks at A[C > T]G, C[C > T]G, G[C > T]G and T[C > T]G, suggesting that methylated cytosine tends to become thymine if the 3′ adjacent base is guanine
Clearly holds.
2.1.2 Mutation dictionaries with indels
2.2 LDA for modeling of mutation signatures
By means of one of the mutation dictionaries in the previous section, a mutation catalog in a specific cancer genome is transformed into a set of mutations (defined by the mutation dictionary). We modeled these mutations using a generative probabilistic model called LDA.
LDA was initially proposed as a generative probabilistic model for documents (Blei et al., 2003) that was successfully applied to some bioinformatics problems, e.g. by Liu et al. (2010) and Flaherty et al. (2005). In LDA, each word in a document is generated from a latent variable called a topic, which has a specific word distribution. In this study, words and topics in LDA correspond to mutations and mutational processes, respectively (Fig. 2).
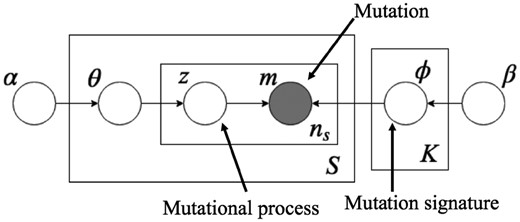
A graphical model of LDA for modeling mutation signatures. m is an observed variable for mutations with a given mutation dictionary, and z is a latent (hidden) variable for mutational processes. The ith mutation in the sth sample, , is generated by a categorical distribution with parameters , where corresponds to its mutational process that is generated by a categorical distribution with parameter θs; θ and are generated from Dirichlet distributions with hyperparameters α and β, respectively. In this model, represents a preference for mutations (in ) of mutational process z, and this arrangement corresponds to a mutation signature. S and K indicate the numbers of samples and mutation signatures, respectively, and ns is the number of mutations in the sth sample. In this study, not only parameters α, β, θ and but also K are estimated from the observed mutations
In this article, we employ the following notations:
is the ith mutation of the sth sample.
S is the number of samples; s () is an index for a sample.
ns is the number of mutations in the sth sample;
V is the total number of mutations in mutation dictionary ; v means the vth type of mutation ().
K is the number of mutational processes; k means the kth process ().
is the parameter of the categorical distribution of mutational processes for each sample s, where represents the activity of the kth process in the sth sample, which is called signature activity.
is the parameter of the categorical distribution of mutations for each signature k, where denotes the proportion of the vth mutation type for the kth signature.
2.3 Learning LDA with variational Bayes inference
Either Gibbs sampling or variational Bayes (VB) is frequently used for learning parameters in LDA (Blei et al., 2003). In this study, we employ VB because the evaluation function of VB (called variational lower bound: VLB) is applicable to model selection (i.e. estimating the number of latent variables). The detailed method is presented in the Supplementary Section S1. In VB, we try to minimize the KL divergence with the true distribution by learning so as to maximize VLB calculated from the joint distribution without calculating the posterior distribution. By avoiding the calculation of the posterior distribution, it is possible to solve the issue of non-regularity in singular models such as LDA.
In our computational analyses, we updated parameters until the difference between a current VLB value and the previous value by one iteration becomes smaller than or the number of iterations becomes larger than 1000. To avoid the local minimum, the initial values of parameters were reallocated 50 times for each K, and the estimated values of the parameters with the highest VLB value were adopted as representative parameters of K. It should be emphasized that VB inference enables us to select the optimal number of latent variables automatically by taking the highest value of VLB for each K (Corduneanu and Bishop, 2001), which is a complementary approach to existing approaches such as EMu.
2.4 A comparison between predicted and known mutation signatures
After training VB-LDA for a set of mutations with given mutation dictionary , we obtained the number of mutation signatures (K) and parameters , where denotes a probability vector in for mutation signatures k. On the other hand, 30 mutation signatures are obtained from the COSMIC database (https://cancer.sanger.ac.uk/cosmic), and the probability vector of the lth known signature is denoted by . If we choose the mutation dictionary in our method, then the predicted signatures are directly comparable to the known signatures. In this study, cosine distance is used for the comparison because it can capture characteristic peaks in a mutation distribution.
3 Results and discussion
3.1 Results on simulated mutation datasets
To confirm the usefulness of our proposed model, we conducted experiments with a simulated dataset. In these analyses, we simulated mutation data according to the LDA model, where () is taken from COSMIC Known Signature . We generated various simulated data by changing total sample number S, the number of mutations for one sample ns, and hyperparameter αk to determine under what conditions the model can predict original signatures correctly. We tested K from 2 to 30, and the optimal K was estimated by VB inference (see Section 2.3).
Table 1 shows the results of simulation, and Figure 3 and Supplementary Figure S1 present the VLB for and estimated mutational signatures for K = 10, respectively, with appropriate parameters (). These results clearly mean that VB-LDA successfully estimated the correct number of mutation signatures (K = 10) and a mutational distribution for most conditions.
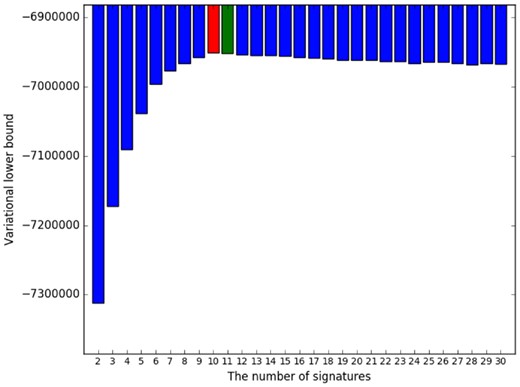
Variational lower bound (VLB) for each number of mutation signatures in the simulation with an appropriate condition (; cf. Table 1). In this analysis, the true number of signatures is 10. The horizontal axis shows the number of signatures K, and vertical axis indicates VLB for each K. Furthermore, red and green bars show the highest and the second highest VLBs, respectively. On the basis of VLB, we can select a true number of mutation signatures (i.e. 10)
Simulation results for various parameters of data generation
| # samples: S | 20 | 100 | 1000 | 5000 |
|---|---|---|---|---|
| # predicted signatures | 9 | 10 | 10 | 10 |
| Ave. Cos. dist. (to COSMIC Signatures) | 0.0614 | 0.0096 | 0.0138 | 0.0050 |
| Ave. Cos. dist. (to predicted signatures) | 0.0473 | 0.0096 | 0.0138 | 0.0050 |
| # mutations in sth sample: ns | 100 | 200 | 400 | 2000 |
| # predicted signatures | 6 | 7 | 10 | 10 |
| Ave. Cos. dist. (to COSMIC Signatures) | 0.0276 | 0.0262 | 0.0462 | 0.0138 |
| Ave. Cos. dist. (to predicted signatures) | 0.0793 | 0.0588 | 0.0462 | 0.0138 |
| hyperparameter αk | 0.01 | 0.1 | 1 | 10 |
| # predicted signatures | 10 | 10 | 10 | 6 |
| Ave. Cos. dist. (to COSMIC Signatures) | 0.0134 | 0.0138 | 0.0558 | 0.0480 |
| Ave. Cos. dist. (to predicted signatures) | 0.0134 | 0.0138 | 0.0588 | 0.1046 |
Note: In this simulation, we applied VB-LDA to a simulated mutation dataset in which 10 known COSMIC signatures are regarded as true signatures. The default setting of parameters is S = 1000, ns = 2000 and , and we changed each parameter from its default value. ‘# predicted signatures’ (closer to 10 is better) is the number of predicted mutation signatures according to VB-LDA based on VLB (cf. Fig. 3); ‘Ave. Cos. dist. (to COSMIC Signatures)’ (smaller is better) is equal to where (resp. ) is a set of predicted (resp. known) mutation signatures, and is cosine distance between two signatures, whereas ‘Ave. Cos. dist. (to predicted signatures)’ (smaller is better) is equal to . When ‘# of predicted signatures’ is equal to 10 and the values of ‘Ave. Cos. dist. (to COSMIC signatures)’ and ‘Ave. Cos. dist. (to predicted signatures)’ are closer to 0, the correct signatures are assumed to be reproduced. The bold values indicate the best values within each row.
On the other hand, VB-LDA failed to estimate the true mutational distribution and the true number of mutation signatures when the number of samples was less than 100 and the number of mutations included in one sample (ns) was less than 400. This is presumably because VB-LDA estimates a signature on the basis of co-occurrence of mutations, which assumes a relatively large input dataset (Blei et al., 2003). Besides, when hyperparameter α is smaller than 0.1 (i.e. the distribution of mutational processes in the sample is sufficiently biased), our method successfully estimated the number of mutation signatures and the original distributions. We apply these observations to the selection of real data in the next section.
3.2 Results on real mutation datasets
To look for new mutation signatures, we predicted real mutation signatures by applying our method to the mutation catalog provided in the COSMIC database. Because a mutational process varies depending on the cancer type, samples were subdivided into primary lesions, which are used to train the LDA model.
Many mutation catalogs are registered in the COSMIC database (https://cancer.sanger.ac.uk/cosmic/download), but there are many samples that include only a small number of mutations (i.e. ns is very small). We confirmed via the simulation that such samples are not appropriate for learning mutation signatures as discussed in Section 3.1; therefore, we filtered out samples with fewer than 400 mutations. In addition, the primary lesion whose number of suitable samples is less than 25 was excluded from the analysis for the same reason. As a result, 1607 samples in 11 categories of primary lesions (breast, endometrium, large intestine, liver, lung, oesophagus, prostate, skin, soft tissue, stomach, upper aerodigestive tract and urinary tract) were analyzed as follows. For some categories of primary lesions, the number of samples is small (e.g. 30 for breast cancer), and it is unclear whether our method can estimate the correct number of signatures from the simulation results. However, in this case, because the samples that have almost no mutations behave like noise, we decided to use only the sample with many mutations even if the number of samples decreases.
Then, based on four mutation dictionaries (), four datasets were constructed for each type of primary lesion. At this time, it is necessary to determine the surrounding bases at the site where the mutation occurred (mutation context) according to the corresponding mutation dictionary, and we used GRCh38 as a reference human genome to obtain it and produced mutation datasets. We provided the mutational burden of the samples used in the experiment and the information on site subtype and histology as Supplementary HTML materials (http://www.f.waseda.jp/mhamada/MS/index.html). Ramazzotti et al. (2018) pointed out that the mutational distributions are affected by the sequencing strategy (i.e. whole-genome or whole-exome sequencing). In this study, we did not care about the strategies because the mutational distributions were not different between the whole-sequence group (1575 samples) and targeted-sequencing group (32 samples) (the cosine distance between them is 0.1024; Supplementary Fig. S1). However, this might be because the majority of whole-sequence samples is whole- exome-sequenced samples. In that case, it is better to subdivide the samples having a whole-exome sequence and whole-genome sequence in the same way as in another study (Alexandrov et al., 2013a), but the samples with whole-genome sequence are still too few to perform analyses; therefore, in this study we decided to carry out experiments without separating the samples.
Finally, we applied our LDA method to these mutation datasets and determined mutation signatures by VB inference (Section 2.3).
3.2.1 VB-LDA successfully recovered known mutation signatures
Supplementary Tables S1–S4 show a summary of the number of predicted signatures, which are similar to COSMIC Known Signatures for each mutation dictionary (), suggesting that most of the known signatures in the COSMIC database were extracted by VB-LDA. Especially, when the mutation datasets with and (both of which include indels in their mutation vocabularies) were tested, our method successfully predicted mutation signatures that are likely to be associated with insertions and deletions (e.g. COSMIC Known Signatures 6 and 15). This result therefore supports the usefulness of various mutation dictionaries.
On the other hand, our method did not find several COSMIC Known Signatures with any dictionary. This is because we did not take into account all the available mutation catalogs in COSMIC. For example, our method did not extract COSMIC Known Signature 27, which has been found in kidney cancer (Alexandrov et al., 2013b). Because there is a only small number of samples of kidney cancer that have more than 400 mutations in COSMIC, kidney cancer was removed from the list of targets of the experiment to perform stable modeling. Moreover, Supplementary Figure S3 indicates that our method estimated a merged mutation signature (predicted signature 1, a dominant signature in most samples; Supplementary Fig. S3A) of COSMIC signature 2 and 13 (Supplementary Fig. S3D). It is known that both COSMIC signatures 2 and 13 are related to AID/APOBEC proteins and often co-occur. From a methodological viewpoint, it would be difficult to deconvolute signatures that often co-occur (the convexity of transition of VLB is unclear; Supplementary Fig. S3B). Note that signatures in the COSMIC database are taken from several studies, and manually curated.
3.2.2 Discovering new signatures on the basis of hierarchical clustering
To find a novel set of mutation signatures, we performed hierarchical clustering analyses for predicted mutation signatures with each mutation dictionary. In these analyses, we put predicted signatures all together regardless of the cancer types (i.e. primary lesion), and subdivided those signatures into clusters based on cosine distance, by the average-linkage hierarchical clustering method; the COSMIC Known Signatures were also included for dictionary . After clustering, we regarded a group of signatures as a cluster when cosine distances among members were less than 0.2 (Fig. 4 and Supplementary Figs S4–S7). It should be noted that mutation signatures that are found in several cancer types support the existence. Additionally, to ascertain the reliability of the signatures, signature activity, in Section 2.2, is calculated, which shows how much relative contribution is present in a sample s for a specific signature k.
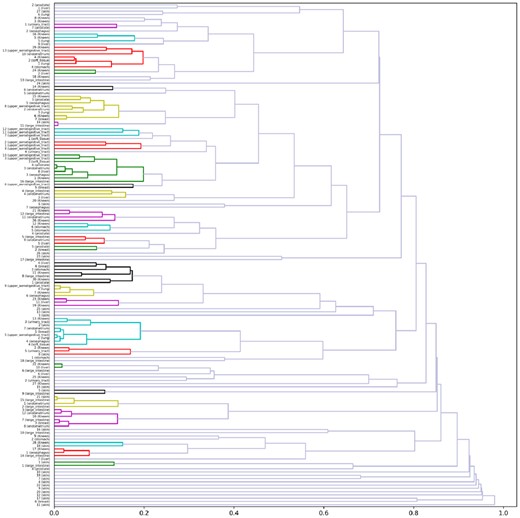
Clustering results on mutation signatures for dictionary , where all the known COSMIC signatures in addition to our predicted signatures are included on the vertical axis. Averaged linkage hierarchical clustering with a cosine distance is employed for clustering. The colors show a cluster with the distance threshold 0.2. A high-quality image is available in Supplementary Fig. S4 or Supplementary HTML material. The results for the other mutation dictionaries are presented in Supplementary Figures S5–S7
In the figures below, note that all bar graphs show a mutational distribution (i.e. ). The horizontal axis means the mutation types, and the vertical axis shows their proportion of that signature as do Figure 1 and Supplementary Figure S1. Furthermore, red, green, blue, cyan, magenta and yellow bars show the probability of emergence of substitutions [C > A], [C > G], [C > T], [T > A], [T > C] and [T > G], respectively.
In the text below, we report seven interesting mutation signatures that might be novel, or otherwise broaden our understanding of known COSMIC signatures from the clustering results. Because they appear in multiple primary lesions, and most of the signatures are active in many samples (cf. Supplementary Fig. S8), the existences of these signatures is reliable. Higher-resolution figures for all the mutation signatures, clustering results and signature activity (i.e. the relative contribution of signatures in each sample) are shown in Supplementary HTML materials (http://www.f.waseda.jp/mhamada/MS/index.html). In the following, ‘ Cluster-ID’ denotes the result of Cluster-ID with the dictionary (the ID of the cluster corresponds to the ID in Supplementary HTML).
Cluster-15 (Fig. 5A): The signatures in this cluster were detected in the large intestine, endometrium and liver. We observed characteristic peaks, X[T>C]G (X = A, T, G or C), in all the mutation signatures (Fig. 5), which might be influenced by an unknown mutational process. This cluster includes novel mutation signatures because there is no known signature that is similar to these signatures. For example, the most similar known signature for predicted signature 9 in the endometrium (the middle panel in Fig. 5A) is COSMIC Known Signature 12 (found in liver cancer), and the cosine distance between them is relatively large (0.2234). Note that ‘COSMIC known signature 12’ does not include the characteristic peaks, X[T>C]G (Fig. 5B).
On the other hand, this cluster could be related to COSMIC Known signature 1 for the following reason. The [T>C]G peaks in this signature are a mirror image of the [C>T]G peaks in COSMIC Known signature 1. If the reference genome (GRCh38) includes many [C>T] substitutions affected by Known Signature 1, the [T>C] substitutions have occurred in the other samples that were not affected by Known Signature 1. If this hypothesis is correct, then this signature does not represent a novel mutation process.
Cluster-1 (Supplementary Fig. S9A) & Cluster-12 (Supplementary Fig. S9B). Both clusters are composed of two signatures, which are found in the stomach and oesophagus. Both signatures have peaks at C[T>C]X and C[T>G]X (X = A, T, G or C), and the second and fourth panels in Figure 9B suggest that they are not related to indels. The detailed mutation context (up to 2 bases from the mutated base) shows that there is a high proportion of XC[T>G]XT (Supplementary Fig. 9C). Of note, these signatures were extracted from adjacent organs such as the stomach and oesophagus.
Cluster-2 & Cluster-11 (Supplementary Fig. 10A). Cluster-11 includes signatures from many organs (breasts, endometrium, large intestine and stomach), and they have peaks at T[C>A]X and T[C>T]X in common (X = A, G, C or T). Furthermore, a similar cluster was detected when dictionary was chosen ( Cluster-2). If we study the mutation context in detail, it offers distinct peaks at TT[C>A]XT and TT[C>T]XG (Supplementary Fig. 10B). Although is a mutation dictionary including indels, signatures belonging to this cluster were not related to indels. In the large intestine, two similar signatures are predicted and belong to this cluster (Predicted Signatures 2 and 7; the 3rd and 4th panels in Supplementary Fig. S10A). One possibility is that these signatures were obtained via a model selection mistake, but the relative contributions of these two signatures are clearly different among samples (Supplementary Fig. S11), thus pointing to the existence of a mutational process with multiple kinds of mutational distributions such as AID/APOBEC family (i.e. Cosmic Known Signatures 2 and 13). Besides, from the appearance of peaks, these signatures are probably related to COSMIC Known Signature 10 associated with POLE defects. If we look at activities (Supplementary Fig. S8), there are many cases in which these signatures are dominant in large-intestine and endometrium samples. Variants of cancer-related genes, POLE and POLD1, have been found in patients with large-intestine or endometrial cancer (Briggs and Tomlinson, 2013; Palles et al. 2013); therefore, the relation between these signatures and COSMIC Known Signature 10 is obvious.
Cluster-6 & Cluster-3 (Fig. 6). The mutation signatures in Cluster-3 are found in many organs such as the prostate, liver, oesophagus, stomach, large intestine and the upper aerodigestive tract (Fig. 6A). When the dictionary is used, a signature is obtained that is similar to Cluster-6 with (Supplementary HTML materials). All the signatures have peaks at the [C>T] substitution in their mutation distribution, and mutation [C>A] or [T>C] is seen in some signatures. In particular, when we see the mutation context for up to 2 bases from a mutation, characteristic peaks were observed at XX[C>T]XG (Fig. 6B). Note that mutation signatures extracted from the oesophagus, liver, prostate and upper aerodigestive tract with have a preference for indels (Fig. 6C). Because they are related to indels and there are peaks at substitutions [C>T], we believe that these signatures have some relation to COSMIC Known Signature 6, which is associated with defective DNA mismatch repair (Fig. 6D). Actually, the cosine distance between any members belonging to this cluster and COSMIC Known Signature 6 is sufficiently small (e.g. cosine distance between Predicted Signature 5 in the oesophagus with and COSMIC Known Signature 6 is 0.1296). If this signature group is related to defective DNA mismatch repair, then this cluster shows an extended sequence context preference for COSMIC Known Signature 6.
Cluster-7 (Supplementary Fig. S12) & Cluster-4. Cluster-7 (Supplementary Fig. S12) is associated with Cluster-4 (shown in the Supplementary HTML material). The signatures in Cluster-7 are found in the stomach, large intestine and endometrium (Supplementary Fig. S12). A similar signature was also extracted from lungs in Cluster-4. Every signature in Cluster-7 has peaks at G[C>T]X, and the signature of the endometrium has peaks at A[C>T]X (Supplementary Fig. S12B). Additionally, mutation signatures from the stomach and large intestine have definite peaks at GG[C>T]XG and TG[C>G]XG in particular (Supplementary Fig. S12B). Besides, any member of Cluster-4 corresponding to this cluster has no indels.
Cluster-9 (Supplementary Fig. S13) & Cluster-8 (Supplementary Fig. S14). Cluster-9 is associated with Cluster-8. In the results on , these signatures were found in the upper aerodigestive tract, lungs and skin (Supplementary Fig. S13A). All the estimated mutation signatures have peaks at C[C>T]X and T[C>T]X, and this tendency is particularly strong when the 3′ adjacent base for the mutation is thymine (i.e. the peaks of C[C>T]C and T[C>T]C are stronger than the other peaks). If we examine the mutation context in detail, there are peaks at XT[C>T]XC (Supplementary Fig. S13B). Furthermore, this cluster may be meaningful because all primary lesions in which these signatures are found are in epithelial tissue and have similar peaks in comparison with COSMIC Known Signature 7 (Supplementary Fig. S13C), which is associated with exposure to ultraviolet light (e.g. cosine distance between Predicted Signature 2 from lungs with and COSMIC Known Signature 7 is 0.2076, which is relatively small). Therefore, the mutational process of these signatures may be related to exposure to ultraviolet light. In particular, Predicted Signature 2 in skin with has a stable relative contribution through samples (Supplementary Fig. S8).
Cluster-3 (Fig. 7). Two mutation signatures in Cluster-3 were found in the stomach and prostate, and they have peaks at C[C>A]X (X = A, C, G or T), especially at C[C>A]A and C[C>A]G (Fig. 7A). The signatures in this cluster are novel because, for example, the known signature most similar to Predicted Signature 7 for the prostate (the bottom panel in Fig. 7A) is COSMIC Known Signature 24, whose cosine distance is 0.7252, and they are clearly different signatures. We found that the signatures in the cluster are similar to Predicted Signature 4 with (Fig. 7B), which has strong peaks at CC[C>A]XX when we see the mutation context in detail (Fig. 7C), indicating that the 5′ base is important for this mutation.
![M1 Cluster-15. This cluster in panel (A) includes three mutation signatures from the large intestine (top), endometrium (middle) and liver (bottom) with the M1 dictionary. The horizontal axis indicates the mutation types in M1, and the vertical axis shows their proportion estimated by our method (cf. Fig. 1). The arrows (in the middle panel) show four peaks in the mutation distribution at X[T > C]G (X = A, T, G or C), which are also observed in the other figures. Panel B illustrates the known COSMIC signature that is the known signature closest to the signatures in M1 Cluster-15](https://oup.silverchair-cdn.com/oup/backfile/Content_public/Journal/bioinformatics/35/22/10.1093_bioinformatics_btz266/3/m_bioinformatics_35_22_4543_f5.jpeg?Expires=1716400992&Signature=kqiLLU-XVsONb-zwZF2XlYXuKtTMvPiixUA947cLif-NBRamcdalA0rJuvmrIU-7GdNirNb2~0LEuIjHRD0n32ImxhQWD8p6Ut4g5aDqwAC3J9NlKqC9cLXFIi1yEqmQ3En03I~GB00mOJbyTztoSFlzyB7nIyNa27p3uQfUahaVYTUm7FD~e9TPkhbkoyCqwnQdAbDDjytqSd6jrea8aYd2xhCZfYeYtMy4--YYiBycZeD6KaLAX-5ELG7BBLLvTojjQwHPS50H7M65kM3Mr7ylujlWPD5wBSvEkxGc3BB-BK4prFWkneVXNHVfebKYuMq5BrN-Rhkw-q43sM7BkA__&Key-Pair-Id=APKAIE5G5CRDK6RD3PGA)
Cluster-15. This cluster in panel (A) includes three mutation signatures from the large intestine (top), endometrium (middle) and liver (bottom) with the dictionary. The horizontal axis indicates the mutation types in , and the vertical axis shows their proportion estimated by our method (cf. Fig. 1). The arrows (in the middle panel) show four peaks in the mutation distribution at X[T > C]G (X = A, T, G or C), which are also observed in the other figures. Panel B illustrates the known COSMIC signature that is the known signature closest to the signatures in Cluster-15
![M4 Cluster-3. (A) Six predicted mutation signatures (for the prostate, liver, oesophagus, stomach, large intestine and upper aerodigestive tract) with respect to the substitution in this cluster, where mutation context of substitutions in M4 is transformed to that of M1 as described in Section 2.4, and the horizontal axis denotes the type of mutations in M1. All the signatures have peaks at the [C > T] mutation (blue bars in A), and mutation [C > A] or [T > C] is seen in some signatures. (B) In the figure showing the context in detail, the horizontal axis means a mutation context of [C > T] substitutions in M2. In particular, when we see the mutation context for up to 2 bases from a mutation, large peaks were observed at XX[C > T]XG as the four arrows indicate. (C) In the indel graph, the horizontal axis means mutation types of MI, and signatures extracted from the oesophagus, liver, prostate and upper aerodigestive tract with M4 have indels as their cause. (D) In addition, the bar graph presents COSMIC Known Signature 6, which is the most similar known signature (e.g. cosine distance between it and Predicted Signature 5 in the oesophagus with M2 is 0.1296)](https://oup.silverchair-cdn.com/oup/backfile/Content_public/Journal/bioinformatics/35/22/10.1093_bioinformatics_btz266/3/m_bioinformatics_35_22_4543_f6.jpeg?Expires=1716400992&Signature=yb1vbFLBypQXLewM7jocCJ9HSVkPLyOX4Z4kqeLeUqTny8YfjOKwzjVkafSVGkcUrIQO1Dz3y2OgybDKmNE33vNROkxL-Yo0tzVQ~~me0uNCzqav51Ou8izpZDqr0jo6zHF4s6dFGm9BUQNRTWmH6oWdXM7w58uyoIVcSe6nJdVVsGfP3Lt4yyx8vcKiN281v8YweD73xcM7T5rYZopEGROs7u2WBiOSVLK-NO8Kd13YQXcRqibJCLVx7HUBolSHJuWcjhZxgXeF0cC-CMKdaFzViLRh5JKfO~u6lqbujCVIQybLqqX30DLM8QNIvDeOZA4iOFNJL1dtHeKKZextfw__&Key-Pair-Id=APKAIE5G5CRDK6RD3PGA)
Cluster-3. (A) Six predicted mutation signatures (for the prostate, liver, oesophagus, stomach, large intestine and upper aerodigestive tract) with respect to the substitution in this cluster, where mutation context of substitutions in is transformed to that of as described in Section 2.4, and the horizontal axis denotes the type of mutations in . All the signatures have peaks at the [C > T] mutation (blue bars in A), and mutation [C > A] or [T > C] is seen in some signatures. (B) In the figure showing the context in detail, the horizontal axis means a mutation context of [C > T] substitutions in . In particular, when we see the mutation context for up to 2 bases from a mutation, large peaks were observed at XX[C > T]XG as the four arrows indicate. (C) In the indel graph, the horizontal axis means mutation types of , and signatures extracted from the oesophagus, liver, prostate and upper aerodigestive tract with have indels as their cause. (D) In addition, the bar graph presents COSMIC Known Signature 6, which is the most similar known signature (e.g. cosine distance between it and Predicted Signature 5 in the oesophagus with is 0.1296)
![M3 Cluster-3. (A) Two mutation signatures (from the stomach and prostate) included in this cluster; the arrow points to peaks at C[C > A]A and C[C > A]G. (B) The (marginalized) Predicted Signature 4 in the prostate (with the M4 dictionary) similar to the signatures in M3 Cluster-3, where the arrow indicates the peaks at C[C > A]X (X = A, G, C or T). (C) The detailed mutation context (up to 2 bases from the mutation) for the C[C > A]X peaks in the mutation signature shown in (B); the arrows indicate CC[C > A]XX peaks (X = A, G, C and T)](https://oup.silverchair-cdn.com/oup/backfile/Content_public/Journal/bioinformatics/35/22/10.1093_bioinformatics_btz266/3/m_bioinformatics_35_22_4543_f7.jpeg?Expires=1716400992&Signature=PdchDzO6vLj6CVyvSYkkdqRqBa-5rAHWbwhNR82mlSwza660Y-ybRMKvO7S~gJwCUW6DKuGgyk5o5wRzcYyk991fk7nhcKcQlkG2NDoA6Q4LbLL4NVOxhyu1DmUpn3bNOpSFSUmCp7kXCjF9z84bTCDKJVQZiuYxFjPaOGqY2asDG9cgVVycjIr3Q-GT7wbBfdo7KtjPnO5N8wuQpn3KvYQ2dQpy3kKhJTJnon36r8fl7CJqayu02JxU57bG2XrqTqppX82vBcfVJ~rlTpfNQNgad2k7h6uAgNdSGh8vyAwjrPShBVMXxrC56x3l79qVSsFQckb0hoh2hOHsEM37UQ__&Key-Pair-Id=APKAIE5G5CRDK6RD3PGA)
Cluster-3. (A) Two mutation signatures (from the stomach and prostate) included in this cluster; the arrow points to peaks at C[C > A]A and C[C > A]G. (B) The (marginalized) Predicted Signature 4 in the prostate (with the dictionary) similar to the signatures in Cluster-3, where the arrow indicates the peaks at C[C > A]X (X = A, G, C or T). (C) The detailed mutation context (up to 2 bases from the mutation) for the C[C > A]X peaks in the mutation signature shown in (B); the arrows indicate CC[C > A]XX peaks (X = A, G, C and T)
3.3 Further discussion
In this study, we proposed a method for estimating mutation signatures; the advantage of this method is the mathematical validity in model selection (i.e. selecting the number of mutation signatures), compared with existing methods that involve ad hoc approaches or improper approximation for model selection. To test whether this mathematical justification is effective for the estimation of the number of signatures and validity of the obtained signatures, we compared VB-LDA with the existing method EMu and probabilistic latent semantic analysis (PLSA), which is the probabilistic model that Dirichlet distribution of a prior is excluded from LDA. Details are given in the Supplementary material (Supplementary Section 4). In summary, from the viewpoint of model selection, we confirmed via the simulation that VB-LDA is superior to EMu (if a mutation opportunity is not considered) and to PLSA. Nevertheless, in benchmarking using real data, it was not possible to compare the effectiveness because the true signature set could not be known.
In addition to the signatures listed in Section 3.2.2, novel mutation signatures that are consistently active in multiple samples were found. In the clustering method (cf. Section 3.2.2), more reliable signatures are selected on the basis of the criteria that similar signatures are obtained from multiple independent primary lesions. Nevertheless, there may exist mutational processes that are active only in a specific primary lesion, and the reliability of those signatures can be indicated by high activity in multiple samples. Specifically, Signature 6 in the lung with and Signature 1 in the endometrium with are mutation signatures whose median and average values of activities were greater than 0.05 and whose cosine distance to known signatures was greater than 0.2 (Supplementary Fig. S15). The former has peaks at C[C > A]A and T[C > A]G, and the latter has peaks at XX[C > A]XT (Supplementary Fig. S15). Especially signature 1 in the endometrium with (Supplementary Fig. S15C) forms a cluster with signature 5 in the large intestine with , and the activity also shows a moderate value (the median and means are 0.0563 and 0.0413).
It is widely known that different signatures are obtained for different tissues even with the same primary lesion (Alexandrov et al., 2013b). In the present study, we did not conduct analysis by further distinguishing the mutation catalog of the same primary lesion by histological or a site subtype information because the number of samples included in one dataset becomes insufficient to apply our method (cf. Section 3.1). For example, investigating the signature activity of soft tissue with M2 dictionary (Supplementary Fig. S16), four signatures were predicted and only one signature is dominantly active in each sample that corresponds to one of the three site subtypes (fibrous tissue of uncertain origin, striated muscle and blood vessels). Therefore, to make effective use of those information, increasing the number of samples and using the resampling technology typified by the bootstrap method may be essential to avoid overfitting.
This study uncovered multiple signatures that cause indels as well as substitutions (e.g. Cluster-3). Nonetheless, it has been shown that indel-generating processes depend on not only sequence context/indel length but also the features of the surrounding sequence such as overlapping micro-homology (Alexandrov et al., 2018; Nik-Zainal et al., 2016), which cannot be captured by conventional models. In addition, we did not include variants other than substitutions and indels (e.g. rearrangement) in the vocabulary of a mutation dictionary. Particularly, in recent years, there have been reports of signatures in which a rearrangement is present specifically (Nik-Zainal et al., 2016). Thus, to elucidate the whole mutation signature, it is necessary to pay attention to these mutations as well as substitutions and indels.
Furthermore, it may be necessary to review how to analyze the mutation context. In our study (and other existing studies), only two bases upstream and downstream of the mutated base were incorporated into the mutation context. With or , there were many mutation signatures depending on the mutation context upstream or downstream by 2 bases from the mutated base [e.g. Predicted Signature 3 in the prostate with (Fig. 6B)], suggesting that a signature depends on the mutation context 3 bases or more away from the mutated base. From the viewpoint of sparseness of data, it is difficult to analyze samples with a new mutation dictionary taking into account longer mutation contexts as compared to and . For example, if 3 bases upstream and downstream of a mutated base are included in the mutation context, the size of that mutation dictionary is equal to 24 576 for substitutions. Further studies should be conducted regarding how to define more complicated and informative mutation dictionaries (e.g. by considering longer mutation contexts).
Our computational study indicates that our method not only successfully estimates the number of mutation signatures on simulated data but also predicts several new mutation signatures whose reliability is provided by signature activity and clustering of signatures. On the other hand, the computational experiments also clarify several limitations of the proposed method (e.g. some known signatures could not be recovered; more than two very similar signatures are estimated in one cancer type), and further studies are necessary for improvement of the method. In particular, to determine one mutation signature corresponding to one mutational process, it is necessary to select the ‘representative’ signature or merge multiple ones obtained from all the primary lesions in which that mutational process acts. Although the mutational distribution of the extracted signature may be slightly different, we should not separate samples for each primary lesion but rather analyze the samples collectively to solve this problem. Nevertheless, in this case, the complexity of the dataset increases, making identification of the signatures difficult. Therefore, we are now devising a new Bayesian hierarchical model to extract mutation signatures where the hyperparameters of a prior distribution in LDA capture the features of each primary lesion (Supplementary Fig. S20). By means of such a model, it becomes possible to analyze samples collectively, with sharing of mutational distributions of signatures among primary lesions. We expect that this model will produce a set of signatures that do not include multiple signatures from the same mutational process.
4 Conclusion
In this study, we proposed an effective method for determining the number and characteristics of mutation signatures by VB-LDA, and discovered many interesting mutation signatures, which might be novel, for mutation data of various cancer genomes with four mutation dictionaries. Compared with other existing approaches, our method employs a different approach for model selection, thereby leading to different mutation signatures. Furthermore, we introduced a hierarchical clustering procedure for predicted mutation signatures in addition to known signatures and obtained better information about which mutation signature appears in which primary lesion and where peaks appear in specific mutation signatures. All the predictions are freely available on our website (http://www.f.waseda.jp/mhamada/MS/index.html), which will be a useful resource for cancer research.
Although we discovered interesting mutation signatures in this study, we could not determine biological implications of the newly found mutation signatures (note that mutational processes for most of known signatures in the COSMIC database are unknown). In the future, we should consider the correspondence between mutation contexts of these signatures and actual etiology. These data will lead to further understanding of carcinogenic mechanisms and early diagnosis of cancers.
Acknowledgements
Computation for this study was partially performed on the NIG supercomputer at ROIS National Institute of Genetics. YU is currently working at a pharmaceutical company in Japan.
Funding
This work was supported by the Ministry of Education, Culture, Sports, Science and Technology (MEXT) [KAKENHI grant numbers JP18KT0016, JP17K20032, JP16H05879, JP16H01318 and JP16H02484 to M.H.] JST CREST Grant Number JPMJCR1881, Japan and by a Waseda University Grant for Special Research Projects (Project Number: 2017A-506).
Conflict of Interest: none declared.
References

