


Abstract
Cancer genomics studies frequently aim to identify genes that are differentially expressed between clinically distinct patient subgroups, generally by testing single genes one at a time. However, the results of any individual transcriptomic study are often not fully reproducible. A particular challenge impeding statistical analysis is the difficulty of distinguishing between differential expression comprising part of the genomic disease etiology and that induced by downstream effects. More robust analytical approaches that are well-powered to detect potentially causative genes, are less prone to discovering spurious associations, and can deliver reproducible findings across different studies are needed.
We propose a set-based procedure for testing of differential expression and show that this set-based approach can produce more robust results by aggregating information across multiple, correlated genomic markers. Specifically, we adapt the Generalized Berk–Jones statistic to test for the transcription factors that may contribute to the progression of estrogen receptor positive breast cancer. We demonstrate the ability of our method to produce reproducible findings by applying the same analysis to 21 publicly available datasets, producing a similar list of significant transcription factors across most studies. Our Generalized Berk–Jones approach produces results that show improved consistency over three set-based testing algorithms: Generalized Higher Criticism, Gene Set Analysis and Gene Set Enrichment Analysis.
Data are in the MetaGxBreast R package. Code is available at github.com/ryanrsun/gaynor_sun_GBJ_breast_cancer.
Supplementary data are available at Bioinformatics online.
1 Introduction
A common goal in transcriptomic analysis is to identify genes that are differentially expressed between subjects with different disease prognoses or outcomes, e.g. comparing cases and controls. The hypothesis driving these analyses is that genes differentially expressed between phenotypes are mechanistically linked with the differences between those phenotypes (Sørlie et al., 2001; Sotiriou et al., 2003; Van De Vijver et al., 2002; Van’t Veer et al., 2002; Wang et al., 2005). However, to fully understand the implications of such associations, one must determine whether differentially expressed genes are inducing the disease, or whether their expression profiles are a product of the phenotype. Reactive genes falling into the second category are of much less relevance in understanding disease processes and causality.
There is a growing body of evidence suggesting that in disease, most genes are reactive rather than causative. For example, it has been shown in breast cancer patients that a large number of genes are differentially expressed simply because of their association with proliferation genes (Venet et al., 2011). In other words, while proliferation genes are indeed expressed at levels associated with disease state, they have far-ranging, secondary effects on the expression of many other genes. As a result of these far-ranging but non-causative effects (Desmedt et al., 2008; Mosley and Keri, 2008), different studies often find distinct sets of differentially expressed genes. This observation may in part explain the finding that many published breast cancer outcome signatures perform worse than signatures composed of random genes (Venet et al., 2011). As a result, the breast cancer literature contains many reactive genes that have been mistakenly identified as instigators of the disease (Klein et al., 2017). Such difficulties underscore the need to develop statistically principled methods that can account for artificially significant genes and identify the genes that truly promote carcinogenic behavior (Wirapati et al., 2008).
Motivated by these challenges, we present a set-based approach to testing for expression signatures important to disease. Our key innovation is to employ the Generalized Berk-Jones (GBJ) statistic, which provides a powerful and robust tool for inference on differential expression. The GBJ statistic was originally developed for set-based inference in GWAS datasets (Sun et al., 2019), but we show that it can be adapted for expression studies as well. A major advantage of our approach is that testing for association using a group of genes allows pooling of data across all members of a set, which provides valuable additional information. In the GWAS setting this pooling allows for increased power in detecting sparse individual-single nucleotide polymorphism effects, but when testing for differential expression, the additional information serves to limit the detection of spurious associations. For example, deceptive signals from proliferation-related genes will be dampened by proliferation-independent genes in a set containing mostly downstream effects of breast cancer. Sets can be formed based on a variety of characteristics, and set-based interpretations may even be more informative than single-gene effects.
In this paper, we focus specifically on identifying the transcription factors that promote tumor progression in breast cancer. Because breast cancer possesses a complex genetic etiology (Alexandrov et al., 2013; Balmain et al., 2003), we may expect a large number of biologically relevant, differentially expressed genes; thus set-based measures of association are appropriate. We focus on transcription factors both because they provide convenient groupings of genes based on their regulons and because these genes may also provide higher-order insight, as opposed to genes marking the end of the transcriptional cascade. If a certain transcription factor is crucial to higher grade tumors, then we would expect the majority of genes regulated by that transcription factor to be expressed differentially in patients with higher grade tumors. In contrast, those transcription factors that are not important to disease progression should generally be associated with regulons containing genes that do not show differential expression. While individual genes may demonstrate artificial significance, the use of gene sets can downweight these contributions by requiring differential activation of coherent biological processes.
It is also important to note that although we are performing set-based inference, the overall goal is still to draw conclusions about the role of single genes, in this case individual transcription factors. The unique regulatory positions of transcription factors create important opportunities for understanding functional genomic pathways in the etiology of breast cancer, and these pathways provide an ideal setting for set-based testing.
To illustrate the robustness of our method and to empirically demonstrate the reproducibility of our results, we perform the analysis on 21 publicly available breast cancer transcriptomic datasets. Our primary finding is that genes regulated by transcription factors in the E2F family are significantly differentially expressed between high grade and low grade breast cancer tumors. This E2F finding is replicated across almost all of our datasets, and it is also the most significant result in a meta-analysis integrating data from all studies. Beyond E2F, GBJ generally also identifies the same group of sets as the most significant associations of each individual study.
Performance of the GBJ approach is benchmarked by standard single-gene models as well as three other set-based approaches utilizing the Generalized Higher Criticism (GHC) (Barnett et al., 2017), Gene Set Analysis (GSA) (Efron and Tibshirani, 2007) and Gene Set Enrichment Analysis (GSEA) (Subramanian et al., 2005). Single-gene analysis of the largest dataset in our study finds E2F2 and E2F7 to be two of the most significant genes associated with breast cancer disease progression, but these results cannot be replicated in many of smaller datasets in our study, succinctly illustrating the replicability issues in traditional inference for differential expression. It is likely that the analysis is hindered in smaller datasets by a lack of power or the confounding effects of downstream mechanisms, as detailed above. Additionally, all three of the alternative set-based testing approaches demonstrate more variability across studies. If our 21 different datasets had been analyzed in 21 manuscripts, using a GHC, GSA, or GSEA approach in all 21 would result in more ‘discoveries’ and fewer replications than using GBJ in each study.
2 Materials and methods
2.1 Transcription factor regulon sets
A key starting point for our proposed GBJ approach is the definition of accurate and interpretable transcriptomic sets. If sets are poorly defined, there can be a loss in power because real effects can be diluted by extraneous noise, or results may not even be relevant to the scientific question of interest. For our study, it is important to define sets that contain all genes regulated by a given transcription factor and only genes regulated by that transcription factor (Vaquerizas et al., 2009). Thus testing the association between regulon-based gene sets and tumor grade corresponds to testing the association between transcription factors and tumor grade.
We employ a list of 615 transcription factor gene sets taken from MSigDB (C3 Collection), which is a manually curated list of transcription factor regulons provided by the Broad Institute (Subramanian et al., 2005; Xie et al., 2005). The regulons are grouped by sequence motifs that are known or likely cis-regulatory elements in promotors. Because all genes in a set share a common motif in their non-protein coding regions, they are likely to be regulated by the same transcription factor. While this collection does not constitute an exhaustive list of transcription factors and the genes they regulate, to our knowledge it is one of the most complete and reliable efforts to compile such information.
We manually remove some extremely large gene sets, as these highly heterogeneous sets are difficult to interpret and are likely to show association with many outcomes through sheer chance. Specifically, we remove the 22 gene sets each containing more than 900 genes. This threshold is chosen through inspection of the gene size distribution (see Supplementary Fig. S1), and increasing or decreasing the threshold by even 100 genes affects only a small handful of sets; these sets do not materially change the results. The final analysis contains 593 sets. We also provide the number of sets that each individual gene belongs to in Supplementary Figure S2. Finally, we note that some transcription factors are used to define multiple, distinct gene sets in the list. This overlap occurs when multiple binding motifs correspond to the same transcription factor.
2.2 Transcriptomic data collection
Data on expression levels are obtained from the MetaGxBreast R package (Zon et al., 2018). This compendium comprises one of the largest sources of microarray data on breast and ovarian cancer to date, and its manual curation and pre-processing pipelines have been previously described (Ganzfried et al., 2013). Briefly, the package includes gene-level expression data for breast cancer tumors from 38 transcriptomic datasets collected in different studies around the world. Replicate samples are removed and data are standardized across studies (Zon et al., 2018). We first remove all datasets without tumor grade and all datasets without at least five individuals in both grades 1 and 3. Summary statistics pertaining to the remaining 21 datasets are provided in Table 1. The smallest dataset contains n = 37 patients from a study conducted at the Osaka University Graduate School of Medicine, while the largest contains n = 1127 patients from the Molecular Taxonomy of Breast Cancer International Consortium (METABRIC).
Summary data from the 21 MetaGxBreast datasets used in the main analysis
| Dataset | n | Grade 3 | ER positive | HER2 positive | Mean age |
|---|---|---|---|---|---|
| CAL | 71 | 61 (85.9%) | 48 (67.6%) | — | 55.7 |
| DFHCC | 87 | 64 (73.6%) | 48 (55.2%) | 28 (32.2%) | 54.5 |
| DFHCC2 | 68 | 58 (85.3%) | 16 (23.5%) | 13 (19.1%) | 52.2 |
| EXPO | 183 | 151 (82.5%) | 81 (52.6%) | 44 (30.6%) | 56.9 |
| GSE25066 | 291 | 259 (89%) | 129 (44.8%) | 3 (1.1%) | 49.5 |
| GSE32646 | 37 | 21 (56.8%) | 20 (54.1%) | 10 (27%) | 52.8 |
| GSE58644 | 185 | 159 (85.9%) | 122 (66.3%) | 40 (22%) | 57.1 |
| IRB | 97 | 70 (72.2%) | 49 (50.5%) | 23 (23.7%) | |
| MAINZ | 64 | 35 (54.7%) | 43 (67.2%) | — | 57.3 |
| MAQC2 | 136 | 123 (90.4%) | 61 (44.9%) | 32 (23.5%) | 51.9 |
| METABRIC | 1127 | 957 (84.9%) | 738 (66%) | 126 (24.7%) | 59.6 |
| NCI | 61 | 45 (73.8%) | 37 (60.7%) | — | 58.3 |
| NKI | 228 | 149 (65.4%) | 152 (66.7%) | — | 43.8 |
| PNC | 83 | 70 (84.3%) | 43 (51.8%) | 24 (28.9%) | 56.3 |
| STK | 89 | 61 (68.5%) | 69 (77.5%) | — | 55.3 |
| STNO2 | 64 | 53 (82.8%) | 41 (65.1%) | — | 56.9 |
| TRANSBIG | 113 | 83 (73.5%) | 64 (56.6%) | — | 45.8 |
| UCSF | 88 | 74 (84.1%) | 46 (58.2%) | 8 (24.2%) | 54.5 |
| UNC4 | 163 | 138 (84.7%) | 86 (53.4%) | 27 (19.6%) | 56.3 |
| UNT | 61 | 29 (47.5%) | 41 (70.7%) | — | 51.1 |
| UPP | 121 | 54 (44.6%) | 95 (80.5%) | — | 61.1 |
Note: Counts and proportion of subjects with grade 3, ER-positive and HER2-positive designations are provided, along with mean age of subjects in each study. Certain categories, for example HER2 status, are not available for all studies.
As an additional processing step, we remove all patients who do not present with the estrogen receptor (ER)-positive subtype, as breast cancer is known to exhibit heterogeneous behavior across different subgroups. In particular, ER-positive and ER-negative subtypes are known to exhibit different prognostic signatures (Beck et al., 2013), and thus including ER-negative patients would confound the analysis. We choose to focus on the homogeneous group of ER-positive subjects because it is the more common subtype and correspondingly larger sample. The sample size of ER-negative patients is small enough that traditional asymptotic-based statistical measures may be challenged, but similar analysis would be of interest with a larger sample.
Tumor grade is assessed ordinally with possible values of 1, 2 and 3; a grade of 2 is often given to patients with intermediate prognosis and could potentially represent a broad range of disease status (Rakha et al., 2010). For our main analysis, we remove all subjects in grade 2 due to (i) the possibility that systematic differences in grade 2 classifications across hospitals could confound the analysis and because (ii) the GBJ framework can be more straightforwardly presented for a binary outcome, which allows for the modeling of marginal associations between gene expression and outcome with conventional logistic regression. As the modeling of marginal associations does not comprise part of our original methodological contribution, we consider only grades 1 and 3 in the main analysis for sake of presentation. However, it is certainly still important to demonstrate our approach using the full dataset; therefore, we show how to use a cumulative logit model to analyze the full dataset in the Supplementary Materials.
2.3 The GBJ statistic
We use the recently-developed GBJ statistic to test for association between a group of regulated genes and breast cancer tumor grade. The general procedure for our analysis is represented by Figure 1, where the GBJ statistic implements the set-level testing of the third panel. GBJ is derived from a class of tests that possesses certain optimality guarantees in set-based testing, and it has been shown to provide more power than alternatives when signals in a set are correlated and moderately sparse. GBJ also demonstrates robust power across a range of sparsity settings, in contrast to methods that may show much less power when signals are very sparse or very dense. The sparsity of signals in a group of regulated genes is unknown and may vary widely, but GBJ offers reliable and powerful inference across a variety of situations.
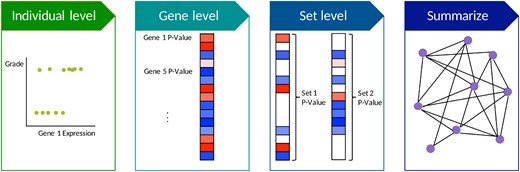
Analysis pipeline for identifying differentially expressed gene sets between breast cancer tumor grades. For each dataset, observational data is used to calculate the associations between genes and tumor grade. The genes are then grouped into gene sets and tested. Results can be compared across multiple studies via meta-analysis. We visualize meta-analysis results in network form
One unique feature of GBJ is a data-adaptive thresholding mechanism that determines a custom significance threshold in every set, given the size of the set and correlation structure of the test statistics. Since genes regulated by the same transcription factor will generally show correlated expression patterns, and because there may only be a subset of regulated genes that possess functional roles in disease progression, GBJ provides a natural fit for the present setting. Additionally, while other popular methods such as GSEA utilize a number of ad-hoc steps and rely on permutation to perform inference, GBJ requires no tuning parameters and offers an analytic P-value calculation. Supplementary Table S2 demonstrates the accuracy of this calculation for the correlation structures found in gene expression data.
Let index the different datasets we are using from MetaGxBreast. Suppose in dataset m we have observations from different subjects. For the sake of presentation, in the rest of this section we will suppress the dependency on m and assume that we are working with data from only one study. Given a transcription factor regulon set of size d genes, let denote the (preprocessed) gene expression values for subject i over the d genes in that set. In other words, describes one subject’s expression for d genes that are regulated by the same transcription factor. Let Yi denote the patient’s tumor grade, where in the main analysis Yi = 1 if the tumor is grade 3 and Yi = 0 if the tumor is grade 1.
The dichotomization of the data between grades 1 and 3 naturally suggests a logistic regression model with tumor grade as the outcome, although much of our development is also valid for any generalized linear model with canonical link function (McCullagh and Nelder, 1989). For a framework capable of analyzing ordinal tumor grades of 1, 2 and 3, a separate cumulative logit model is presented in the Supplementary Methods. All results presented in the main text hereafter refer to the comparisons between grade 1 and grade 3, unless otherwise stated.
Let g denote the value of the observed GBJ statistic. The P-value of g can be calculated by inverting g with generic root-finding algorithms to find d boundary points. The boundary point bj determines the limit on the jth-largest absolute value of Z. If the jth-largest absolute value of Z>bj, then the observed statistic would be larger than g. Approximating S(t) as an Extended Beta-Binomial random variable at the boundary points allows for analytical P-value calculations (Sun et al., 2019).
Due to the difficulties of standardizing data across 21 studies, the model in Equation (1) contains no non-expression covariates. As a sensitivity analysis assessing the impact of possible model misspecification, we also perform an entirely separate analysis that considers the comparison between grade 1 and grade 3 and includes age at initial pathologic diagnosis as a covariate in Equation (1). Four studies (‘IRB’, ‘USCF’, ‘NCI’ and ‘NKI’) show large degrees of missingness in the age covariate and are excluded from the age-adjusted sensitivity analysis, resulting in the consideration of 17 studies. In our cumulative logits analysis considering tumors of grades 1, 2 and 3 we again exclude studies with notable missingness (‘USCF’, ‘NCI’ and ‘KI’) and a study that did not contain any participants with grade 2 tumor (‘PNC’), for a total of 17 studies again.
2.4 Normalization of GBJ statistics
We observed during standard single-gene analyses that test statistics for association were significantly more dilated than would be expected under the theoretical N(0, 1) distribution. This diagnostic suggested possible unmeasured covariates, such as batch effects, that could lead to inflated test statistics (Efron, 2012). As each study provided differing amounts of data, we decided the most uniform correction method would be to normalize the statistics by employing an empirical null distribution (Efron, 2004) for all marginal tests of association. More specifically, we first used Poisson regression density estimation (Efron et al., 2001) separately in each study to estimate the empirical null distribution of marginal test statistics for the association between a single gene and outcome [Equation (2)]. The test statistics were binned, and counts of the test statistics in each bin were modeled according to a Poisson distribution. Fitted counts were obtained from the regression, and the mean and variance of the empirical null were obtained by matching the shape of the fitted counts to a normal distribution [see Remark D of Efron et al. (2001) for full details]. All Z-statistics used to calculate the GBJ statistic in Equation (2.2) were then scaled so that their P-value under the theoretical null would match the P-value of their unscaled version under the empirical null. For example, if the empirical null in the first study was calculated to be N(0, 2), then a test statistic Zj = 3 in that study would be scaled to so that the P-value of the scaled statistic under N(0, 1) was equal to the P-value of the unscaled test statistic under the empirical null (P = 0.134).
2.5 Set-based and single-gene benchmarks
We compare our GBJ analysis against two categories of substitute methods. First, instead of GBJ, we apply three alternative set-based testing approaches to test the significance of transcription factor regulons. The GHC, GSEA and GSA are existing tools popularly used for performing set-based inference in related settings, and we integrate them in place of GBJ. To avoid inconsistencies in the handling of missing data between the different approaches, we exclude three studies from the comparative analysis (‘USCF’, ‘NCI’ and ‘NKI’) for containing multiple missing values, resulting in a comparison across 18 studies (‘IRB’ only showed missingness in age).
Second, we perform single-gene analysis using the Generalized Linear Model in Equation (1) with d = 1. Thus instead of performing set-based inference, we simply test one gene at a time. This model is applied to all individual genes in each of the 21 studies, although we focus on results for seven individual genes in the E2F family—E2F1, E2F2, E2F3, E2F4, E2F5, E2F6, E2F7 and E2F8.
2.6 Meta-analysis of study-specific results and network analysis
In addition to analyzing each dataset independently, we summarize our findings about the transcription factors most important to breast cancer progression by performing a meta-analysis using all 21 datasets. For each gene set l, we form a set using the 21 study-specific P-values corresponding to the gene set, where is the GBJ P-value for set l in study m. We then use Fisher’s method of combining P-values to generate one single measure of association for each gene set.
The gene sets that pass Bonferroni correction for multiple testing after meta-analysis are analyzed in EnrichmentMap version 3.0 (Merico et al., 2010), provided through Cytoscape version 3.4.0 (Shannon et al., 2003). EnrichmentMap creates a network with each node representing a transcription factor binding site, and the nodes are connected according to overlap in the genes that belong to the regulons of each node.
3 Results
3.1 Top transcription factors implicated in breast cancer tumor gradation
We begin by describing the most significant transcription factors from our main GBJ analysis. A discussion regarding the replicability of these results follows in the next subsection.
After meta-analysis over all 21 studies, 33 of the 593 total gene sets demonstrate statistical significance at a Bonferroni-corrected level of . When viewing the complete list of gene set results (Supplementary Table S1), we immediately see that many of these top sets are related to the E2F family of transcription factors, meaning each set contains genes that possess motifs in their 3’UTR matching a given E2F annotation. We report the results for the 10 most significant gene sets in Table 2, including their associated transcription factor and meta-analysis P-value. The top gene sets are all regulons of the E2F family, and all pass the Bonferroni-corrected level. In other words, GBJ finds that all of the top 10 gene sets deemed to significantly affect ER-positive breast cancer tumor progression are sets of genes that contain a binding motif matching the annotation for a transcription factor in the E2F family.
Top ten transcription factor gene sets associated with breast cancer tumor grade after meta-analysis of GBJ results in 21 studies
| Set name (MSigDB) | Transcription factor | Meta-analysis P-value |
|---|---|---|
| E2F1DP2_01 | E2F1 | |
| E2F_Q3 | E2F family | |
| E2F_Q6_01 | E2F4 | |
| E2F1DP1RB_01 | E2F1 | |
| E2F_Q6 | E2F4 | |
| E2F_Q4 | E2F4 | |
| E2F1_Q6 | E2F1 | |
| E2F1_Q3 | E2F1 | |
| E2F4DP2_01 | E2F4 | |
| E2F1DP1_01 | E2F1 |
Note: Each of the 593 TF sets considered consists of all genes regulated by a given transcription factor.
Figure 2 demonstrates the largest connected component of the EnrichmentMap network constructed from all 33 gene sets passing Bonferroni correction for multiple testing. The network further illustrates the importance of E2F, as the largest connected component almost exclusively contains nodes related to E2F. This component specifically contains 18 out of the 33 nodes; no other gene sets cluster together in connected components. We can interpret this network as additional evidence that many of the genes regulated by E2F transcription factors are the most significant genes associated with ER-positive breast cancer tumor progression. We note that though many gene set names include the string ‘E2F’, not all are related to the E2F family; each name is given a more detailed description in MSigDB. However, many of the nodes are still related to E2F.
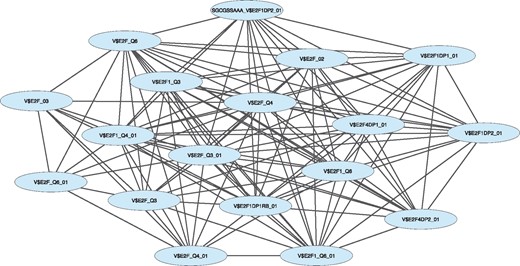
Map of the community identified from a network analysis performed on the meta-analysis of the GBJ results across 21 studies. The nodes represent the transcription factor sets; edges connecting nodes indicate that the nodes share many genes in common
Results for the cumulative logit model incorporating all three grades demonstrate a high degree of overlap with the main analysis. The top 10 gene sets all again demonstrate E2F family connections (Supplementary Table S4), and the network constructed for all sets passing the Bonferroni-corrected significance level (Supplementary Fig. S7) appears similar to Figure 2. In fact, the largest connected component of Supplementary Figure S7 contains the same 18 nodes found in Figure 2.
3.2 Replicability of gene set associations
The full results of our set-based GBJ analysis are presented in Figure 3, where we show a heatmap of P-value rank for each gene set in each study. We show the set rankings instead of actual P-values because the studies vary greatly in their sample size, so the larger studies will tend to have much smaller P-values simply because they have more subjects. The heatmap of the P-values is provided as Supplementary Figure S3. Studies are ordered according to their final sample size in the analysis, while gene sets are ordered according to their METABRIC study P-value. From the rank-based plot, it is immediately obvious that GBJ selects the same top gene sets in almost every study. Outside of the outliers UNC4 and CAL, each of the other 19 studies appears to agree on the top 5–10% of significant transcription factors. In other words, if each of these studies had been analyzed (with GBJ) by separate groups publishing separate manuscripts, the large majority of the 21 manuscripts would agree on the top transcription factors. Even though some of the smaller studies possess sample sizes that are almost two orders of magnitude less than METABRIC, the smaller studies still often show the same top gene sets.
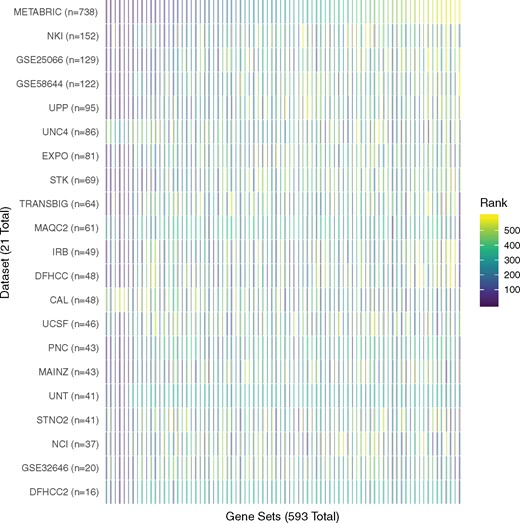
Heatmap for significance rank of 593 gene sets across all 21 studies. Rank 1 corresponds to the lowest P-value achieved in the study, and rank 593 corresponds to the largest P-value for that study. The studies are ordered by size, and the gene sets are ordered according to their rank in the largest study
There is less agreement among gene sets in the bottom 90% of the rankings, but this disagreement is to be expected. If such sets truly demonstrate no association with the outcome, then by definition their P-values are generated at random from a standard uniform distribution, and we should not expect to see any coherent pattern among the non-significant sets. In a typical analysis, gene sets not demonstrating significance are usually ignored and not reported. We see essentially the same level of replicability in the sensitivity analysis that adjusts for age as a covariate (Supplementary Figs S4 and S5) and when using the cumulative logit model that considers tumors of all grades (Supplementary Figs S8 and S9).
We quantify the level of overlap more specifically in Figure 4, which shows the number of unique gene sets that would be represented in a list containing the top x sets from each study, where x is given by the x-axis. That is, at x = 1, the y-axis value is the number of unique gene sets named as the most significant set across all 18 studies (three studies are removed from the comparison with alternative methods due to missing data, and a small number of individuals with missing data are also removed from the 18 remaining studies). We allow the x-axis to range from 1 to 59 to cover the entire top 10 percentile. GHC, GSA and GSEA all appear to perform materially worse than GBJ. GSEA reports a similar number of unique sets when the amount of sets to be reported is small, but performance gradually decreases as more sets are reported. Both GHC and GSA report a markedly larger number of unique results than either GSEA or GBJ. In general, performing analyses using one of the non-GBJ approaches would uncover a broader list of gene sets, especially when studies contain fewer subjects and are subject to more variance (Supplementary Fig. S6). It follows that there would be fewer replicated results if all analyses were performed using GHC, GSA or GSEA, leading to greater confusion about the transcription factors that warrant follow-up studies. A similar outperformance of GBJ in the cumulative logit framework is observed in Supplementary Figure S10.
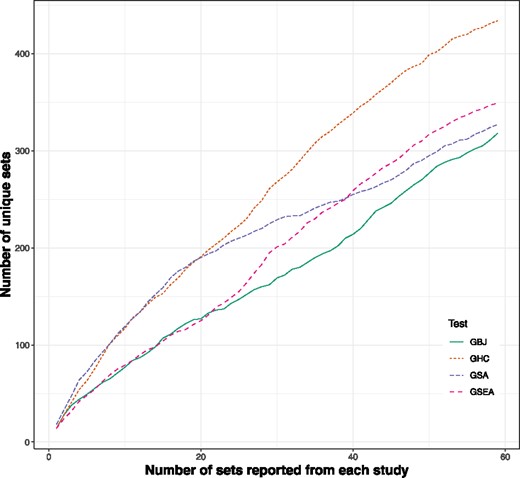
Number of unique gene sets identified across 18 studies (21 original minus three with missing values) under GBJ, GSEA, GSA and GHC. The x-axis specifies how many top-ranked gene sets are reported from each study. At x = 1, only the most significant gene set is reported for each study. The y-axis shows the number of unique gene sets reported across all studies. A smaller number of unique gene sets indicates that the method is replicating the same results in multiple datasets. Analysis with GBJ is more likely to report the same top pathways over multiple different studies
In addition to the set-based comparison, we also explore how conclusions may have changed if we utilized a single-gene approach for all 21 studies, as described in Section 2.4. Because of the difference in the multiple testing burden between hundreds of gene sets and tens of thousands of individual genes, for a fairer comparison we focus only on testing certain top genes that we believe are likely to be truly associated with ER-positive breast cancer disease progression. If a single-gene approach were reliable, the truly associated genes should demonstrate small P-values across most studies.
As detailed above, the most significant transcription factors after meta-analysis belonged to the E2F family. In addition, six out of seven transcription factors in the E2F family demonstrated P-values < in METABRIC, our largest dataset, and four out of seven demonstrated P-values <. Thus, there is evidence to hypothesize that the E2F transcription factors are genuinely related to the biological mechanisms governing disease progression. However, in Table 3, we see that the marginal association between E2F genes and breast cancer progression generally falls outside of the top 10 percentile of marginal associations for any given study. None of the genes in the E2F family possess a median rank (across all 21 studies) inside the top 1 percentile, and five of the genes have a median rank outside of the top 15 percentile. We see that using a single-gene approach, as opposed to a set-based statistic, would likely conceal the connection between the E2F family and breast cancer.
Single-gene analysis testing for association of E2F with breast cancer tumor grade
| Transcription factor | Median P-value | Median percentile rank |
|---|---|---|
| E2F2 | 0.1420 | 20.2 |
| E2F3 | 0.0404 | 15.3 |
| E2F4 | 0.2925 | 47.0 |
| E2F5 | 0.0706 | 19.5 |
| E2F6 | 0.1161 | 33.7 |
| E2F7 | 0.0019 | 6.8 |
| E2F8 | 0.0001 | 1.2 |
| Transcription factor | Median P-value | Median percentile rank |
|---|---|---|
| E2F2 | 0.1420 | 20.2 |
| E2F3 | 0.0404 | 15.3 |
| E2F4 | 0.2925 | 47.0 |
| E2F5 | 0.0706 | 19.5 |
| E2F6 | 0.1161 | 33.7 |
| E2F7 | 0.0019 | 6.8 |
| E2F8 | 0.0001 | 1.2 |
Note: Rather than testing the sets of genes regulated by an E2F transcription factor, we test the association of each E2F gene directly. We see that the E2F family does not show as much evidence of association with tumor grade using this method.
Table 3 further demonstrates the statistical challenges of identifying significance at the single-gene level. Three of the E2F genes demonstrate a median P-value <0.05 across all 21 studies, while four do not. The lowest median P-value is for E2F8, at P = 0.00012, which may not even be enough to pass a Bonferroni correction for multiple testing in many cases. Thus if all 21 studies had been analyzed in a single-gene approach, over half of them would probably have not provided enough evidence to implicate E2F.
4 Discussion
We have adapted the GBJ statistic to propose a set-based testing procedure that can detect the transcription factors which are responsible for segregating clinically distinct subgroups of patients. Specifically, we interrogated 593 transcription factor regulon sets to determine the transcription factors that are most likely to be involved with progression of breast cancer tumor grade. A major advantage of set-based testing is that pooling information across multiple genes reduces the chance of finding artificially significant genes that only show differential expression due to their association with downstream effects, an issue that has challenged previous studies. We do not expect to lose much power from not testing the transcription factor directly, as the GBJ statistic boasts certain optimality guarantees for power in set-based inference and, in essence, uses the collected set of target genes as a method of providing multiple independent assessments of transcription factor activity.
Our analytical framework is highly flexible and allows for a variety of models to explain the marginal associations between gene expression and outcome, as we have demonstrated in utilizing both logistic regression and cumulative logit regression. Thus investigators are free to employ a variety of different tools in modeling the individual-level data. This flexibility allows for GBJ to be extended for use in a variety of complex biological applications.
As a demonstration of GBJ-based gene set analysis, we have used data from 21 individual breast cancer gene expression datasets gathered in the MetaGxBreast compendium. Results from individual studies are relatively consistent, as the most significant gene sets from each individual study show a high degree of overlap. Even though some studies vary in their sample size by almost two orders of magnitude, GBJ is generally able to name the same gene sets as the most significant in disease progression. In contrast, similar set-based analyses using GHC, GSA or GSEA to perform inference do not show nearly as much overlap, especially among studies that are limited by a smaller sample size and would be expected to deliver more variable results. Thus, the expected number of times any given gene set significance result would be replicated using the GHC, GSA or GSEA procedures is lower than for GBJ.
A conventional single-gene approach is seen to be unreliable as well, as most of the E2F transcription factors do not even show a median ranking inside the top percentile over all studies. At best, utilizing the single-gene approach would suggest the E2F family as a possible target for follow-up among a large group of other transcription factors. Such a situation closely reflects the problems that hinder many transcriptional studies of breast cancer—because single-gene tests are much more susceptible to experimental and systematic noise, many microarray study results cannot be reproduced in a different sample. If these 21 separate datasets had actually been analyzed in 21 different manuscripts employing single-gene or alternative set-based approaches, the number of significant genes may have been larger but would also be more varied, necessitating further effort and analyses to determine genes worthy of follow-up. The improved consistency of gene set identification using GBJ-based gene set inference suggests that our set-based approach produces more reliable and reproducible results.
In our analysis, we found that gene sets regulated by the E2F family of transcription factors, a well-studied set of cell cycle regulators, are significantly associated with breast cancer grade. E2F transcription factors integrate signals from G1/S phase regulators and regulate many cell cycle functions such as DNA synthesis, DNA repair, and apoptosis - functions that are critical to oncogenic activity. The G1/S transition is a checkpoint at which cells can choose to repair themselves or proliferate, among other paths. If a cell chooses to divide at this point, it can no longer be stopped from reproducing. E2F1 expression has been associated with breast tumors, reduced disease-free survival, reduced overall survival and increased malignancy in breast tumors (Stender et al., 2007).
Estrogen regulation of E2F1 carries critical functions in the proliferative program of breast cancer cells (Stender et al., 2007). Other studies have found that E2F1 shows a growth-promoting effect through the pRB and p42 tumor suppressor pathways (Zacharatos et al., 2004); pRB and E2F are often studied together, and the interplay between pRB and E2F is known to be crucial to tumorigenesis (Nevins, 1992; Trimarchi and Lees, 2002). Active research is also ongoing into open questions regarding the specific roles of genes in the E2F family, which sometimes take opposite functions in activation and suppression of cell division (Trimarchi and Lees, 2002). Our findings suggest that more investigation into the various functions regulated by the E2F family may provide additional insight into breast cancer progression.
One shortcoming of our approach was a reliance on gene sets defined by known regulons of transcription factors. While there exists significant information on the binding motifs for many transcription factors, we also know the list we are working with is incomplete. As more knowledge is gathered on transcription factors and their binding motifs, we expect that this type of analysis will also become more accurate. Additionally, in performing meta-analysis over 21 studies to collect our final results, it would have been preferable to have more data in some of the studies with the small sample sizes. Since each study received equal weight in the final results even though their sample sizes varied widely, we may have overemphasized studies enrolling only a few hundred subjects or less. Lastly, it is important that we chose not to adjust for any covariates in our primary marginal models of association between expression and outcome. This decision was made so that we could include as many subjects as possible; to include any covariates would necessitate removal of those with missing values. However, in doing so, we may also have specified the model incorrectly, which is another factor that could affect the null distribution of our marginal test statistics. Although a sensitivity analysis presented in the Supplementary Materials seems to show that results are essentially unchanged when considering an age-adjusted model, it is still preferable to specify the correct model. Use of a more complete dataset would alleviate the likelihood of model misspecification in future analyses.
In conclusion, we have proposed a new framework for transcriptomic analysis of disease, one that tests sets of genes rather than single-gene expression levels. We stress that although our approach focuses on gene sets, the overall goal is still to make inferences about individual genes. The main advantage of set-based testing is an increased ability to filter out false positive associations that occur when expression levels of genes are correlated with the true drivers of disease progression. The GBJ statistic can perform this testing in a computationally efficient and powerful manner. When applying our methods to a large number independent breast cancer datasets, we find that GBJ produces results that are highly replicable across individual datasets, while other set-based approaches and a single-gene analysis do not show the same level of robustness.
Acknowledgements
The authors would like to thank two anonymous referees for helpful and constructive comments that have greatly improved the paper.
Funding
This work was supported by the National Institutes of Health [R35-CA197449, P01-CA134294, R01-HL113338].
Conflict of Interest: none declared.
References
Author notes
The authors wish it to be known that Sheila M. Gaynor and Ryan Sun contributed equally.

