


Abstract
Analysis of gene set (GS) enrichment is an essential part of functional omics studies. Here, we complement the established evaluation metrics of GS enrichment algorithms with a novel approach to assess the practical reproducibility of scientific results obtained from GS enrichment tests when applied to related data from different studies.
We evaluated eight established and one novel algorithm for reproducibility, sensitivity, prioritization, false positive rate and computational time. In addition to eight established algorithms, we also included Coincident Extreme Ranks in Numerical Observations (CERNO), a flexible and fast algorithm based on modified Fisher P-value integration. Using real-world datasets, we demonstrate that CERNO is robust to ranking metrics, as well as sample and GS size. CERNO had the highest reproducibility while remaining sensitive, specific and fast. In the overall ranking Pathway Analysis with Down-weighting of Overlapping Genes, CERNO and over-representation analysis performed best, while CERNO and GeneSetTest scored high in terms of reproducibility.
tmod package implementing the CERNO algorithm is available from CRAN (cran.r-project.org/web/packages/tmod/index.html) and an online implementation can be found at http://tmod.online/. The datasets analyzed in this study are widely available in the KEGGdzPathwaysGEO, KEGGandMetacoreDzPathwaysGEO R package and GEO repository.
Supplementary data are available at Bioinformatics online.
1 Introduction
One of the most common applications of transcriptomic analyses is the detection of differentially expressed genes (DEGs) that allows characterizing transcriptomic profiles of investigated conditions. However, the number of true discoveries depends on the power of conducted studies. In extreme cases, e.g. when the experiment is underpowered, no DEGs can be observed despite the existence of a true effect. However, a large number of DEGs can hinder a meaningful interpretation. Thus, instead of analyzing single genes, it is often better to investigate co-expression and synergistic reactions on the level of gene sets (GSs) (Mootha et al., 2003). Several collections of GSs and molecular interactions are established, including the knowledge-based Gene Ontology (GO; Consortium, 2012), Kyoto Encyclopedia of Genes and Genomes (KEGG; Kanehisa et al., 2016), Molecular Signatures Database (Subramanian et al., 2005) or REACTOME (Croft et al., 2014) as well as collection of GS related to particular stimulations, e.g. immune system stimulation by vaccination or a disease (Chaussabel et al., 2008; Godec et al., 2016; Li et al., 2014).
To transform information from expression of individual genes to the level of a collection of GS, enrichment methods were introduced. The first generation of enrichment methods is known as Over-representation Analysis (ORA; Tavazoie et al., 1999). The main concept of ORA methods is to divide the genes into DEGs and background, as well as into genes which are members of a particular GS (or not) and test the contingency table between these two divisions using an appropriate statistical test (such as hypergeometric, χ2 or Fisher’s exact test). The GSs are tested consecutively, and the resulting P-values are corrected for multiple testing. The first generation methods have two serious drawbacks. First, only binary information about statistically different expression between conditions is used. Genes are divided into DEGs and background by setting arbitrary log-fold change or P-value thresholds. However, the number of genes over the threshold will strongly depend on sample size. Second, the assumption of independence in the statistical tests applied is not fulfilled in most of the cases (Efron and Tibshirani, 2007; Goeman et al., 2004; Tamayo et al., 2016).
The second generation of enrichment methods is the Functional Class Sorting (FCS; Mootha et al., 2003) techniques. FCS techniques use information about all analyzed genes in the form of a gene list sorted according to certain metrics. Moreover, some methods incorporate the information about the effect size of the difference in gene expression between the groups (e.g. in form of a ranking value or test statistic such as the t statistic from a t-test) into the information transformation process from gene to pathway level. As in ORA, each GS is analyzed independently. Several FCS methods have been proposed, including Gene Set Enrichment Analysis (GSEA) (Subramanian et al., 2005), Pathway Level Analysis of Gene Expression (PLAGE) (Tomfohr et al., 2005), Pathway Analysis with Down-weighting of Overlapping Genes (PADOG) (Tarca et al., 2012), LEGO (Dong et al., 2016), singscore (Foroutan et al., 2018) and hybrid approaches like EGSEA (Alhamdoosh et al., 2017). A brief description of second generation GS enrichment algorithms used in this study is found in ‘Materials and methods’.
Finally, Pathway Topology (PT)-based approaches (Rahnenführer et al., 2004) comprise the third generation of enrichment methods. PT-based approaches are similar to FCS, but they incorporate the PT to compute gene-level statistics. This group includes methods such as NetGSEA (Shojaie and Michailidis, 2010), CePa (Gu et al., 2012) or hybrid approaches SPIA (Tarca et al., 2009), EnrichmentBrowser (Geistlinger et al., 2016). While third generation methods capture the complexity of molecular biology in a convenient way, they still suffer from major drawbacks. First, PT depends on cell type, cell cycle phase or specific environmental conditions, an information that is rarely available (Khatri et al., 2012). Second, they are not applicable to many nonstandard applications, making the third generation methods highly specialized tools available only for transcriptomic analyses in the most common model organisms and humans. Third, they require computational capacities similar to FCS permutation methods or higher, which in terms of large studies could require a computational cluster. Moreover, the knowledge about molecular biology networks evolves rapidly outdating the analyses performed using PT. Finally, a substantial variation of results obtained using PT algorithms has been demonstrated (Ihnatova et al., 2018). Other classifications of enrichment methods exist (Goeman and Bühlmann, 2007; Huang et al., 2009; Maciejewski, 2014).
Given the limitations of third generation algorithms, both first and second generation methods are still widely used and no gold-standard approach has been established yet. A recent comparison (Tarca et al., 2013) showed that PLAGE (Tomfohr et al., 2005), GLOBALTEST (Goeman et al., 2004) and PADOG (Tarca et al., 2012) are all characterized by good overall sensitivity and relative position of true positives in results. Nevertheless, in that study the specificity of the algorithms was calculated only for methods classified as second generation and by using a permutation applied to genes rather than samples. However, it has been shown before that permutation of genes is problematic and results in an apparent low performance of the algorithms due to breaking original gene correlations (Maciejewski, 2014). Moreover, substantial variation in specificity is known to exist (Dong et al., 2016). Other studies were limited to empirical evaluation of only a few algorithms (Abatangelo, 2009; Powers et al., 2018).
In the course of our own work in various applications of systems biology, we have used several of these methods, and found (without using a systematic approach) that one of the major issues is to obtain high sensitivity and reproducibility of the findings produced by different methods in a dataset or by the same method in different datasets. Searching for a robust approach we and others (Domaszewska et al., 2017; El-Chemaly et al., 2018; Kunnath-Velayudhan et al., 2010; Loxton et al., 2016; Ritchie et al., 2018; Santoro et al., 2018; Toro‐Domínguez et al., 2018; Van Den Berg et al., 2018; Weiner et al., 2018) have successfully applied a statistical approach called Coincident Extreme Ranks in Numerical Observations (CERNO; Yamaguchi et al., 2008), which is based on a modified Fisher’s combined probability test. CERNO has several advantages; notably, as it uses as input an ordered gene list, any metric can be used to sort the features, resulting in impressive flexibility. CERNO, thus can be combined with diverse approaches including data integration and multidimensional scaling techniques. It produces a well-described statistic (χ2) and therefore does not require a randomization approach like GSEA (Subramanian et al., 2005), making its implementation fast and powerful even for small sample sizes. A limited comparison with GSEA showed its superiority for small sample sizes and a remarkable robustness (Weiner and Domaszewska, 2016). Despite the apparent flexibility and robustness, it has never been systematically compared to other approaches. Moreover, the assumption of independence of P-values which is underlying Fisher’s method is not fulfilled. Thus, one of the goals of our work was to test the false discovery rate for the CERNO algorithm.
Our main concern in comparing GS enrichment algorithms was the reproducibility of results obtained in different studies. The issue of scientific reproducibility has been the subject of an important debate of the last decade (Baker, 2016; Munafò et al., 2017). In particular, we wanted to know the extent to which the results of GS enrichment analyses are reproducible when compared across different scientific studies. Here we present a novel measure of enrichment analysis performance aimed at gauging reproducibility. The new metric is based on comparing enrichment results obtained with a given algorithm across multiple studies of clear cell renal cell carcinoma (ccRCC). The aim of this work was to compare second generation enrichment tests, in particular CERNO, using both well-known evaluation metrics as well as our novel measure of reproducibility. Several previous studies using compared enrichment methods using different approaches and metrics e.g. sensitivity, specificity and prioritization (Tarca et al., 2013; Zyla et al., 2017b), discrimination (Yu et al., 2017), accuracy (Bayerlová et al., 2015), false discovery rate (Jaakkola et al., 2018), power analysis via semisynthetic simulation tool (Mathur et al., 2018) or comparative analysis via simulation study (Abatangelo, 2009). Here we focus on sensitivity, specificity and prioritization (Tarca et al., 2013; Zyla et al., 2017b) accompanied by a novel measure with the intention of assessing the reproducibility of an algorithm. In addition, we tested the impact of chosen ranking metric and sample size on the results of the CERNO algorithm. All analyses were performed on publicly available benchmark datasets to ensure replicability of our study and to provide a new standard of evaluation of GS enrichment methods.
2 Materials and methods
2.1 CERNO algorithm
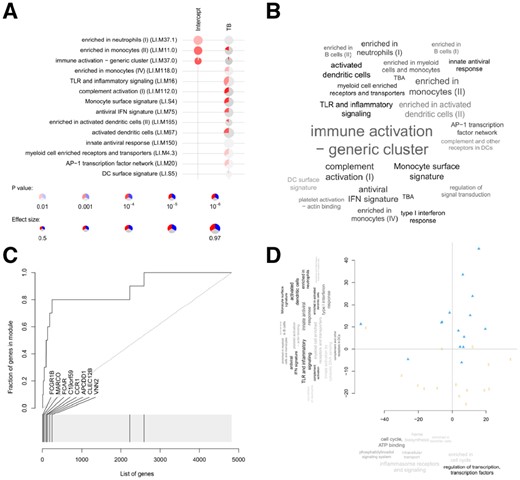
Examples of tmod package graphical illustrations of enrichment results. (A) A panel plot which allows presentation of large number of comparisons; (B) a tag cloud for enriched GS; (C) evidence plot for a selected GS, where the AUC corresponds to effect size; (D) principle component analysis combined with enrichment allows to functionally annotate the components
Compared to other second generation enrichment methods the CERNO method implemented in tmod offers several advantages: (i) short evaluation time as a randomization-based test (performed e.g. in GSEA) is not required; (ii) simple input dataset in the form of a sorted list of genes; (iii) ranking method depends on the user, which enables sorting of genes according to any suitable metric; (iv) the R implementation is not limited for analysis of default GSs (any GS can be tested); (v) CERNO weighs the low-ranking genes more than intermediate one thereby decreasing the influence of the GS size on the enrichment result. Despite above mentioned advantages, CERNO algorithm does not account for correlation of expression between genes, which can potentially result in an increased number of false positive results. This issue of correlation between genes has not been resolved for a few of all the second generation algorithms. tmod package is available from CRAN (cran.r-project.org/web/packages/tmod/index.html) while an online implementation can be found at http://tmod.online/.
2.2 Further algorithms used in the evaluation
CERNO was compared to eight other popular algorithms. ORA, implemented in GOstat package (Falcon and Gentleman, 2007), constructs contingency tables for each GS containing the number of DEGs and non-DEGs. DEGs and non-DEGS were established according to P-values from t-test for unequal variances (α = 0.05). Next, hypergeometric test is performed to get significance of each GS. In the group of tested algorithms, it is the only representing first generation of enrichment methods.
Furthermore, we used the top three algorithm presented in Tarca et al. (2013), i.e. GLOBALTEST (Goeman et al., 2004), PADOG (Tarca et al., 2012), PLAGE (Tomfohr et al., 2005), with addition of GSVA (Gene Set Variation Analysis; Hänzelmann et al., 2013), GSEA (Subramanian et al., 2005) and two algorithms implemented in the limma R package: GeneSetTest and Wilcoxon GST (Wilcoxon GeneSetTest; Smyth, 2005).
In the following, we briefly describe the second generation algorithms included in our comparison. GLOBALTEST uses a logistic regression model to assess significance of a given GS (Goeman et al., 2004). More precisely, it tests whether the regression coefficients for all genes in individual GS equal zero. PADOG calculates pathway scores as the weighted sum of absolute moderated gene t-scores, with gene weights being lower for genes that are common across the collection of GSs being analyzed. This allows to account for genes which appear in many GSs. Next, the gene-level information is transformed to pathway-level significance. PLAGE first standardizes expressions by calculating z-scores and then performs a singular value decomposition. The first right singular vector of coefficients (analogous to the first component in PCA) is used as GS score (Tomfohr et al., 2005) and significance is obtained from a t-test comparing the scores between groups. GSVA (Hänzelmann et al., 2013) estimates the gene expression distribution over the samples by nonparametric kernel distribution, which puts expression profiles on a common scale. Then, the Kolmogorov–Smirnov-like statistic is calculated to obtain a summary GS score. GSEA (Subramanian et al., 2005) is one of the most commonly used algorithms in enrichment analysis. Using a permutation-based approach on a weighted Kolmogorov–Smirnov statistic, GSEA tests whether the distribution of the gene ranks in the GS differs significantly from a uniform distribution. Finally, we used GeneSetTest and Wilcoxon GST, the latter being a modification of GeneSetTest known as mean-rank GS enrichment. Both algorithms test genes selected as DEGs in one dataset and determine whether a given GS tends to be highly ranked in the training dataset. The computed test statistic is the mean rank of the GS in the test dataset.
Starting parameters for each algorithm are presented in Supplementary File S1. In general, we used the parameters recommended by the authors of each package. For paired design datasets the absolute value of t-statistic for paired samples was used for all algorithms.
2.3 Datasets
All algorithms were tested using two publicly available microarray dataset collections. Both collections are available as R packages, KEGGdzPathwaysGEO (Tarca et al., 2012) and KEGGandMetacoreDzPathwaysGEO (Tarca et al., 2013). From second collection, we removed datasets which are associated with a target pathway from the Metacore database to keep the analysis dependent only on open access sources. In addition, we used ccRCC (Jaakkola and Elo, 2016) datasets from Gene Expression Omnibus (IDs: GSE6344, GSE15641, GSE14994, GSE11024; Edgar et al., 2002). In total, the collection of comprised 38 benchmark microarray datasets with 32 samples in average; the smallest dataset consisted of 8 samples, and the largest 153 samples. Duplicates of probeset assignments to genes were removed according to the following procedures: (i) in KEGGdzPathwaysGEO datasets the probe set with the smallest P-value was kept; (ii) in KEGGandMetacoreDzPathwaysGEO and ccRCC datasets the probe set with the highest average expression across all samples was kept (Tarca et al., 2013). For each dataset and the corresponding disease, the target pathway (true positive) from KEGGs (Kanehisa et al., 2016) was matched for measuring efficiency of tested algorithms (Tarca et al., 2013). The used dataset collection is characterized by not strongly skewed distributions of gene expression (see Additional file 2 in Zyla et al., 2017b). KEGG pathways were downloaded as a collection of GS via KEGGREST package resulting in 299 different pathways. Detailed description of the 38 datasets and their target pathways is presented in Supplementary File S2.
2.4 Algorithm evaluation measures
The testing procedure included five measures: sensitivity, false positive rate (FPR), computational time, prioritization and reproducibility. We used the first four surrogate measures previously introduced by Tarca et al. (2013) and further defined in Zyla et al. (2017b). Sensitivity was determined by analyzing the distribution of GS P-values of target pathway and by introducing the conservative estimator from Storey’s method for multiple testing, where shows the proportion of truly alternative tests (Storey, 2002). FPR measure was obtained by permutation procedure as follows. The original phenotypes were permuted 50 times in each dataset. Next, each enrichment algorithm was applied and mean value of GSs with P-value <5% was calculated. Finally, we computed the absolute deviation of mean FPR (observed level) from 5% (expected level). Computational time was collected during sensitivity analyses on the same PC for each algorithm. Surrogate prioritization is position of dataset target pathway in result list standardized to total number of analyzed pathways. The median value from analyzed datasets in each algorithm represents prioritization.
We introduce a fifth evaluation measure aimed at gauging the reproducibility of the tested algorithms (Fig. 2). The rationale here was to assign a high score to algorithms that showed consistent results in different datasets corresponding to the same physiological condition. For this, we used six ccRCC datasets (GSE14762, GSE781, GSE6344, GSE15641, GSE14994, GSE11024). Since the same disease was investigated in each dataset, we aimed at identifying the algorithm which highlights similar pathways in every dataset to give the most reproducible results. We have chosen these datasets with the following assumptions in mind. First, we wanted to compare biological reproducibility of the methods when a similar experiment is performed in different clinical settings and by different scientists, i.e. whether a tool is able to extract biological information common to all heterologous datasets. Second, we did not want to focus on a comparison of how the technical platform influences the results of GS enrichment. Thus, we decided to select a collection of datasets which were described by various authors in diverse clinical studies, but which were all performed on a similar (although not identical) technical platforms (Affymetrix technology).
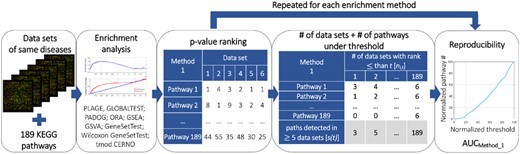
Scheme of reproducibility analysis performed for all tested algorithms
Next to ccRCC datasets, we used 189 KEGG pathways tested by all algorithms after algorithm-specific filtering (Supplementary File S1). Previous attempts to estimate consistency of results (Jaakkola and Elo, 2016) were hampered by confounding the replicability with sensitivity. That is, an algorithm which reports no significantly enriched pathways in any of the analyzed datasets at P < 5% (due to low sensitivity) may appear consistent (even though it is useless). We sought to alleviate this problem by integrating the outcome over all possible thresholds. Other propositions of reproducibility investigation can be found in Tarca et al. (2009), Maleki et al. (2018) and Zyla et al. (2017a).
The rationale behind calculating s(t) is as follows. A robust algorithm detects the target pathway in all datasets (allowing for a single mistake, hence condition ni,t ≥ 5) for small values of t. By relaxing (increasing) the threshold, any algorithm will eventually detect the pathway in all datasets, but we are interested in algorithms which have a high value of s(t) at low values of t (Fig. 2, fourth panel, gray part of table). Hence, we consider the dependency between the average number of pathways detected above a certain rank threshold, and the rank threshold used to define the detected pathways—that is, between the s(t) and t (Fig. 2, rightmost panel). Note that s(t) is monotonic; we define the measure of reproducibility as the area under curve (AUC) of the s(t) function. The higher the value of AUC, the more reproducible algorithm is.
The above described procedure was performed on all tested algorithms. In addition, for CERNO algorithm the impact to sensitivity and FPR of applied gene ranking metric was tested by using four different ranking metrics that were most suitable for the GSEA algorithm (Zyla et al., 2017b) i.e. Baumgartner–Weiss–Schindler test statistic (BWS; Baumgartner et al., 1998); absolute value from Moderated Welch Test statistics (|MWT|; Demissie et al., 2008); absolute value from signal-to-noise ratio (|S2N|; Subramanian et al., 2005); MSD (Zyla et al., 2017b). Notably, the BWS metric makes no assumptions about data distribution. The |S2N| and |MWT| are recommended for normally distributed signals, while MSD can be implemented in a parametric and nonparametric way (in presented study the parametric implementation was used). In addition, the impact of sample size according to different gene ranking metric was performed as in Zyla et al. (2017b).
Finally, due to limitation of GLOBALTEST algorithm in terms of paired design and poor performance of GSEA when t-test statistic is used as a ranking metric (Zyla et al., 2017b), here we used only these 28 benchmark datasets which were suitable for an unpaired study design. Evaluation of GS algorithms on all datasets (including these with paired design) can be found in Supplementary Materials.
3 Results
3.1 Evaluation of different ranking metrics for the CERNO algorithm
First, we evaluated how ranking metric influences the behavior of the CERNO algorithm. Surrogate sensitivity remained similar across all tested ranking metrics (Fig. 3A).
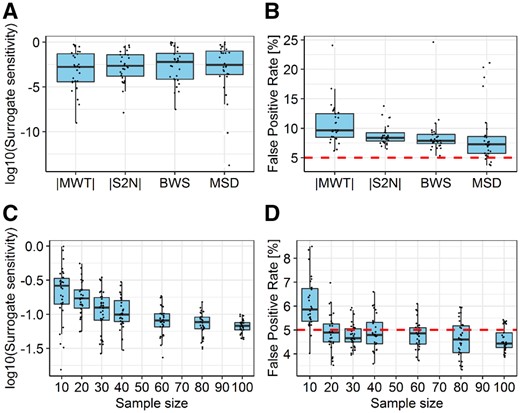
Comparison of the impact of different gene ranking metric (top row) and sample sizes (bottom row) on the surrogate sensitivity (lower is better) and FPR (closer to 5% is better) for the CERNO algorithm. Panels (A) and (B) represent impact of different ranking metrics in terms of surrogate sensitivity and FPR at various sample size, respectively. Panels C and D represent impact of sample size to surrogate sensitivity and FPR for MSD metric only. Red line on panels (B) and (D) represents the expected FPR level
The same measure has been applied previously for the GSEA algorithm (Zyla et al., 2017b) and showed a higher variation. Moreover, the number of detected target pathways at P-value <5% remained stable for the metrics BWS, |MWT| and |S2N| (21–22 out of 28; Supplementary Fig. S1A). Slightly lower outcomes in terms of target pathway detection were observed for MSD. Estimated mean FPR was also stable and varied between 8.5% and 10%. The FPR closest to the expected threshold of 5% was observed for MSD metric while the worst outcomes were found for |MWT| (Fig. 3B), consistent with previous observations (Zyla et al., 2017b). Given that the MSD metrics showed the best FPR estimation with acceptable surrogate sensitivity, the impact of sample size for two evaluation statistics was investigated only for this metric (Fig. 3C and D). Surrogate sensitivity increased with sample size (Fig. 3C) while FPR remained stable for sample sizes >10. This confirms previous observations, where high level of correlation between the small and large sample sizes was observed for CERNO (Weiner and Domaszewska, 2016).
3.2 Comparison of CERNO to other methods
We compared the CERNO method to other well-known GSEA methods. For all tested algorithms, we obtained sensitivity from surrogate sensitivity. Mean FPR was subtracted from expected 5% (|FPRobs–5%|), computational time was calculated as average evaluation time across all 28 datasets in each algorithm, prioritization was defined as median value from rankings of target pathway in results list and reproducibility was evaluated as detection of common pathways across five and six datasets. This experimental procedure provides one value per each measure and each tested algorithm (Table 1, detailed results for each dataset are induced in Supplementary File S3 and Fig. S2). The higher value of sensitivity and reproducibility and lower values of FPR, prioritization and computational time indicate better performance.
Sensitivity, FPR, prioritization, computational time and reproducibility of tested algorithms
| Algorithm | Sensitivity | FPR | Time [s] | Prioritization | Reproducibility |
|---|---|---|---|---|---|
| CERNO | 0.949 | 3.602 | 5.987 | 18.73 | 41.39 |
| GeneSetTest | 0.979 | 4.215 | 132.557 | 14.88 | 40.84 |
| GLOBAL TEST | 0.994 | 0.486 | 2.844 | 28.38 | 35.34 |
| GSEA | 0.900 | 2.696 | 289.216 | 19.35 | 38.60 |
| GSVA | 0.496 | 3.124 | 6.335 | 40.11 | 37.65 |
| ORA | 0.896 | 0.067 | 11.058 | 27.07 | 36.96 |
| PADOG | 0.996 | 0.082 | 71.682 | 13.86 | 39.25 |
| PLAGE | 1.000 | 3.309 | 4.508 | 23.49 | 33.84 |
| Wilcoxon GST | 0.995 | 4.601 | 132.557 | 17.06 | 36.83 |
Note: Higher values of sensitivity and reproducibility are better; lower values of FPR, prioritization and time are better. For each column, the best value is shown in bold.
The highest sensitivity was obtained for PLAGE, and most of the other algorithms showed similar results. The lowest sensitivity was observed for GSVA. This confirms previous findings (Tarca et al., 2013), where PLAGE was found superior to GSVA. However, PLAGE was shown to overestimate results by lowering GS P-values and can mark >70% of pathways as significant even after strict Bonferroni correction (Zyla et al., 2017a). Indeed, we found this to be the case in our analysis, as well (Fig. 4).
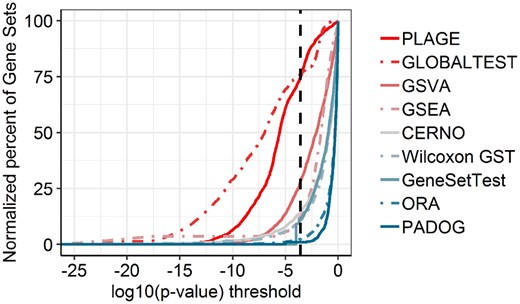
Percent of significant pathways by average for each algorithm under various P-value thresholds across six datasets of ccRCC. The black, dashed, vertical line represents Bonferroni correction for multiple testing
In addition, after Bonferroni correction ORA and PADOG showed very few overall results (on average, respectively 2.44% and 0.91% of all 189 pathways). A number of significant target pathways (at P-value <5%) for each tested algorithm are presented in Supplementary Figure S1B. GSVA show the lowest number of statistically significant target pathways, confirming its low sensitivity, without a tendency to underestimate results (Fig. 4). ORA and PADOG both detect <40% of target pathways as significant. PLAGE and GLOBALTEST, despite overestimation of results (Fig. 4), do not detect all target pathways. We next investigated whether observed loss of detection in target pathways are caused by a specific dataset (Supplementary Fig. S1C). Even though PLAGE did not detect six of the target pathways, only two of these pathways were detected by another algorithm (target pathway for datasets GSE20153 and GSE3585). Similarly, for GLOBALTEST, five target pathways were not detected, and only one of them was identified by another algorithm (dataset GSE20153). Remaining target pathways were successfully observed in other algorithms. These results are consistent with previous comparisons (Zyla et al., 2017a). In sum, both PLAGE and GLOBALTEST identified several pathways as positives, while the majority of them of cases could be noise rather than specific for the disease. Assuming that differential gene expression between healthy donors and cancer patients occurs in ∼10% to 20% of genes (Anand et al., 2008), both, the low number of statistically significant pathways in PADOG and ORA and high level of detected pathways in PLAGE and GLOBALTEST are questionable for ccRCC dataset (Fig. 4). Moreover, it was shown that the PLAGE algorithm has low power and F1 score compared to other single sample methods (Foroutan et al., 2018).
Finally, we investigated impact of GS size and of sample size on the obtained P-values of target pathways (surrogate sensitivity). GLOBALTEST, PLAGE were not robust to GS size (Supplementary Fig. S3, test for Spearman rank correlation equality to zero P-value <5%). All above mentioned algorithms tended to show lower P-values for smaller GS. Stability to sample size (Supplementary Fig. S4) confirmed the observation that CERNO algorithm is robust to sample size in terms of surrogate sensitivity (Fig. 3) while GLOBALTEST and PLAGE showed lower P-values for large datasets (test for Spearman correlation equality to zero with P-value <5%).
The lowest overall FPRs (highest specificity) were observed for ORA and PADOG, which may explain their somewhat lower sensitivity (Fig. 4). This is in line with a previously published comparison (Dong et al., 2016). The least accurate results in terms of FPR testing were observed for the two algorithms from limma package (GeneSetTest and Wilcoxon GST). For all algorithms, the robustness for GS size and sample size in terms of FPR was observed (Supplementary Figs S5 and S6).
The best outcome for prioritization metric was achieved by the PADOG algorithm. PADOG, despite failing to detect 61% of target pathways at α = 5% (Supplementary Fig. S1B) placed the target pathways at the top of its result list. This contrasts with ORA, which not only failed to detect most of the target pathways at α = 5%, but in addition, prioritized the target pathways incorrectly. The poorest performance was observed for GSVA with a likewise low number of detected target pathways (29%, Supplementary Fig. S1B). CERNO provides an above average result, correctly prioritizing the target pathways even though, as in the case of PADOG, only 57% of them were statistically significant under the set α = 5% (Supplementary Fig. S1B).
CERNO had the highest reproducibility, closely followed by GeneSetTest. Both algorithms reached the reproducibility level (AUC) above 40%, returning similar results for the same physiological condition. Furthermore, high level of reproducibility was obtained by PADOG, GSVA and commonly used GSEA method. The poorest outcomes were for PLAGE and GLOBALTEST. This suggests that due to overestimation, PLAGE and GLOBALTEST assign significant P-values for a large set of pathways, but these results are inconsistent between different datasets describing the same condition.
For visualization purposes, we standardized the values presented in Table 1, with 1 being the preferred result (high sensitivity and reproducibility, low FPR, prioritization and CPU time) and 0 the least desirable outcome (Fig. 5). Based on the obtained normalized scores we calculated the sum from all evaluation measures for each algorithm.
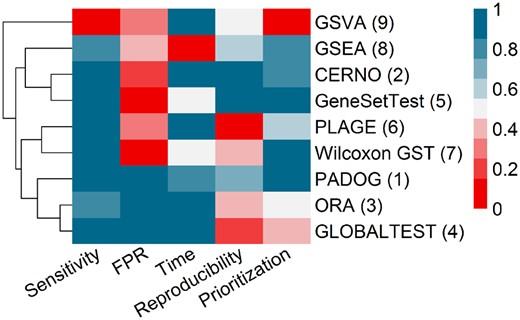
Cluster heatmap of normalized evaluation statistics on 28 datasets with unpaired design. Blue color represents good, gray medium and red poor evaluation. Numbers next to the algorithms name represent the overall rank from the best (1) to the worst (9) performance. Dendrogram corresponds to hierarchical clustering based on Euclidian distance
In summary, all tested algorithms except GSVA were sensitive. However, only three algorithms showed a low deviation from expected FPR (PADOG, ORA and GLOBALTEST). The longest calculation times were obtained for the GSEA algorithm due to the permutation test used to assess GS P-values. The other algorithms revealed similar computational times. The poorest prioritization was observed for GSVA, GLOBALTEST and medium for ORA, while the remaining algorithms showed acceptable results. Finally, the best reproducibility was observed for CERNO and GeneSetTest, and good for PADOG, GSEA and GSVA. Including all evaluation measures, the best results could be attributed to PADOG (all metrics on acceptable level), CERNO (with a higher than expected FPR) and ORA (with low reproducibility and medium prioritization). Results for all 38 datasets with paired and unpaired design are presented in Supplementary Figure S7. The addition of paired designed datasets does not change top three best algorithms i.e. PADOG, ORA and CERNO.
Finally, we assessed similarity between algorithm results. To this, we calculated correlation coefficients between pathway P-values for each pair of algorithms, separately for the target pathway analysis and for the ccRCC dataset with 189 pathways (Supplementary Fig. S8), GSVA did not correlate with any of the tested algorithms. The results of PLAGE correlated with the results of GLOBALTEST and results of GeneSetTest correlated with those of Wilcoxon GST. CERNO algorithm applied to the ccRCC collection (Supplementary Fig. S8A) correlated with PADOG and GeneSetTest, but the correlation to PADOG was weaker in case of target pathways (Supplementary Fig. S8B). In conclusion, the results of PLAGE, GLOBALTEST and GSVA are least similar to results obtained from the other algorithms.
4 Discussion
We have compared the performance of CERNO algorithm implemented in the R package tmod with the of several other second generation enrichment algorithms and ORA. We evaluated the algorithms for sensitivity, specificity, prioritization and computational time and introduced a novel measure of result reproducibility. Our testing approach can be easily implemented in future applications.
We found that CERNO provides stable results in terms of sensitivity and FPR under various gene ranking metrics (Fig. 3A and B). In addition, it is robust to different sample sizes, except for the smallest sample size tested (10 samples, Fig. 3C and D). This can be explained by poor estimation of SEM in MSD when the number of samples is small. Given that most of the datasets used for evaluation have small sample size (median sample size was 21), this is consistent with a relatively high FPR. Nevertheless, regardless of the gene ranking metric used, the CERNO algorithm produced sensitive results with constant FPR on the level of 8.5–10.5%. A notable feature of the CERNO algorithm is its high reproducibility: findings are consistent across different datasets corresponding to the same physiological state. In addition, it shows above average sensitivity, prioritization and low computational time. Finally, CERNO method use Fisher’s method for probabilities integration which assumes the independence of P-values tested. This assumption is likely not to be fully met, as gene expression is not independent for many genes, which may result in overstated P-values. Our analysis indicates that the FDR for CERNO, while not as good as in case of ORA or PADOG, is better than the one for GeneSetTest or Wilcoxon GST. This confirms that the unmet assumption of independence is, indeed, a problem for CERNO, but it also shows that the impact of this is limited. Implementation of the proposed algorithm along with some visualization tools is publicly available from CRAN (cran.r-project.org/web/packages/tmod/index.html). Several studies successfully used visualization tools included in the tmod package in their studies (El-Chemaly et al., 2018; Loxton et al., 2016; Santoro et al., 2018; Van Den Berg et al., 2018; Weiner et al., 2018).
Furthermore, we compared CERNO to several widely used GS enrichment algorithms. PADOG proved the best results under the all tested condition, followed by CERNO and ORA. However, both PADOG and ORA showed a tendency to underestimate results (Fig. 4). In contrast, PLAGE and GLOBALTEST showed an opposite trend.
Both PLAGE and GLOBALTEST marked most of the pathways as significantly enriched (74.86% and 76.13% respectively) even after a Bonferroni correction for multiple testing, which in consequence hampers correct conclusions. While both algorithms were previously shown to perform well (Goeman and Bühlmann, 2007), we show that they have serious drawbacks not realized before, which may be the reason for the observed low reproducibility between different studies. For PLAGE, PADOG and GLOBALTEST significance level must be chosen carefully to obtain reliable results. This merits further investigation. Moreover, GLOBALTEST and PLAGE are not robust to GS size in terms of results sensitivity.
Simple first generation GS enrichment approaches based on hypergeometric tests or similar statistical tests of class association (ORA) are still in widespread use. However, ORA requires a cutoff level for division of genes to DEGs and non-DEGs, and consequently in some analyses it is impossible to perform ORA due to lack of DEGs under the selected cutoff. In addition, ORA does not include strength of differentiation or gene position in the ranking list as it is in a functional-class sorting method. In terms of reproducibility, ORA showed an average performance. Though ORA scored relatively high in our comparison due to low FPR, average sensitivity and low computational time, it cannot be recommended for most applications.
A guide across all results and flexibility of the algorithms can be found in Table 2. In contrast to PADOG and most of other methods, CERNO, GeneSetTest and Wilcoxon GST (all implemented in tmod) allows a choice of gene ranking metric, thus greatly expanding the range of applications. Arbitrary gene metrics include principal component scores, allowing to combine GS enrichment with PCA (implemented in tmod) and correlation coefficients, e.g. for the analysis of top clinical correlates of gene expression or for combining gene expression data with other high throughput data types (Esterhuyse et al., 2015). CERNO and GeneSetTest show an overall similar performance, with CERNO achieving a better replicability between studies and lower deviation from the expected FPR. Thus, if reproducibility between studies is the main desired criterion, one of these two algorithms is recommended.
Summary of algorithm evaluation and their flexibility
| Algorithm | CERNO | GeneSetTest | GLOBALTEST | GSEA | GSVA | ORA | PADOG | PLAGE | Wilcoxon GST |
|---|---|---|---|---|---|---|---|---|---|
| Sensitivity | + | + | + | + | −− | + | ++ | + | + |
| FPR | − | −− | ++ | +− | − | + | + | − | −− |
| Time | + | − | ++ | −− | + | + | +− | + | − |
| Prioritization | + | + | − | + | −− | +− | ++ | + | + |
| Reproducibility | ++ | + | − | + | + | − | + | −− | − |
| Sensitive to GS size | No | No | Yes | No | No | No | No | Yes | No |
| Sensitive to sample size | No | No | Yes! | No | No | No | No | Yes | No |
| Data inputa | Ordered gene list | Ordered gene list | Expression matrix + class labels | Expression matrix + class labels | Expression matrix | List of DEGs and background | Expression matrix + class labels | Expression matrix | Ordered gene list |
| GS inputa | Built-in modules or user input | User input | Built-in GSs only | User input | User input | User input | User input | User input | User input |
| Alternative ranking metricsa | Yes | Yes | No | Yes | N.A. | Yes | No | N.A. | Yes |
Note: Columns correspond to the algorithms and rows to selection criteria.
Based on available implementation.
In conclusion, we evaluated the CERNO enrichment algorithm implemented in tmod package in the context of other popular enrichment tools. We showed that CERNO algorithm is robust to different gene ranking lists and sample size. CERNO had the highest reproducibility, good sensitivity, prioritization and low computational time. However, the FPR was average. We introduced a new metric, reproducibility, aimed at measuring the consistency of an algorithm across different studies. Our results provide a useful roadmap for choosing the optimal tool for enrichment analysis.
Author contributions
J.W. and T.D. implemented CERNO algorithms and created tmod package. J.Z. and M.M. proposed reproducibility metrics and performed evaluation of enrichment algorithms. J.Z. and J.W. wrote the manuscript. All authors conceived the study and participated in interpretation of the results and manuscript preparation. J.Z., M.M., J.P. were incorporated into all calculations and algorithm development that could be described as the performance of tasks in the technical informatics—discipline defined by the Polish Ministry of Science and Higher Education.
Funding
This work was founded by the Bill & Melinda Gates Foundation Grand Challenges in Global Health Program [BMGF GC6-74, #37772 and GC6-2013, OPP1055806]; BioVacSafe 115308, TBVAC 2020 643381 to J.Z., S.K., J.W. and Polish National Science Center [2015/19/B/ST6/01736 to M.M., J.P.]. The calculations were carried out using infrastructure of GeCONiI [POIG.02.03.01-24-099/13].
Conflict of Interest: none declared.
References

