


Abstract
High-throughput reporter assays dramatically improve our ability to assign function to noncoding genetic variants, by measuring allelic effects on gene expression in the controlled setting of a reporter gene. Unlike genetic association tests, such assays are not confounded by linkage disequilibrium when loci are independently assayed. These methods can thus improve the identification of causal disease mutations. While work continues on improving experimental aspects of these assays, less effort has gone into developing methods for assessing the statistical significance of assay results, particularly in the case of rare variants captured from patient DNA.
We describe a Bayesian hierarchical model, called Bayesian Inference of Regulatory Differences, which integrates prior information and explicitly accounts for variability between experimental replicates. The model produces substantially more accurate predictions than existing methods when allele frequencies are low, which is of clear advantage in the search for disease-causing variants in DNA captured from patient cohorts. Using the model, we demonstrate a clear tradeoff between variant sequencing coverage and numbers of biological replicates, and we show that the use of additional biological replicates decreases variance in estimates of effect size, due to the properties of the Poisson-binomial distribution. We also provide a power and sample size calculator, which facilitates decision making in experimental design parameters.
The software is freely available from www.geneprediction.org/bird. The experimental design web tool can be accessed at http://67.159.92.22:8080
Supplementary data are available at Bioinformatics online.
1 Introduction
Interpreting the likely functional effects of DNA sequence changes is an important component of prioritization efforts for genetic variants in studies of disease and other phenotypes (reviewed in Starita et al., 2017). Currently, interpretation of variants in coding segments of the genome can be performed more confidently than for noncoding variants, as many disease variants in coding regions have obvious effects that can be accurately deduced based on annotated translation reading frames—e.g. creation of premature stop codons or non-conservative amino acid substitutions (Adzhubei et al., 2010; Kumar et al., 2009), or disruption or creation of splice sites (Majoros et al., 2017, 2018). Interpreting noncoding variants is much more challenging, as annotations for noncoding elements such as transcriptional enhancers are both less complete and of lower confidence, and because the functional architectures of enhancers are less well understood than that of protein-coding genes (Lowe and Reddy, 2015; Zhu et al., 2017).
High-throughput reporter assays have been shown to hold great promise for identifying genomic loci capable of functioning as transcriptional enhancers in individual cell lines (Arnold et al., 2013; Kwasnieski et al., 2012; Melnikov et al., 2012; Murtha et al., 2014; Patwardhan et al., 2012; Sharon et al., 2012; White et al., 2013). In these assays, a test element is cloned into an episomal reporter construct, typically comprised of a plasmid containing one or more genes. The plasmids are transfected into target cells, where their reporter genes may be transcribed into RNA. That RNA is then collected and sequenced both to identify the test element via its barcode, and to quantify the amount of RNA produced per barcode. The DNA of the plasmids can also be sequenced to quantify the relative abundances of different test elements in the plasmid pool. Comparing the levels of RNA and DNA for each test element then provides a way to estimate transcriptional rates achieved from the reporter gene under the regulatory influence of that test element. In this way, different test elements can be compared as to their ability to act as transcriptional enhancers. In practice, millions of elements can be tested simultaneously.
Recent work has shown that these assays can also be applied to quantify the regulatory effects of genetic variants within enhancers (Kalita et al., 2018a; Liu et al., 2017; Tewhey et al., 2016; Ulirsch et al., 2016; Vockley et al., 2015). DNA elements captured from a pool of different individuals (e.g. Vockley et al., 2015) or synthesized de novo (e.g. Tewhey et al., 2016) can be cloned into the reporter as described above, and then DNA and RNA sequencing reads can be assigned to different alleles for any genetic variant present in the test element(s). Rather than comparing the transcriptional output of the reporter between different loci, the comparison of interest is between different alleles at the same locus. For a true regulatory variant in an enhancer that is active in the target cell type, a transcriptional effect will be present, such that one allele results in higher rates of transcription than the other allele(s). That transcriptional effect will in turn result in different allele frequencies for the variant when comparing RNA to DNA.
Prior computational methods for detecting regulatory variants in high-throughput reporter assays have focused on null-hypothesis significance testing. The null hypothesis is that θ = 1, as this denotes both that transcriptional rates are the same between alleles, and that allele ratios do not differ between RNA and DNA. Both Fisher’s exact test and the beta-binomial test have been applied for this purpose (Kalita et al., 2018b; Vockley et al., 2015). Tests based on the beta-binomial distribution are particularly popular in allele-specific analyses (Castel et al., 2015; Chen et al., 2016; Kalita et al., 2018b; Kumasaka et al., 2016; Skelly et al., 2011; van de Geijn et al., 2015). However, those tests suffer from a number of shortcomings, principally that they do not easily admit the incorporation of prior information, such as the known range of expected effect sizes based on previous experiments (e.g. Patwardhan et al., 2012; Vockley et al., 2015). In addition, they do not directly model variability between replicates.
A richer model that more directly addresses known sources of variability, that directly accommodates the alternative hypothesis that a regulatory effect exists (θ ≠ 1), and that incorporates additional prior information, could conceivably foster more accurate prediction. Probabilistic graphical models (e.g. Bayesian networks, Markov random fields) provide a framework for constructing such rich models. Probabilistic graphical models enable the integration of multiple sources of evidence in a principled and highly flexible way. Given an arbitrary set of variables, observed or unobserved, a graphical model can be constructed in which conditional independence relations between variables are made explicit. Augmenting this dependence structure with distribution assumptions on likelihoods and priors enables inference via standard Bayesian methods. Moreover, graphical models can be used for both hypothesis testing and quantitative estimation.
Here, we describe a probabilistic graphical model that explicitly incorporates prior information and replicate structure to more accurately estimate effect sizes of regulatory variants. Using real data from both synthesized and captured DNA elements, we demonstrate that our model estimates effect sizes of regulatory variants with substantially lower error than the commonly used estimate based on ratios of raw read counts. We also show, using extensive simulations, that our model can detect causal regulatory variants over a greater range of sequencing coverages, effect sizes and allele frequencies, than existing methods. Finally, we demonstrate a clear tradeoff between the number of experimental replicates and total sequencing coverage across replicates, and we show that the use of multiple replicates reduces variance in effect size estimates, even for some estimators that do not model replicates explicitly. These results are of direct relevance to experimental design in allelic assays.
2 Materials and methods
2.1 A probabilistic graphical model of regulatory effects
Our model, called Bayesian Inference of Regulatory Differences (BIRD), is depicted in Fig. 1B. For comparison, the beta-binomial distribution is depicted as a graphical model in Fig. 1A. Variables used in both models are defined in Table 1.
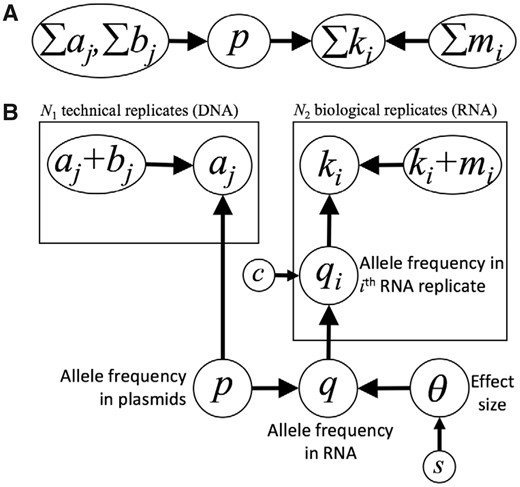
Two graphical models of allelic effects on transcription. Circled variables represent observable and unobservable quantities. Arrows denote conditional independence assumptions. Boxes and subscripts indicate replicates. See Table 1 for definitions of individual variables. (A) Beta-binomial distribution represented as a graphical model. (B) The BIRD model
Definitions of variables in Fig. 1
| Variables | Definitions |
|---|---|
| p | Alternate allele frequency in plasmids (DNA) |
| q | Alternate allele frequency in pooled RNA |
| qi | Alternate allele frequency in ith RNA replicate |
| θ | Effect size |
| aj | Alternate allele count in DNA sequencing reads from jth replicate |
| bj | Reference allele count in DNA sequencing reads from jth replicate |
| ki | Alternate allele count in RNA sequencing reads from ith replicate |
| mi | Reference allele count in RNA sequencing reads from ith replicate |
| c | Concentration parameter for qi |
| s | Variance parameter for prior on θ |
Probabilistic graphical models can be denoted as nodes labeled by variables and arrows between nodes. Informally, an arrow from node A to node B can be understood intuitively as indicating that variable A directly influences variable B. More formally, the topology of the graph denotes conditional independence assumptions between variables. As a result of those conditional independence assumptions, the joint probability distribution for the model can be factored into a product of marginal and conditional distributions, typically resulting in a representation that is less parameter rich and potentially less prone to over-fitting (Koller and Friedman, 2009; Murphy, 2012).
The generative process of the beta-binomial distribution (Fig. 1A) can be understood as follows. The DNA sequencing read counts (pooled across replicates) for the alternate allele ∑aj and the reference allele ∑bj induce a beta distribution on the alternate allele frequency p, which in turn induces a binomial distribution on the count ∑ki of alternate alleles among the pooled RNA sequencing reads, which is also conditional on the total number of RNA reads ∑ki + mi. The beta-binomial model makes the explicit assumption that the alternate allele frequency, p, is the same in the DNA and the RNA—i.e. the null hypothesis.
Variables p and q are not directly observable, as they denote the true allele frequencies in the underlying pool of all DNA and RNA molecules in the cell. However, the DNA read counts aj and bj provide evidence regarding the distribution of p. Similarly, the RNA read counts ki and mi provide evidence regarding the distribution of q. BIRD also includes a replicate-specific allele frequency qi for the ith RNA replicate. As described below, we can use a sampling approach to perform posterior inference on all of these latent variables, most importantly for the effect size, θ.
A key feature of this dependency structure is that we are able to place a mean-1 (mean-0 on a log scale) prior on θ, so as to favor estimates that are close to 1. This is a desirable feature, as we expect most tested variants genome-wide to have no effect; however, when sequencing coverage is sufficiently large, the model is capable of predicting any number of causal variants as dictated by the data (i.e. the data can ‘overwhelm the prior’—a desirable property; Murphy, 2012). Another important feature is the explicit modeling of replicates, which accounts for the possibility that allele frequencies may vary between replicates, due to any combination of biological, technical and statistical factors.
Given this structure, we can perform posterior inference using Markov Chain Monte Carlo (MCMC). Using Metropolis-Hastings (Hastings, 1970), we can obtain a chain of samples for the latent variables p, q, qi and θ. In practice, we generally ignore the samples of p, q and qi, as these serve only to facilitate inference on θ.
Estimation of effect sizes is performed by computing the median of the chain of MCMC samples for θ. In addition to this point estimate, we report a 95% symmetric credible interval for θ, based on the MCMC samples, to indicate the degree of uncertainty in the point estimate.
BIRD is implemented in the probabilistic programming language STAN (Carpenter et al., 2017), and is distributed as STAN source code that can be run in R or python, or compiled to C++. Sampling is performed using Metropolis-Hastings with the Hamiltonian Monte Carlo proposal (Duane et al., 1987). Using a burn-in of 1000 samples followed by 1000 samples for inference, a single variant can be analyzed in approximately 2.5 s on a single CPU core. A simpler version of the model that runs ∼5000 times faster than this is provided for users wishing to test millions of variants efficiently (Supplementary Text S8).
A web tool is also provided that allows users to estimate the required sequencing coverage and number of replicates to detect regulatory variants at a given sensitivity and false discovery rate, over a range of different allele frequencies and effect sizes. This latter tool aids in the design of experiments and the selection of optimal sequencing coverage.
2.2 Evaluation on real and simulated data
To rigorously assess the accuracy of BIRD, we undertook a large-scale experimental study involving 760 human subjects evenly distributed across four ancestries (192 Hispanic, 190 Asian, 189 Black, 189 White). We captured DNA from 104 open chromatin regions in a previously identified GWAS locus for fetal adiposity (Urbanek et al., 2013) and birth weight (Freathy et al., 2010), and we assayed fragments from those regions using Population STARR-seq (Vockley et al., 2015) in adipocytes and pre-adipocytes. We used BIRD to evaluate ∼500 variants present in those regions in the new datasets, as well as variants previously assayed in HepG2 cells (Guo et al., 2017). We assessed whether variants with stronger effects (|log2(θ)| > 0.5) were enriched for being uncommon in the general population (1000 Genomes Project MAF < 0.1), using a Fisher’s exact test. We also applied BIRD to a set of variants that were biochemically synthesized and assayed in human cells using a massively parallel reporter assay by Tewhey et al. (2016). We assessed proportions of variants with posterior probability P(regulatory) > 0.99 in these datasets.
We assessed estimation error by computing the root mean squared error (RMSE) of log2 effect size estimates after downsampling read counts to 30, 50, 100, 500 or 1000 reads per variant. The true effect size was taken to be the value of (RNAalt/DNAalt)/(RNAref/DNAref) at high read coverage prior to downsampling (Supplementary Text S4), where RNAx and DNAx denote raw read counts for allele x (alt = alternate, ref = reference). We applied BIRD to the downsampled data to produce a posterior median estimate of effect size. We also computed a commonly used ad hoc estimator based on ratios of read counts from the downsampled data (Supplementary Text S4). We expected the ad hoc estimate to be increasingly unstable as sequencing coverage decreases, while the posterior estimates from the BIRD model should be more robust due to reliance on priors at low counts. We also tested a version of BIRD lacking the prior on effect size (Supplementary Fig. S3), as well as two versions that pool read counts across replicates (Supplementary Fig. S4).
In addition to the real data collected from reporter assays, we simulated a large number of datasets consisting of regulatory variants (θ ≠ 1) and neutral variants (θ = 1), at a variety of simulated effect sizes, allele frequencies and sequencing coverages, and with a variety of replicate structures. Simulating different combinations of these parameters allowed us to both assess the robustness of our model across a range of scenarios, and to identify tradeoffs between different parameters (e.g. between total sequencing coverage per variant and number of replicates). For each simulated dataset, we assessed classification accuracy (the ability to correctly classify variants as regulatory versus neutral) via receiver operating characteristics (ROC) curves, which we summarize via the area under the ROC curve (AUC).
Our simulator closely emulates the data generation process for real genetic variants (Supplementary Text S6), so that we expect simulated read counts to be similar in all relevant aspects to real genomic variant data from a reporter assay. (The simulator and methods for estimating its parameters are described in Supplementary Text S6 and S7.) We simulated a range of effect sizes (0.50, 0.75, 0.90, 1.0), minor allele frequencies (0.0001 through 0.5), sequencing coverages per variant (30, 50, 100, 500, 1000, 5000, 10 000 and 1 000 000 total reads per variant across replicates) and numbers of replicates (1, 2, 5, 10, 25, 100). We used these simulated datasets to compare the classification accuracy of the BIRD model, the Fisher’s exact test, the beta-binomial test, and a recently published method called QuASAR-MPRA (Kalita et al., 2018b).
3 Results
3.1 Classification and estimation accuracy
Effect size estimates from BIRD were more accurate than those of the ad hoc estimator, both for sequences captured from human donors having skewed allele frequencies (Fig. 2A; Supplementary Fig. S12A), and for biochemically synthesized sequences having allele frequencies approximately centered on 0.5 (Fig. 2B; Supplementary Fig. S12B). On both datasets, removing BIRD’s prior on effect size increased estimation error at read coverages below 1000, both for captured sequences (Fig. 2C) and synthesized sequences (Fig. 2D), demonstrating the importance of prior information for obtaining accurate estimates when sequencing coverage is not high. Priors are discussed in Supplementary Text S1.
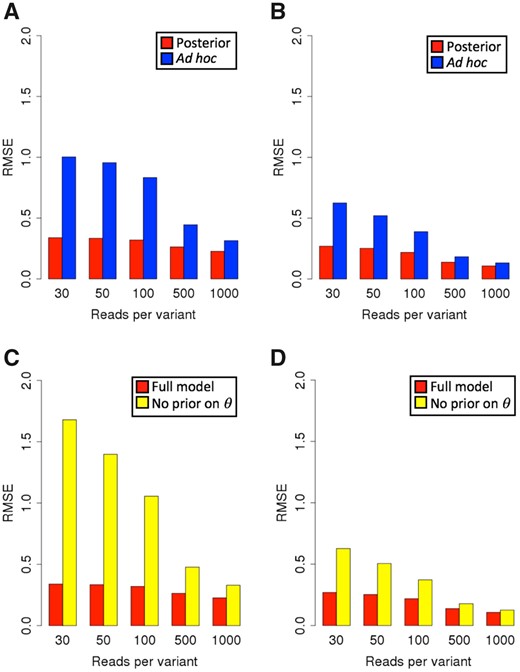
(A) RMSE as a function of total reads per variant for variants in a GWAS locus assayed in HepG2 cells, for posterior median estimates under the BIRD model (red) and for the commonly used ad hoc estimator based on ratios of integer read counts (blue). (B) RMSE as a function of total reads per variant on variants synthesized by Tewhey et al. (2016), for posterior median estimates under the BIRD model (red) and the ad hoc estimator (blue). (C) RMSE as a function of total reads per variant for variants in the GWAS locus assayed in HepG2 cells, for the full BIRD model (red), and a version of BIRD with no effect size prior (yellow). (D) RMSE as a function of total reads per variant for variants synthesized by Tewhey et al. (2016), for the full BIRD model (red), and a version of BIRD with no effect size prior (yellow)
Results on simulated variants indicate that the BIRD model consistently achieves higher classification accuracy of regulatory versus neutral variants than the beta-binomial and Fisher’s exact tests, over a range of simulation parameters (Fig. 3A). Comparisons with QuASAR-MPRA showed that BIRD can have a substantial advantage at low allele frequencies, particularly when coverage is high (Supplementary Figs S17, S18C and S20).
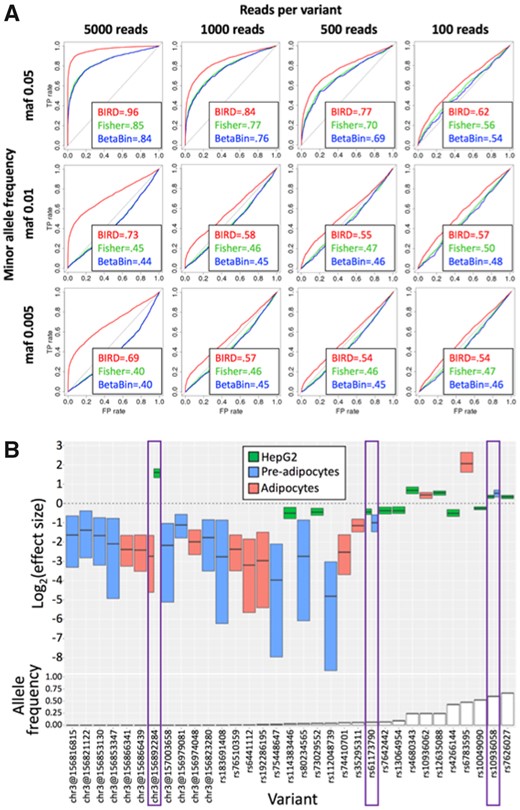
(A) ROC curves and AUC values for BIRD (red), Fisher’s exact test (‘Fisher’, green) and the beta-binomial test (‘BetaBin’, blue), stratified by total sequencing coverage (columns) and minor allele frequency (‘maf’) (rows). Simulations consisted of 3000 regulatory variants (θ=0.5) and 3000 neutral variants (θ=1), with one DNA replicate and 10 RNA replicates. (B) Log2 effect sizes of high-confidence BIRD predictions on variants in the GWAS locus (top panel), and allele frequencies in 1000 Genomes Project samples (The 1000 Genomes Project Consortium et al., 2015) (bottom panel). Segmented colored boxes indicate posterior median and 95% credible interval under the BIRD model. Purple boxes highlight the variants having an effect in multiple cell types. (A higher resolution version of part B is shown in Supplementary Fig. S22)
3.2 Allele frequencies and effect sizes
At low sequencing coverage, regulatory variants simulated to have low minor allele frequencies were very difficult to detect using any of the tested methods (Fig. 3A). At higher sequencing coverage, BIRD had substantially higher classification accuracy for rare variants (minor allele frequency ≤ 0.01) than other methods (Fig. 3A, Supplementary Figs S17, S18 and S20, Supplementary Text S9.6). Because selection is expected to reduce allele frequencies of causal disease variants (Dudley et al., 2012; Hartl and Clark, 1997), the ability to detect rare regulatory variants is crucial. In the GWAS locus, we observed an enrichment among variants with stronger effects to be rare or uncommon (Fisher’s exact: p = 0.0003 in pre-adipocytes, p = 0.04 in adipocytes, p = 1 in HepG2; Fig. 3B; Supplementary Fig. S21C and Text S9.1.1). We also observed an enrichment in the GWAS locus for regulatory variants having negative effects on transcription (Wilcoxon V = 9741, p = 7.9 × 10−41; Fig. 3B; Supplementary Fig. S21A and Text S9.1.1), consistent with previously published findings (Kwasnieski et al., 2012; Patwardhan et al., 2012). Of 523 tested variants in the GWAS locus (the union across the three cell types), 96 were identified by BIRD as regulatory variants with high posterior probability (P(regulatory) > 0.99) in at least one cell type, a proportion of 18.3%, a 1.45-fold enrichment over the proportion (12.6% = 3878/30 667) in the genome-wide Tewhey et al. data (Supplementary Text S9.1.2). QuASAR-MPRA identified 16 and 54 variants in these datasets, respectively, as significant (FDR adjusted p < 0.05).
Strong impacts on predictive accuracy were apparent when we varied allele frequency and effect size in the simulations (Supplementary Fig. S1). Effect size is of particular concern, because subtle effects were not reliably detected by any method (Supplementary Fig. S1), and previous observations indicate that effects of real regulatory variants are typically less extreme than a halving or a doubling (Patwardhan et al., 2012; Tewhey et al., 2016; Vockley et al., 2015).
3.3 Replicates and read coverage
Larger sequencing coverage per variant generally resulted in higher predictive accuracy in simulations (Supplementary Fig. S1). While this suggests a strategy of always sequencing as deeply as possible, an alternate strategy is to perform larger numbers of experimental replicates. In simulations where the total sequencing coverage was fixed at 500 reads per variant, partitioning those 500 reads into larger numbers of RNA replicates resulted in substantial increases in predictive accuracy (Fig. 4A and B, solid lines). This demonstrates that the use of multiple replicates has value in facilitating estimation of variation, which in turn improves predictive accuracy.
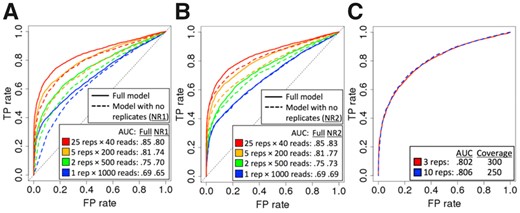
(A) ROC curves for BIRD and model NR1 (no replicates) under different numbers of simulated replicates (‘reps’), with fixed sequencing coverage of 1000 total reads per variant. Simulation: maf = 0.1, 3000 variants with θ =0.5, 3000 variants with θ =1. (B) ROC curves for BIRD and model NR2 (no replicates), on the same simulated data as for panel A; differences are smaller than in panel A, due to the inclusion of an additional latent variable that captures some of the variability between replicates (Supplementary Text S9.3). (C) Tradeoff between replicates and total sequencing coverage per variant on one simulated dataset. Red: three replicates at 300 total reads per variant. Blue: 10 replicates at 250 total reads per variant. Simulation: maf = 0.1, 1000 variants with θ =0.5, 1000 variants with θ =1
Furthermore, we observed a clear tradeoff between the impacts of sequencing coverage and number of replicates on predictive accuracy. On one simulated dataset, the effect on predictive accuracy of decreasing the total (summed across replicates) sequencing coverage from 300 total reads per variant to 250 total reads per variant was almost perfectly compensated by increasing the number of replicates from 3 to 10 (Fig. 4C). This suggests that substantial savings in cost and/or experimental effort may be achieved by choosing appropriately between deeper sequencing versus additional replicates. Our experimental design web tool facilitates such decisions by enabling experimentalists to explore these tradeoffs systematically (Supplementary Fig. S7).
Surprisingly, we found that generating multiple experimental replicates improved predictive accuracy even when replicate structure was not explicitly modeled (Fig. 4A and B, dashed lines). This result is counterintuitive, as the model lacking replicate structure (Supplementary Fig. S4) is not directly informed of the assignment of reads to replicates or even the number of replicates that were generated. This seeming contradiction is in fact consistent with the known properties of the Poisson-binomial distribution (Supplementary Text S9.3). Though counterintuitive, it can be shown that under a Poisson-binomial distribution, variance in allelic read count decreases as heterogeneity between replicates increases (Poisson, 1837; Supplementary Text S9.3). In simulation results, we indeed observed that greater heterogeneity between replicates reduced variance in read counts (Supplementary Fig. S11A), reduced variance in estimates of allele frequency and effect size (Supplementary Fig. S11B and C), and reduced RMSE in estimates of effect size, even for the simple, ad hoc estimator that does not consider replicates (Supplementary Fig. S11D).
The latter result suggests that multiple biological replicates should always be generated for allelic data, regardless of whether data will be analyzed in a replicate-aware manner, because variability between replicates naturally induces a Poisson-binomial distribution with lower variance in allelic read counts. Nevertheless, the full BIRD model that explicitly distinguishes replicates performed better than the naïve models that pool counts across replicates (Fig. 4A and B, solid versus dashed lines), indicating that a replicate-aware model should be used whenever possible, to attain an additional boost in predictive accuracy.
4 Discussion
The ability to fine-map causal genetic variants is one of the most important goals of modern genetics (reviewed in Spain and Barrett, 2015). High-throughput functional assays are crucial components of mapping strategies for association signals in noncoding regions, which are suspected to harbor many causal disease variants (Farh et al., 2015; Javierre et al., 2016; Zhang and Lupski, 2015). While sequencing costs have dropped dramatically in recent years, simply sequencing all assayed loci to extreme coverage is not generally feasible, nor is it the most cost-effective strategy. Statistical models that can make the most effective use of, and extract the most information from, sequencing-based assays are therefore of central importance in the functional mapping of noncoding variants.
Compared to existing methods that make use of null-hypothesis significance testing based on simple parametric distributions, a graphical modeling approach enables the integration of prior information in a principled and flexible way. A graphical model that accurately reflects the dependency structure of the problem and that accounts for all known sources of variability in the data would seem to stand a better chance of producing accurate predictions than a simpler model that makes use of less information. As we have shown, our model consistently produces higher predictive accuracy than simpler methods.
In addition, we have found that our model has a particular advantage in detecting rare variants having a regulatory effect. This is of particular import in the search for causal disease variants, as we expect natural selection to result in many causal variants having very low allele frequencies (Dudley et al., 2012; Hartl and Clark, 1997). As our results show, for some combinations of allele frequency and effect size, none of the sequencing coverages considered here would suffice to allow any of the tested methods to detect such variants. This has clear practical implications for the use of these functional assays in the search for disease variants, particularly when testing sequences captured from a patient pool. The use of synthetic constructs may alleviate this problem, as test sequences can be synthesized to have high allele frequencies; our results show that predictive accuracy is typically highest when allele frequencies are close to 0.5. While it may not be viable at present to synthesize all variants of interest genome-wide, as synthesis costs drop, this may change, and for some focused regions it may already be feasible.
As we showed, substantial improvements in predictive accuracy can be achieved in a Bayesian framework via the incorporation of prior information. In the BIRD model, the prior on effect size tends to shrink estimates toward the null value, which is consistent with our expectation that most variants in a genome will not impact regulatory function in a biologically significant way. However, a particular advantage of the Bayesian approach is that when read coverage is low, the prior helps to reduce the false positive rate by shrinking effect size estimates, while at higher read coverage the data can ‘overwhelm the prior’—a well-known property of Bayesian models, and one that is absent from the simple beta-binomial approaches.
The other feature of our model that aided its performance was the incorporation of replicate structure. Explicit modeling of replicates facilitates the estimation of biological variation, which in turn informs assessment of statistical significance. Moreover, the generation of multiple biological replicates induces a Poisson-binomial distribution on allelic read counts that reduces variance and increases predictive accuracy, suggesting that for allelic assays, multiple biological replicates should always be performed when predictive accuracy is critical.
In addition to accurately classifying variants as regulatory versus neutral, the ability to quantitatively estimate effect sizes is an important one, as the variants with the largest effect sizes are often of greatest interest in variant prioritization efforts. Nevertheless, detection of variants with weaker effects may be important as well. It has been proposed that a number of complex diseases may be impacted by the combined effects of multiple regulatory variants each of modest effect (Chatterjee et al., 2016; reviewed in Price et al., 2015). As we have shown, regulatory variants of weak effect are among the most difficult to identify in sequencing-based reporter assays. Methods for accurately identifying these subtle variants may therefore be critical in the quest for uncovering the genetic basis for various complex phenotypes.
The ability to represent arbitrary dependency structures makes probabilistic graphical models highly flexible as methods for integrating multiple sources of information. However, this flexibility comes at a cost, as inference can be more complex than with simple distributions having closed-form analytic solutions (Koller and Friedman, 2009; Murphy, 2012). For models with real-valued (rather than discrete) parameters, inference is often performed using a sampling approach such as MCMC. While MCMC can be computationally burdensome in high dimensions, inference can be very efficient for low-dimensional models such as ours. Furthermore, recent developments in adaptive MCMC, such as the Hamiltonian Monte Carlo sampler, have resulted in dramatic improvements in convergence times for a number of models (reviewed in Durmus et al., 2017). Probabilistic programming languages such as STAN, BUGS (Lunn et al., 2009), JAGS (Plummer, 2003) and Edward (Tran et al., 2016) that implement these methods enable rapid and flexible model development. One result of this flexibility is that multiple versions of a model can often be produced easily from a base model, so that models can be adapted and applied to datasets lacking one or more features. In addition, the impact of individual features on predictive accuracy can be systematically explored, as we have done here.
While our model has clear utility for identifying regulatory variants based on real sequencing data, the ability to simulate realistic sequencing data for regulatory and neutral variants has direct applicability to experimental design. By simulating variants over a range of effect sizes, sequencing coverages, allele frequencies and replicate structures, we can estimate power and required sample sizes, and explore tradeoffs between different experimental designs. In particular, we have shown that a clear tradeoff exists between replicate structure and total sequencing coverage per variant, with larger numbers of replicates in some cases compensating for smaller total (per variant) sequencing coverage across replicates. Conversely, for some experiments, reagent costs and experimental effort might dictate that deeper sequencing and fewer replicates could be more cost-effective, particularly given the trend toward declining sequencing costs. Our framework allows these tradeoffs to be explored systematically, so that more informed decisions can be made when experiments are in the planning stage. Improvements in experimental design may in turn result in improved signal in the resulting data that facilitates better identification of functional regulatory variants.
The flexibility of this modeling framework suggests a number of future improvements that can be readily entertained. One future direction is the incorporation of treatment effects. Genetic variants that impact the response to drugs, hormones or other stimuli are of direct clinical relevance, and experimental methods for identifying such interactions are of clear value (Madian et al., 2012; Roden et al., 2011). Given high-throughput reporter assay data collected under both treatment and control conditions, a straightforward extension of our model should enable inference of differences in transcriptional rates between conditions and the degree to which that response is altered by genetic factors. Other extensions to our approach, such as the modeling of multiple variants that may act in non-independent ways, are likewise promising directions for future research, and should be feasible within the context of our modeling framework.
Acknowledgments
We would like to thank S. Mukherjee and J. Silverman for helpful discussions.
Author contributions
WHM designed, implemented and tested the model under the guidance of ASA and TER. WHM, TER and ASA wrote the manuscript. CG performed all experiments. Y-SK and AB implemented the web tool. FL, XW and ASA provided statistical advice. TER, SJC and GDJ provided biological insight that influenced the model design. MGH, DMS and WLL ascertained the study population, performed genotyping and sample selection and provided DNA samples.
Funding
This work was funded through the following grants: National Institutes of Health (NIH) U01 HG007900 (AB, TER, WHM), NIH R01 DK097534 (CG, DMS, MGH, TER, WHM, WLL), NIH R01 DK099820 (CG, DMS, MGH, TER, WHM, WLL), NIH 1UM HG009428 (TER), NIH F32 1F32DK115188 (GDJ), March of Dimes FP059028-01-PR (SJC, TER). WHM was also supported through generous support from the Duke University, Biostatistics and Bioinformatics Department.
Conflict of Interest: none declared.

