


Abstract
Recent studies have shown that DNA N6-methyladenine (6mA) plays an important role in epigenetic modification of eukaryotic organisms. It has been found that 6mA is closely related to embryonic development, stress response and so on. Developing a new algorithm to quickly and accurately identify 6mA sites in genomes is important for explore their biological functions.
In this paper, we proposed a new classification method called MM-6mAPred based on a Markov model which makes use of the transition probability between adjacent nucleotides to identify 6mA site. The sensitivity and specificity of our method are 89.32% and 90.11%, respectively. The overall accuracy of our method is 89.72%, which is 6.59% higher than that of the previous method i6mA-Pred. It indicated that, compared with the 41 nucleotide chemical properties used by i6mA-Pred, the transition probability between adjacent nucleotides can capture more discriminant sequence information.
The web server of MM-6mAPred is freely accessible at http://www.insect-genome.com/MM-6mAPred/
Supplementary data are available at Bioinformatics online.
1 Introduction
Epigenetic modification can regulate gene expression without altering DNA sequences. At present, confirmed epigenetic phenomena include DNA methylation, RNA methylation, genomic imprinting, gene silencing, RNA editing, maternal effect, transposon activation and so on. Among them, DNA methylation is the most important modification for epigenetic regulation of gene expression. DNA N6-methyladenine (6mA) refers to the methylation of the N6 position of adenine, which has been found to play an important role in the epigenetic modification of DNA in eukaryotes in recent years. This modification has been shown to be associated with germ cell differentiation, stress response, embryonic development, nervous system and other processes (Liu et al., 2016; Yao et al., 2017; Zhang et al., 2015).
DNA 6mA was initially identified in Escherichia coli and then found in several other bacteria (Janulaitis et al., 1983). Researchers once believed that 6mA existed only in prokaryotes and single-cell organisms. In 1966, Unger and Venner (1996) detected the presence of 6mA in bovine and human sperm cells, but the results could not be well replicated. With the development of biotechnology, 6mA was found in Chlamydomonas, Nematodes and Drosophila in 2015, and its functions were identified (Fu et al., 2015; Greer et al., 2015; Zhang et al., 2015).
In 2016, the study of 6mA modification of mouse embryos was published in Nature (Wu et al., 2016). In 2018, a team from the Sun Yat-sen University used sequencing technologies to map the 6mA of Chinese DNA for the first time (Xiao et al., 2018). In the same year, Zhou et al. (2018) analyzed the distribution of 6mA sites in the rice genome by multiple sequencing methods, such as 6mA-IP-Seq, liquid chromatograph-mass spectrometer (LC-MS/MS) and single-molecule and real-time sequencing (SMRT). Although the expression abundance of DNA 6mA is very low, recent studies on 6mA have shown that the modification is closely related to gene transcription regulation.
SMRT is the mainstream experimental technique for identifying m6A sites. However, the technology cannot detect m6A sites from the whole genome, and the cost of the technique is high. Thus, it is particularly important to develop efficient algorithms for identifying DNA 6mA sites computationally. To date, there are many methods to predict methylation modification of 5-methylcytosine. However, there is only one identification method for 6mA methylation modification. Chen et al. (2019) developed a method named i6mA-Pred for identifying DNA 6mA sites. Their method used a support vector machine (SVM) classifier based on chemical features of nucleotides and position-specific nucleotide frequencies. However, the association information among nucleotides near 6mA sites is ignored. We find that the transition probabilities between neighboring bases in 6mA sequences and non-6mA sequences are significantly different. Based on this finding, we introduce a novel method named MM-6mAPred based on a Markov model (MM) to identify DNA 6mA sites. In fact, neighboring dependency among biological sequences has long been modeled through Markov chain models (Almagor, 1983; Borodovsky et al., 1995; Durbin et al., 1998; Ohler et al., 1999; Reese et al., 1997; Wren et al., 2005; Yakhnenko et al., 2005 and so on). Researchers have also shown that some basic biological and chemical features of nucleic acids stand behind the frequencies of dinucleotides (Almagor, 1983). However, up to our knowledge, MM-6mAPred is the first tool for identifying 6mA sites using this neighboring dependency information. The results show that the performance of MM-6mAPred is significantly better than that of i6mA-Pred.
2 Materials and methods
2.1 Dataset
For the convenience of the comparison between the existing method i6mA-Pred and our method, we used the same experimental benchmark data that i6mA-Pred used (Chen et al., 2019; Zhou et al., 2018). In summary, 880 positive sequences containing 6mA sites and 880 negative sequences containing no 6mA sites from the rice genome were downloaded from http://lin-group.cn/server/i6mAPred/data. Each sequence contains 41 nucleotides (nt) with the adenine of interest in the center.
2.2 Construction of MM
A MM is a stochastic process where the next variable only depends on the most recent variable(s) instead of all the previous variables. The most commonly used MM in DNA sequence analyses is the first-order Markov chain, where the next nucleotide will solely depend on the current nucleotide. In this study, we model the sequence of 6mA site as a first-order Markov chain. More specifically, let be the random variable at the t-th location of the sequence of length L The MM assumes that for . Figure 1 shows the flow chart for identifying sequences containing 6mA sites by MM-6mAPred. From the 6mA sequences in the training dataset, we estimate , which is the probability vector that the nucleotide shows up at the initial position, and , which are the transition probability matrices of respectively. Similarly, for non-6mA sequences, is the initial distribution of nucleotides, are the corresponding transition probabilities. Therefore, two MMs and are trained based on the 6mA sequences and non-6mA sequences in the training dataset. Figure 1B shows the prediction of a test sequence ‘Seq=GTAT…AA’ of 41 nucleotides. We calculate the probabilities and of generating the sequence ‘Seq’ under the model and , respectively; and then use the ratio of to , i.e. the likelihood ratio, to determine whether ‘Seq’ is a 6mA or non-6mA sequence. Here, and If , ‘Seq’ is classified as a 6mA sequence, otherwise a non-6mA sequence. Note that the likelihood ratio can be any non-negative value. One may also use the log-likelihood ratio for symmetricity, whose natural threshold is zero instead of one.
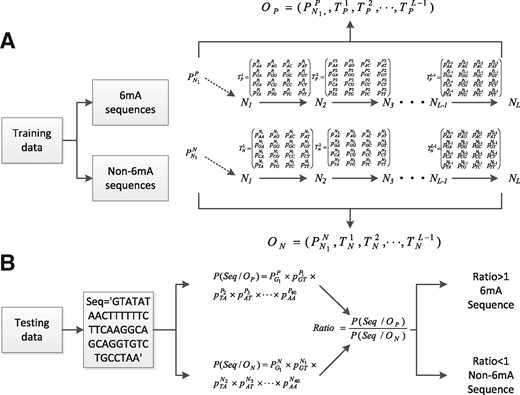
The flow chart for identifying 6mA sequences by MM-6mAPred. (A) The construction of two MMs (OP and ON) based on DNA 6mA sequence and non-6mA sequence. (B) The prediction for a test sequence. The sequence ‘GTATATAACTTTTTTCTTCAAGGCAGCAGGTGTCTGC CTA A’ is used as an example to explain the prediction process
2.3 Prediction accuracy assessment
3 Result and discussion
3.1 Analysis of transition probability between adjacent nucleotides
In order to demonstrate the rationality of 6mA sequence recognition based on the MM, we show the difference of transition probabilities between adjacent nucleotides in 6mA and non-6mA sequences. Figure 2 shows that the transition probabilities of A to A and C to G were significantly different from the 12th to 33th site and the 16th to 37th site. The results indicated that the first-order Markov chain is informative for identifying sequences containing 6mA sites. However, the regions showing significant difference in transition probabilities of different nucleotide pairs are not the same. Thus, how to determine an appropriate region for classification is critical. Section 3.2 introduces the process of solving this problem in detail.
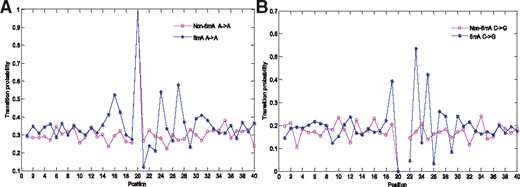
Transition probabilities between adjacent nucleotides at all sites. The sub-figures (A) and (B) show the transition probabilities of the nucleotides A to A and C to G, respectively. The red and blue lines represent the 6mA and non-6mA sequences, respectively. In Fig. 2B, the C->G transition probability at Position 21 is undefined because the nucleotide at Position 21 is always A. (Color version of this figure is available at Bioinformatics online.)
To simplify the calculation of Ratio and demonstrate the detail discriminant information, we show the values of all in Fig. 3. The vector for the four nucleotides (A, G, C, T) is (1.09, 1.00, 0.91, 0.97) for the first position of the 41 nucleotides in the input dataset. In Fig. 3, if a value of is close to 1, there is no difference between the corresponding transition probabilities from 6mA and non-6mA sequences. Figure 3 indicates that there is a significant difference in the transition probabilities among the regions from [22–23] to [27–28].
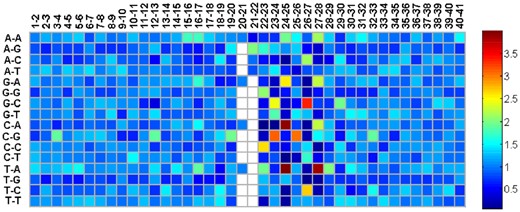
The visualization of . The variable names along the vertical axis represent the nucleotide pair (). The variable names along the horizontal axis represent the location pair i −i + 1 (i = 1, 2,…, 40). White squares in the figure represent undefined due to the fact that the 21st position of the input sequences is all A
3.2 Selection of the best subsequence region
Considering that not all the 41 nucleotides in the 6mA sequences and non-6mA sequences may provide classification information, we use a 10-fold cross-validation procedure to determine the best region. For the 41 sites, considering that the middle site has to be included, there are in total 400 possible continuous regions that can be used: [1, 22], [1, 23], ···, [1, 41]; [2, 22], [2, 23], ···, [2, 41]; ···; [20, 22], [20, 23], ···, [20, 41]. The classification accuracy of every region can be calculated by a 10-fold cross-validation, which is shown in Fig. 4. The accuracy reaches the maximum (89.72%) at the region [3, 39]. Thus, in this study, [3, 39] is used as the best subsequence region.
![The classification accuracies of 400 regions based on the 10-fold cross-validation. There are 20 lines of different colors in the figure, and the i-th line represents the regions [i, 22]–[i, 41]. The horizontal axis represents the number from 22 to 41. The region [3, 39], which has the highest ACC (0.8972), is located at the line for [3, 22]–[3, 41]](https://oup.silverchair-cdn.com/oup/backfile/Content_public/Journal/bioinformatics/36/2/10.1093_bioinformatics_btz556/3/m_btz556f4.jpeg?Expires=1716522438&Signature=AnAuoW-21ZV1v2C~OZud5S33yh89C4IZzFPCuMIYvC9123~oEjWmI3JJZPtW78PB4ADpW~sHLS31jvKzR6Jk-lGO4HjvLTI8QLn7sGnwx7v~-8mxJ6aLjifXxWGaudl0LxNErsXk94-59FIcImPBFbtD94nKaaj50A5OCAO3oe-khgtzr71ohybxUK7BwXVHJ59kvXSaYKZuscBDYd8-JVcHL5pBlMDq52sK5bfNVFimA-oA6QvqshoVUtYS9D6R-m8SbDaZgk7Ccdcv4zm7~OY~kgs7OY8e6lO1aGrJaGIzJrjsps6nu0rB3h-O4k9czvcY8jvNKAx909bC--30GA__&Key-Pair-Id=APKAIE5G5CRDK6RD3PGA)
The classification accuracies of 400 regions based on the 10-fold cross-validation. There are 20 lines of different colors in the figure, and the i-th line represents the regions [i, 22]–[i, 41]. The horizontal axis represents the number from 22 to 41. The region [3, 39], which has the highest ACC (0.8972), is located at the line for [3, 22]–[3, 41]
3.3 Comparison with other methods
So far, i6mA-Pred is the only existing identification algorithm for 6mA sequences. This method used an SVM classifier based on 164 features, which include nucleotide chemical properties and nucleotide frequencies. For the ease of comparing i6mA-Pred with MM-6mAPred, we used the same 880 6mA sequences and 880 non-6mA sequences from the rice genome provided by the i6mA-Pred paper. For i6mA-Pred, the LibSVM package 3.18 (http://www.csie.ntu.edu.tw/∼cjlin/libsvm/) is used to construct the SVM classifier. To be consistent with the i6mA-Pred paper, the kernel, cost (C) and gamma (ϒ) of SVM are set to radial basis kernel function, 32 and 0.00048828125, respectively. We use the 10-fold cross-validation to measure the performance of i6mA-Pred and MM-6mAPred (see Table 1). The Sn, Sp and ACC of MM-6mAPred are 89.32%, 90.11% and 89.72%, respectively. Our ACC is 6.59% higher than that of i6mA-Pred (83.13%). The results show that the transition probabilities between adjacent nucleotides can reflect better discriminant information.
Cross-validation accuracy of i6mA-Pred and MM-6mAPred based on the same dataset
| Method | Sn (%) | Sp (%) | ACC (%) | MCC |
|---|---|---|---|---|
| i6mA-Pred | 82.95 | 83.30 | 83.13 | 0.662 |
| MM-6mAPred | 89.32 | 90.11 | 89.72 | 0.786 |
| Method | Sn (%) | Sp (%) | ACC (%) | MCC |
|---|---|---|---|---|
| i6mA-Pred | 82.95 | 83.30 | 83.13 | 0.662 |
| MM-6mAPred | 89.32 | 90.11 | 89.72 | 0.786 |
To compare the two methods more systematically, the receiver operating characteristic (ROC) curves and precision recall curves (PRC) were plotted in Fig. 5. The area under curve of MM-6mAPred and i6mA-Pred are 0.9354 and 0.8948, respectively. The results show that our method outperforms i6mA-Pred.
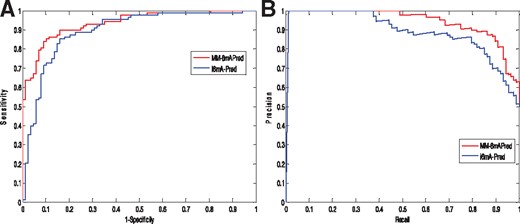
(A) The ROC curves of MM-6mAPred and i6mA-Pred. (B) The PRC curves of MM-6mAPred and i6mA-Pred
The above performance evaluation and comparison are based on the benchmark dataset. One may also be interested in the performance on genome scale since there are a huge number of adenine sites in the genome, which are mostly non-6mA sites. Since 6mA seldom appears in coding sequences (CDSs), the adenine sites from CDSs were used to construct non-6mA sequences (Chen et al., 2019; Zhou et al., 2018). Thus, we downloaded the rice CDSs (ZS97RS2.LNNJ00000000.CDS. v2.fa.gz) from http://rice.hzau.edu.cn/rice/ (Song et al., 2018), and compile a large negative dataset by randomly selecting 1000 rice CDSs, which obtains 314 711 adenine sites. With MM-6mAPred trained using the benchmark dataset, 50 141 (15.93%) sites were predicted to be 6mA sites. Among them, the 41 nt window of six predicted 6mA sites match exactly with some sequences in the 880 benchmark 6mA sequences. The information of the 1000 CDSs and the prediction results are provided in Supplementary Section S1. As a comparison, i6mA-Pred classified 64 853 (20.61%) of the sites as 6mA (see details in Supplementary Section S2). These results indicate that the performance of our method on the big negative dataset is better than that of i6mA-Pred, and the performance is consistent with those in Table 1.
When dealing with a large dataset, one may want to select a more stringent cutoff to reduce the false positives. MM-6mAPred actually has an advantage over i6mA-Pred on this aspect. As shown in Fig. 5, our method can still have a Sn around 0.55 when the false positive rate 1−Sp is controlled at 0.01, but the Sn of i6mA-Pred will decrease below 0.2 in this situation.
The log(Ratio) histograms in Fig. 6 also illustrate the discriminant information captured by MM-6mAPred. We can see that the distributions of the negative benchmark sequences and the CDS sequences are similar, and the distribution difference between positive sequences and negative sequences is obvious. Therefore, the users can select a small false positive rate error by moving the threshold to the right. If the false positive rate error on the 880 negative samples is set at 0.01, 2.27% of the CDS sites would be predicted as 6mA by MM-6mAPred (see details in Supplementary Section S1). As a comparison, i6mA-Pred would predict 20.61% of the CDS sites to be 6mA (see details in Supplementary Section S2). Therefore, MM-6mAPred will report much less false positive 6mA sites than i6mA-Pred for large datasets.
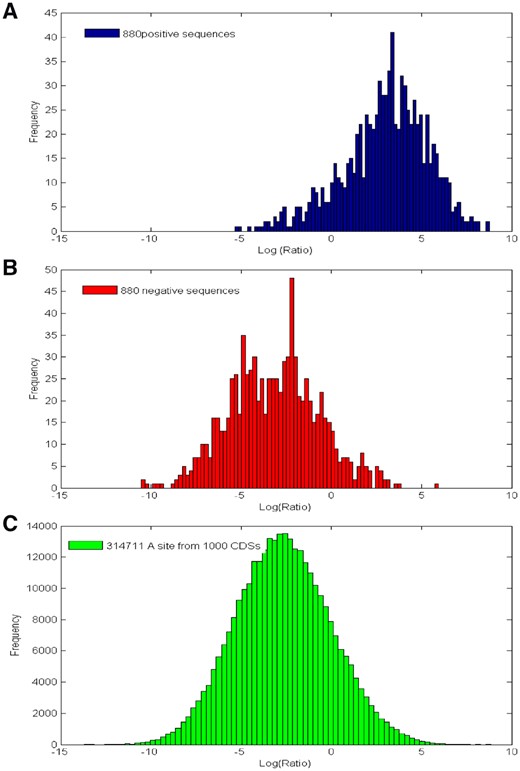
The histograms of log(Ratio) from the 880 positive sequences (A), the 880 negative sequences (B) and the 314 711 adenine sites from the 1000 random CDSs (C), respectively
3.4 Application of program and web server
We developed a Matlab function (MM-6mAPred (Seq)) to identify the DNA 6mA sites from either 41 nt short sequences or a long genomic sequence.
(1) If the input sequence of the function M6-mAPred (Seq) is a short sequence of 41 nt (although we actually only use the region [3, 39]), the return results include the Location and Ratio of DNA 6mA site. For example:
Seq1=‘AATTGGATAGGGAGAAGCCGATGTAGCTGATTCTAGCAAGA’.
[Ratio, Location, Class]=MM6mAPred(Seq1);
Output: Ratio = 33.2297; Location = 21, Class = 6mA
(2) For a sequence longer than 41 nt, the function scans all subsequences of 41 nt which have the nucleotide ‘A’ in the middle (although we actually only use the region [3, 39]). Table 2 shows the output of Seq2 from the function call MM-6mAPred (Seq2). The results indicate that the 21th and 35th positions in Seq2 are identified as 6mA sites.
The output of Seq2 under the function MM-6mAPred (Seq)
| Ratio | 2.071 | 0.015 | 1.032 | 0.0391 | 0.128 |
|---|---|---|---|---|---|
| Location | 21 | 28 | 35 | 37 | 46 |
| Class | 6mA | Non-6mA | 6mA | Non-6mA | Non-6mA |
| Ratio | 2.071 | 0.015 | 1.032 | 0.0391 | 0.128 |
|---|---|---|---|---|---|
| Location | 21 | 28 | 35 | 37 | 46 |
| Class | 6mA | Non-6mA | 6mA | Non-6mA | Non-6mA |
Seq2=‘AATTGGATAGGGAGAAGCCGATGTAGCTGATTCTAGCAAGAGTATATAACTTTTTTCTTCAAGGCAGCAGGTGTCTGCCTAAAACGGGTGGACGTCCACCCGAATGATTAGAATCCCTCTCCA’.
[Ratio, Location, Class]=MM-6mAPred(Seq2);
In order to facilitate researchers to better use the MM-6mAPred to identify 6mA sites, we have established a user-friendly web server for MM-6mAPred. It is freely available at http://www.insect-genome.com/MM-6mAPred/. There are two forms for the input of our web tool. One is the sequences with length of 41, the other one is the sequences longer than 41. If the length of the sequence is longer or may even be a complete genome sequence, the second input form can be selected to predict the 6mA sites. Besides, users can paste FASTA format sequences into the text area or upload an FASTA format file with your sequences. Finally, the uploaded sequences are predicted by pressing the ‘submit’ button. Waiting a moment and the identification results will be presented in web page.
4 Conclusion
The accurate identification of DNA 6mA sites is a necessary step before probing their biological functions. In this study, we proposed an MM called MM-6mAPred to identify 6mA sites computationally. The classification performance is evaluated by the 10-fold cross-validation. The results show that MM-6mAPred is obviously superior to the existing algorithm i6mA-Pred although less information is used. The success of MM-6mAPred indicates that the transition probability between adjacent nucleotides can capture more discriminant sequence information. The SVM method used by i6mA-Pred did not make use of this neighboring dependency information.
MM-6mAPred might also be improved in many aspects. For example, the procedure for selecting the best subsequence region may consider a wider window, such as 201nt instead of 41nt, if the benchmark 6mA sites can be uniquely matched to the genome for sequence extension purpose. The chosen region may also not necessarily a contiguous region. Instead, two or more disconnected areas may be chosen. The region selection criterion may also be revised to balance between the classification accuracy and the model complexity. Furthermore, one may extend our first-order MM to higher order in order to catch more dependency information.
Funding
This work was supported by the National Key Research Development Program and Hong Kong Scholars Program [2016YFC1200600, 2017YFC1200602 and 2017-037], and three grants from the Research Grants Council of the Hong Kong Special Administrative Region, China (Theme-based Research Scheme T12-710/16-R; General Research Fund 14203915 and 14173817).
Conflict of Interest: none declared.
References

