


Abstract
Computational approaches for predicting drug–target interactions (DTIs) can provide valuable insights into the drug mechanism of action. DTI predictions can help to quickly identify new promising (on-target) or unintended (off-target) effects of drugs. However, existing models face several challenges. Many can only process a limited number of drugs and/or have poor proteome coverage. The current approaches also often suffer from high false positive prediction rates.
We propose a novel computational approach for predicting drug target proteins. The approach is based on formulating the problem as a link prediction in knowledge graphs (robust, machine-readable representations of networked knowledge). We use biomedical knowledge bases to create a knowledge graph of entities connected to both drugs and their potential targets. We propose a specific knowledge graph embedding model, TriModel, to learn vector representations (i.e. embeddings) for all drugs and targets in the created knowledge graph. These representations are consequently used to infer candidate drug target interactions based on their scores computed by the trained TriModel model. We have experimentally evaluated our method using computer simulations and compared it to five existing models. This has shown that our approach outperforms all previous ones in terms of both area under ROC and precision–recall curves in standard benchmark tests.
The data, predictions and models are available at: drugtargets.insight-centre.org.
Supplementary data are available at Bioinformatics online.
1 Introduction
The development of drugs has a long history (Drews, 2000). Until quite recently, pharmacological effects were often discovered using primitive trial and error procedures, such as applying plant extracts on living systems and observing the outcomes. Later, the drug development process evolved to elucidating mechanisms of action of drug substances and their effects on phenotype. The ability to isolate pharmacologically active substances was a key step towards modern drug discovery (Sneader, 2005; Terstappen et al., 2007). More recently, advances in molecular biology and biochemistry allowed for more complex analyses of drugs, their targets and their mechanisms of action. The study of drug targets has become very popular with the objective of explaining mechanisms of actions of current drugs and their possible unknown off-target activities. Knowing targets of potential clinical significance also plays a crucial role in the process of rational drug development. With such knowledge, one can design candidate compounds targeting specific proteins to achieve intended therapeutic effects.
However, a drug rarely binds only to the intended targets, and off-target effects are common (Xie et al., 2012). This may lead to unwanted adverse effects (Bowes et al., 2012), but also to successful drug re-purposing, i.e. use of approved drugs for new diseases (Corbett et al., 2012). To illustrate the impact off-target effects can have in new therapy development, let us consider aspirin that is currently being considered for use as a chemopreventive agent (Rothwell et al., 2010). However, such a therapy would be hampered by known adverse side-effects caused by long-term use of the drug, such as bleeding of upper gastrointestinal tract (Li et al., 2017). After identifying the exact protein targets of aspirin that cause these adverse effects, the proteins can be targeted by newly developed and/or re-purposed drugs to avoid the unwanted side-effects of the proposed treatment.
Large-scale and reliable prediction of drug–target interactions (DTIs) can substantially facilitate development of such new treatments. Various DTI prediction methods have been proposed to date. Examples include chemical genetic (Terstappen et al., 2007) and proteomic methods (Sleno and Emili, 2008) such as affinity chromatography and expression cloning approaches. These, however, can only process a limited number of possible drugs and targets due to the dependency on laboratory experiments and available physical resources. Computational prediction approaches have therefore received a lot of attention lately as they can lead to much faster assessments of possible drug–target interactions (Mei et al., 2013; Yamanishi et al., 2008).
The work of Yamanishi et al. (2008) was one of the first approaches to predict drug targets computationally. Their approach utilized a statistical model that infers drug targets based on a bipartite graph of both chemical and genomic information. The BLM-NII (Mei et al., 2013) model was developed to improve the previous approach by using neighbour-based interaction-profile inference for both drugs and targets. More recently, (Cheng et al., 2012a, b) proposed a new way for predicting DTIs, where they have used a combination of drug similarity, target similarity and network-based inference. The COSINE (Rosdah et al., 2016) and NRLMF (Liu et al., 2015) models introduced the exclusive use of drug–drug and target–target similarity measures to infer possible drug targets. This has an advantage of being able to compute predictions even for drugs and targets with limited information about their interaction data. However, these methods only utilized a single measure to model components similarity. Other approaches such as the KronRLS-MKL (Nascimento et al., 2016) model used a linear combinations of multiple similarity measures to model the overall similarity between drugs and targets. Non-linear combinations were also explored in (Mei et al., 2013) and shown to provide better predictions.
Recently, Hao et al. (2017) proposed a model called DNILMF that uses matrix factorization to predict drug targets over drug information networks. This approach showed significant improvements over other methods on standard benchmarking datasets (Hao et al., 2017; Yamanishi et al., 2008). All the previously discussed works were designed to operate on generic similarities of drug structure and protein sequence, therefore they can provide efficient predictions on new chemicals. More recently, approaches that incorporate prior knowledge about drugs and targets were proposed to enhance predictive accuracy on well-studied chemicals and targets. Such models may not be best suited to de novo drug discovery. However, they may provide valuable new insights in the context of drug repurposing and understanding the general mechanisms of drug action. The current state-of-the-art work in this context is arguably the DDR model (Olayan et al., 2018), which uses a multi-phase procedure to predict drug targets from relevant heterogeneous graphs. The gist of the approach is to combine various similarity indices and random walk features gained from the input graphs by means of non-linear fusion. Similarly, the NeoDTI model (Wan et al., 2019) predicts DTIs using supporting information about drugs and targets and a non-linear learning model over heterogeneous network data.
Despite continuous advances of similarity based approaches like DDR, these models depended on time-consuming training and prediction procedures as they need to compute the similarity features for each drug and target pair during both training and prediction. Also, the models still have a high false positive rate, especially when using large drug target interaction datasets like DrugBank_FDA (Olayan et al., 2018).
Here, we propose a method utilizing prior knowledge about drugs and targets, similarly to the DDR and NeoDTI model. Our method overcomes the afore-mentioned limitations by approaching the problem as link prediction in knowledge graphs. Knowledge graphs are a data representation model that represents relational information as a graph, where the graph nodes represent entities and edges represent relations between them. Facts are modelled as (subject, predicate, object) (SPO) triples, e.g. (Aspirin, Drug–Target, COX-1), where a subject entity (drug) is connected to an object entity (target protein) through a predicate relation (Drug–Target). In recent years, knowledge graphs have been successfully used for knowledge representation and discovery in many different domains, including life sciences (Dumontier et al., 2014; Lehmann et al., 2014; Muñoz et al., 2019).
Our work utilizes the fact that the current drug target knowledge bases like DrugBank (Wishart et al., 2006) and KEGG (Kanehisa et al., 2017) are largely structured as networks representing information about drugs in relationship with target proteins (or their genes), action pathways and targeted diseases. Such data can naturally be interpreted as a knowledge graph. The task of finding new associations between drugs and their targets can then be formulated as a link prediction problem based on knowledge graph embeddings (Nickel et al., 2016).
We have proposed a new knowledge graph embedding based approach, TriModel, for predicting drug target interactions in a multi-phase procedure. We first used the currently available knowledge bases to generate a knowledge graph of biological entities related to both drugs and targets. We then trained our model to learn efficient vector representations (i.e. embeddings) of drugs and target in the knowledge graph. These representations were then used to score possible drug target pairs using a scalable procedure that has a linear time and space complexity. We compared our method to other state-of-the-art models using experimental evaluation on standard benchmarks. Our results show that the TriModel model outperforms all other approaches in areas under ROC and precision recall curve, metrics that are well suited to assessing general predictive power of ranking models (Davis and Goadrich, 2006).
2 Materials
In this section we discuss the datasets that we used to train and evaluate our model. We present the standard benchmarking datasets: Yamanishi_08 (Yamanishi et al., 2008) and DrugBank_FDA (Wishart et al., 2008), and we present statistics for elements in both datasets. We also discuss some flaws in the Yamanishi_08 dataset, and we present a new KEGG based drug targets dataset that addresses these flaws.
2.1 Standard benchmarks
The Yamanishi_08 (Yamanishi et al., 2008) and DrugBank_FDA (Wishart et al., 2008) datasets represent the most frequently used gold standard datasets in the previous state-of-the-art models for predicting drug targets (Olayan et al., 2018). The DrugBank_FDA (Wishart et al., 2008) dataset consists of a collection of DTIs of FDA approved drugs that are gathered from DrugBank Database (https://www.drugbank.ca). The Yamanishi_08 dataset is a collection of known drug target interactions gathered from different sources like KEGG BRITE (Kanehisa et al., 2006), BRENDA (Schomburg et al., 2004), SuperTarget (Günther et al., 2007) and DrugBank (Wishart et al., 2008). It consists of four groups of drug target interactions corresponding to four different target protein classes: (i) enzymes (E), (ii) ion-channels (IC), (iii) G-protein-coupled receptors (GPCR) and (iv) nuclear receptors (NR). The data in these groups vary in terms of size and positive to negative ratios as shown in Table 1, ranging from 90 known DTIs with 1:15 as in the NR group to 2926 DTIs with 1:100 in the E group. These properties of the datasets affect the effectiveness of both training and evaluating models that use them. For example, the NR DTIs group has the largest positive to negative ratio among all the groups in the Yamanishi_08 dataset and therefore they are the easiest for predictive models in terms of evaluation. Contrary to that, the state-of-the-art models show the worst evaluation results on the NR group compared to other groups. This happens due to the low number of available DTIs training instances, which affects the models’ generalization on the training data.
Statistics of elements in the benchmarking datasets used in this work
| Dataset | Group | Drugs | Proteins | DTIs | Corruptions | P2N |
|---|---|---|---|---|---|---|
| Yamanishi_08 | E | 445 | 664 | 2926 | ≈300K | 1.00% |
| IC | 210 | 204 | 1476 | ≈41K | 3.57% | |
| GPCR | 223 | 95 | 635 | ≈21K | 3.03% | |
| NR | 54 | 26 | 90 | 1314 | 6.67% | |
| All | 791 | 989 | 5127 | ≈777K | 0.66% | |
| DrugBank_FDA | — | 1482 | 1408 | 9881 | ≈2.1M | 0.48% |
| KEGG_MED | — | 4284 | 945 | 12 112 | ≈4M | 0.30% |
Note: The DTIs column represent the number of known drug target interactions, the Corruptions column represent the number of all possible combinations of drugs and targets that are not in the known drug target interactions which is used as negative in model training and evaluation, and the P2N column represents the ratio of positive to negative instances.
2.2 New KEGG based benchmarking dataset
The Yamanishi_8 benchmarking dataset was published in 2008, and it contained drug target interactions from various sources including the KEGG BRITE, BRENDA and SuperTarget databases (Yamanishi et al., 2008). In recent years, these sources have witnessed multiple developments [modifications, deletions, additions of many brand new records to their data (Hecker et al., 2012; Placzek et al., 2017)]. These modification have directly affected the Yamanishi_08 dataset, where a subset of the identifiers of both its drugs and targets has been modified through these developments. This affects the ability to link these drugs and targets to their corresponding properties, e.g. associated pathways, diseases, or other biological entities in the recent versions of biological knowledge bases. These modifications have also included various newly discovered drug target interactions that are not included in the Yamanishi_08 dataset. For example, the KEGG database alone contains 12 112 drug target interactions, while the total number of drug target interactions in the Yamanishi_08 dataset is only 5127.
To overcome these limitations, we propose a new drug target interaction benchmarking dataset that depends on recent versions of biological knowledge bases and includes a larger set of drug target interactions than the Yamanishi_08 dataset. We propose KEGG_MED, a dataset which is collected by extracting all the drug target interactions from the KEGG medicus database (https://www.genome.jp/kegg/medicus.html). The KEGG_MED dataset contains 4284 drugs and 945 targets which are connected with 12 112 drug target interactions. Table 1 shows a summary of statistics of the content on the dataset. Later in this paper, we report our results on this new suggested benchmark (in addition to the comparative validation on DrugBank_FDA) so that future approaches can be compared to our model.
2.3 Supporting knowledge graphs
Link prediction with knowledge graph embedding models require data to be modelled in a graph form, where the objective is to predict new links between graph entities. In the case of drug target discovery, we use supporting data from biomedical knowledge bases to generate informative graphs around drug target interactions. We generate a knowledge graph for each dataset to provide descriptive features for both drugs and targets. These knowledge graphs are extracted from different sources like KEGG (Kanehisa et al., 2017), DrugBank (Wishart et al., 2006), InterPro (Mitchell et al., 2019) and UniProt (Consortium, 2017). In our study we use a customized set of knowledge assertions about both drugs and targets. Supplementary Appendix S1 and Supplementary Table S1 contain more information about the relation types present in each knowledge graph, and about their construction. For further information about the construction of such knowledge bases we refer to the work of Himmelstein et al. (2017) that provides a study of systematic integration of biological knowledge for learning drug–target interactions.
We generate a group-specific knowledge graph of information extracted from KEGG and UniProt for each DTI groups in the Yamanishi_8 dataset, while we use the DrugBank with UniProt knowledge bases to model information about DTIs of the DrugBank_FDA dataset. The information extracted in both cases is modelled as a graph of interconnected biological entities (schema shown in Fig. 1).
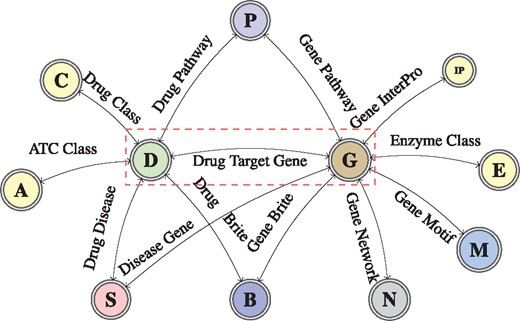
A graph schema for a knowledge graph about drugs, their target genes, pathways, diseases and gene networks extracted from KEGG and UniProt databases
3 Methods
The knowledge graph embedding models we use follow a generative approach to learn low-rank embedding vectors for knowledge entities and relations. For learning the embeddings, multiple techniques can be used, such as tensor factorization [c.f. the DistMult model (Bordes et al., 2013)] or latent distance similarity [c.f. the TransE model (Yang et al., 2015)]. The goal of all these techniques is to model possible interactions between graph embeddings and to provide scores for possible graph links. In the following, we provide details on the knowledge graph embedding procedure and the design of our proposed model, TriModel.
3.1 Knowledge graph embedding
Knowledge graph embedding (KGE) models learn a low rank vector representation of knowledge entities and relations that can be used to rank knowledge assertions according to their factuality. They are trained in a multi-phase procedure. First, a KGE model initializes all embedding vectors using random noise values. It then uses these embeddings to score the set of true and false training facts using a model-dependent scoring function. The output scores are then passed to the training loss function to compute training error. These errors are used by optimizers like AMSGrad (Reddi et al., 2018) to generate gradients and update the initial embeddings, where the updated embeddings give higher scores for true facts and lower scores for false facts. This procedure is performed iteratively for a set of iterations, i.e. epochs in order to reach a state where the learnt embeddings provide best possible scoring for both true and false possible facts.
In the rest of this paper, we use and to denote the set all entities and relations in a knowledge graph respectively, where Ne and Nr represent the number of instances in and respectively. We also use ΘE and ΘR which denote the embeddings of entities and relations respectively, where is the embedding of entity i, is the embedding of relation j, and denotes the score of the fact that a subject entity s is connected to an object entity o with a relation r based on the embedding values Θ of the model m.
3.2 Embeddings representation
TriModel is a knowledge graph embedding model based on tensor factorization that extends the DistMult (Yang et al., 2015) and ComplEx (Trouillon et al., 2016) models. It represents each entity and relation using three embedding vectors such that the embedding of entity i is where all embedding vectors have the same size K (a user-defined embeddings size). Similarly, the embedding of relation j is . em and wm denote the m part of the embeddings of the entity or the relation, and represents the three embeddings parts. The embeddings in the TriModel model are initially with random values generated by the Glorot uniform random generator (Glorot and Bengio, 2010). The embedding vectors are then updated during the training procedure to provide optimized scores for the knowledge graph facts.
3.3 Training procedure
It uses a set of three interactions: one symmetric interaction: () and two asymmetric interactions: () and () for a convenient graphical explanation of the interaction (see Supplementary Fig. S2). This approach models both symmetry and asymmetry in simple form similar to the DistMult (Yang et al., 2015) model where the DisMult model can be seen as a special case of the TriModel model if the first and third embeddings parts are equivalent (). We include more details about the training procedure in Supplementary Appendix S2.
4 Results
In this section we describe the configuration of the data used in the experimentation, the evaluation protocol, the setup of our experiments and the results and findings of our experiments. We also compare the predictive accuracy of our model to selected existing approaches, including the state-of-the-art one.
4.1 Evaluation protocol
In order to facilitate comparison with the state-of-the-art models, we use a 10-fold cross validation (CV) to evaluate our model on the Yamanishi_08 and DrugBank_FDA datasets. First, we split the drug target interaction data into 10 splits i.e. folds. We then evaluate the model 10 times on each split, where the model is trained on the other 9 splits. This procedure is repeated 5 times and average results across these runs are reported. This is to further minimize the impact of data variability on the result stability.
In each training configuration we use the known drug target interactions as positives, and all other possible combinations between the investigated dataset drugs and protein targets as negatives. This yields different positive to negative ratios since the datasets have different number of drugs, targets and drug target interactions (see Table 1 for exact statistics of the ratios for each dataset).
We use the area under the ROC and precision recall curves (AUC-ROC and AUC-PR respectively) as an indication of the predictive accuracy of our model. We compute both metrics on the testing data (DTIs), where we divide the testing data into three groups: (i) Sp, containing testing drug target interactions where both the drug and the target are involved in known drug target interactions in the training data, (ii) Sd, containing testing drug target interactions which contain drugs that have no known drug target interactions in the training data, (iii) St, containing testing data of targets that has not involved in any known drug target interactions in the training data. The main reason for splitting the data this way was that one of the methods could not be compared with the others on the St, Sp data. The largest Sp group, however, generally exhibits least fluctuations across particular cross-validation runs, and therefore it is arguably most representative in terms of the comparative validation.
4.2 Experimental setup
We use the supporting knowledge graph to perform a grid search to learn the model’s best hyperparameters. In all of our experiments we initialize our model embeddings using the Glorot uniform random generator (Glorot and Bengio, 2010) and we optimize the training loss using the AMSGrad optimizer (Reddi et al., 2018), where the learning rate , embeddings size and batch size . The rest of the grid search hyper parameters are defined as follows: the regularization weight , dropout . The number of training epochs is fixed to 1000. The outcome best parameter for this grid search is included in Supplementary Table S2.
We use Tensorflow framework (GPU) along with Python 3.5 to perform our experiments. All experiments were executed on a Linux machine with processor Intel(R) Core(TM) i70.4790K CPU @ 4.00 GHz, 32 GB RAM, and an nVidia Titan Xp GPU. We include the training runtime of the TriModel model for each cross-validation iteration for all the investigated benchmarks in Supplementary Figure S1.
4.3 Comparison with state-of-the-art models
We evaluate our model on the Yamanishi_08 and DrugBank_FDA datasets, and we compare our results to the following state-of-the-art models: DDR (Olayan et al., 2018), NRLMF (Hao et al., 2017), NRLMF (Liu et al., 2015), KRONRLS-MKL (Nascimento et al., 2016), COSINE (Lim et al., 2016) and BLM-NII (Mei et al., 2013). The comparison is made using the metrics of area-under-the-ROC (AUC-ROC) and precision–recall (AUC-PR) curves.
Figure 2 presents overall results in terms of the AUC-ROC and AUC-PR scores for all compared models. The overall scores are combined across all testing configurations () for each dataset, where each specific score is computed as described in Eq. 3.
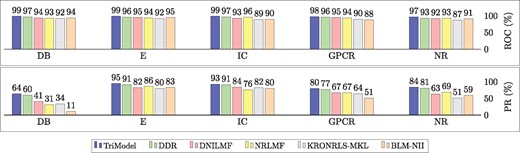
Bar chart for the values of the area under the roc curve (AUC-ROC) and area under the precision recall curve (AUC-PR) for the TriModel compared to other state-of-the-art models on standard benchmarking datasets. All values are rounded to two digits and multiplied by 100 to represent a percentage (%). DB represents the DrugBank_FDA dataset
The results show that the TriModel model outperforms all other models in terms of AUC-ROC and AUC-PR on every benchmarking dataset. The TriModel model achieves a better AUC-PR score with a margin of 4%, 2%, 3%, 3%, 4% on E, IC, GPCR, NR and DrugBank_FDA datasets respectively. It should be noted that we did not include the COSINE method in Figure 2 as it is specifically designed to predict new drugs that do not have DTIs in the training phase. As such, the description of the method only reports accuracy on the new drug configuration (Sd), while the presented combined scores require values of all three evaluation configurations.
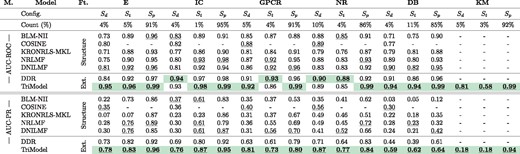
Table 2 shows a detailed comparison of the TriModel model and state-of-the-art models on all the standard benchmarking datasets for the different evaluation settings Sp, Sd and St. It also shows the relative number (in per cent) of drug–target statements available for each of the three validation settings.
A comparison with state-of-the-art models on standard datasets using multiple configurations ()
 |
|
Note: The state-of-the-art results were obtained from (Olayan et al., 2018). The count (%) represents the percentage of the configuration instances, and the DB and KM columns represent DrugBank_FDA and KEGG_MED respectively. All the experimental configurations on all the datasets are evaluated using a 10-fold cross validation which is repeated 5 times. The M. column represents metrics. The Ft. column represents model’s feature type. The structure feature type represents protein and drug structure based features and Ext. denotes extensive prior knowledge features. Underlined scores represent the best scores in their feature category while the overall best results are in bold and highlighted with green colour. (Color version of this table is available at Bioinformatics online.)
A comparison with state-of-the-art models on standard datasets using multiple configurations ()
|
|
Note: The state-of-the-art results were obtained from (Olayan et al., 2018). The count (%) represents the percentage of the configuration instances, and the DB and KM columns represent DrugBank_FDA and KEGG_MED respectively. All the experimental configurations on all the datasets are evaluated using a 10-fold cross validation which is repeated 5 times. The M. column represents metrics. The Ft. column represents model’s feature type. The structure feature type represents protein and drug structure based features and Ext. denotes extensive prior knowledge features. Underlined scores represent the best scores in their feature category while the overall best results are in bold and highlighted with green colour. (Color version of this table is available at Bioinformatics online.)
The results in Table 2 show that the TriModel model outperforms other state-of-the-art models on 13 out of 15 different AUC-ROC experimentation configurations. In case of AU-PR, our model is better 14 out of 15 configurations. The results also show that the experimental configurations where our model is not the best represent a small portion of the total number of DTIs, while the TriModel model provides consistently better results for the largest Sp partition of the validation data.
Table 2 also show the results of the TriModel model on our proposed KEGG_MEDD dataset, where the model’s AUC-PR scores are 0.18, 0.18 and 0.94 and its AUC-ROC scores are 0.81, 0.58 and 0.99 on the configurations Sd, St and Sp respectively. No comparison with existing tools has been performed as their published versions cannot be directly applied to this dataset.
4.4 Limitations
Despite the very promising results achieved by the prior knowledge-based models like DDR and TriModel, their predictive capabilities are best suited to finding new associations between well-studied drugs and targets (useful for instance in the drug repurposing context). If one needs predictions for de novo drug discovery, the models that utilize drug structure and target sequence similarities (e.g. BLM-NII, COSINE, KRONRLS-MKL, NRLMF or NRLMF) will likely deliver better results.
4.5 Web application for exploring the TriModel predictions
To let users explore our results, we have designed a web application (Hosted at: http://drugtargets.insight-centre.org). The application allows for searching the predictions of the TriModel model. One can look for predictions using either drugs or targets as queries. Queries concerning multiple entities are possible simply by appending new terms to the search query. The results are presented as a table of the TriModel model scores of all the possible drug–target associations of the searched term.
The predictions provided by the web application are learnt by training the TriModel model on all the Yamanishi_08 dataset. The prediction scores are then computed for all possible drug–target combinations induced by the dataset. The scores of known drug interactions in the Yamanishi_08 dataset are set to 1, while the scores of all other drug target interactions are the normalized outcome of the TriModel predictions. The table of predictions in the application indicates the origin of each score, where a unique label ‘Experimental Evidence’ is given to known DTIs and another label ‘Model Prediction’ is assigned to the predicted scores.
5 Discussion
In the following we discuss possible reasons for the improved performance of our approach when compared to existing methods. We also review the limitations of the current DTI prediction benchmarks and discuss impact of data stratification on the predictive power of the models. Last but not least, we present tentative results in expert-based validation of predictions of our model that are not covered by the benchmark datasets. These results show high promise in terms of actual new discoveries predicted by our model.
5.1 Distinctive features of the presented approach
The relative success of the TriModel model can be attributed to two distinctive features not present in the state-of-the-art models. Firstly, we model input for the training as knowledge graphs. This allows for encoding multiple types of associations within the same graph and thus utilizing more complex patterns. Other models that use graph-based data are limited in this respect as they only employ networks with single relation type. Secondly, the TriModel model uses a generative approach to learn efficient representations for both drugs and their targets. This approach enables scalable predictions of large volumes of drug–target interactions as it uses linear training time (Nickel et al., 2016) and constant prediction time, which is not the case of the existing works. Furthermore, the TriModel model is able to predict other biological associations within the training data (e.g. drug and target pathways) with no extra computational effort. This shows substantial promise for further development of this technique.
5.2 Impact of data stratification on the predictive power
The Yamanishi_08 dataset is divided into four groups of DTIs according to the functionality of the target proteins. The groups are enzymes (E), ion-channels (IC) G-protein-coupled receptors (GPCR) and nuclear receptors (NR). The objective of this categorization is to distinguish between models specifically tailored to predicting targets associated with a particular drug class (Yamanishi et al., 2008). Olayan et al. (2018) confirmed that organizing the drug target interactions into groups according to the target’s biological functionality enhances the predictive accuracy of models trained on such stratified data.
Based on our observations, we suggest a different explanation. The differences in performance appear to correlate with the relative numbers of negative examples in the grouped and full dataset configuration. Table 1 shows that the full Yamanishi_08 dataset configuration has a 0.66% positive to negative ratio, while the groups E, IC, GCPR and NR have 1, 3.57, 3.03 and 6.67% respectively. These differences can explain the variability of model performance quite well, since predicting positive instances is generally harder with more negatives present in the data (Liu et al., 2007). In addition, dividing the DTI information gives rise to groups like the GPCR and NR groups. These contain only a small number of true DTIs (635 and 90 DTIs respectively), which further hampers the ability of models to generalize well (as we show in Section 2).
5.3 Validating the discovery potential of TriModel
Good performance of a model in benchmark tests is no doubt important. For various reasons like overfitting or training data imbalances, however, good benchmark results may not necessarily mean that the model can effectively support new discoveries.
Laboratory validation can ultimately confirm the model predictions as actual discoveries, but this is costly and time-consuming to be done at large scale. One can, however, perform alternative validations of the predictions using data that was not used for training the model. Such complementary validation can provide stronger foundations for claiming a model has high generalization power.
We have performed a complementary validation of the TriModel’s predictions by manual analysis of top-10 drug–target associations per each of the examined benchmarking datasets. To decide whether or not the associations are true positives, we reviewed available literature. We only validated the predictions that were not part of the training data. The validation outcome shows that the TriModel model achieves 7 out of 10, 7 out of 10, 8 out of 10, 7 out of 10 and 6 out of 10 true predictions on the E, IC, GPCR, NR, DB datasets respectively. A detailed version of the validated predictions is included in Supplementary Table S3.
One can easily see that our model puts actual drug–target introductions (some of which were only recently discovered) high up in the result list. This is very promising for further development of the model and its deployment in clinical application scenarios.
6 Conclusions and future work
In this work, we have approached the problem of predicting new drug targets as a link prediction task in biomedical knowledge graphs. We have presented the TriModel model, a knowledge graph embedding model that can efficiently predict new drug target interactions. We have generated knowledge graphs of biological entities related to drugs and targets using available biological knowledge bases like KEGG, UniProt and DrugBank. We have then used these knowledge graphs to train the TriModel model to learn efficient vector representation for both drugs and targets. In experiments using a standard benchmark data, we have demonstrated that the TriModel model outperforms state-of-the-art models in terms of both the area under ROC and precision recall curves.
Our study has also led to several secondary findings and contributions. We have shown that dividing datasets of drug target interactions into groups based on target properties does not positively affect the predictive accuracy of computation models. It can result in groups with very few drug target interactions, which negatively affects the accuracy of learnt models. Last but not least, we have developed a new KEGG based drug target interactions dataset that tackles the issues in the Yamanishi_08 dataset, and provides a richer set of up-to-date drug target interactions.
In future, we intend to explore how incorporation of more context data relevant to the target prediction problem can further improve the accuracy of our model. Last but not least, we will validate selected predictions of our model in laboratory experiments to demonstrate the clinical relevance of our results.
Funding
This publication has emanated from research supported in part by a research grant from Science Foundation Ireland (SFI) under Grant Number SFI/12/RC/2289, co-funded by the European Regional Development Fund.
Conflict of Interest: none declared.
References

