


Abstract
Visualization of multiple genomic data generally requires the use of public or commercially hosted browsers. Flexible visualization of chromatin interaction data as genomic features and network components offer informative insights to gene expression. An open source application for visualizing HiC and chromatin conformation-based data as 2D-arcs accompanied by interactive network analyses is valuable.
DNA Rchitect is a new tool created to visualize HiC and chromatin conformation-based contacts at high (Kb) and low (Mb) genomic resolutions. The user can upload their pre-filtered HiC experiment in bedpe format to the DNA Rchitect web app that we have hosted or to a version they themselves have deployed. Using DNA Rchitect, the uploaded data allows the user to visualize different interactions of their sample, perform simple network analyses, while also offering visualization of other genomic data types. The user can then download their results for additional network functionality offered in network based programs such as Cytoscape.
DNA Rchitect is freely available both as a web application written primarily in R available at http://shiny.immgen.org/DNARchitect/ and as an open source released under an MIT license at: https://github.com/alosdiallo/DNA_Rchitect.
1 Introduction
The visualization and navigation of genomic data is possible through the use of publicly available genomic browsers including UCSC Genome Browser, WashU Epigenome and Integrative Genomics Viewer (IGV) (Kent et al., 2002; Robinson et al., 2011; Zhou et al., 2011). These public genome browsers allow for the visualization of genomic data types including gene expression (Wang et al., 2009) and epigenetic assays (Furey, 2012; Tsompana and Buck, 2014). Genomic data types that map chromatin interactions: HiC (Lieberman-Aiden et al., 2009), HiChIP (Mumbach et al., 2016) and ChIA-PET (Li et al., 2010) are currently supported publicly on the WashU Epigenome Browser (Zhou et al., 2011). While the visualization of chromatin interaction data are usually represented using chromatin contact heatmaps like Juicebox (Durand et al., 2016) or HiGlass (Kerpedjiev et al., 2018), a minority of tools represent these chromatin interactions as 2D-arcs (Phanstiel et al., 2014; Yardimci and Noble, 2017). Moreover, fewer tools to date (Thibodeau et al., 2016) offer the ability to readily explore and visualize chromatin interactions. Network analyses such as hub or community detection on chromatin interaction data have been useful in parsing higher-order chromatin structure that distinguishes cell-specific gene regulatory programs between cell-types (Sandhu et al., 2012). DNA Rchitect provides a tool for the user to interactively explore 3C-based technologies with network analysis components that also offers additional visualization for data such as ATAC-seq and ChIP-seq.
2 Materials and methods
We have developed a web application named ‘DNA Rchitect’ that implements the R packages Sushi (Phanstiel et al., 2014) and Shiny (Winston et al., 2018) to allow users to interactively visualize genomic data in a web browser. The web application is user-friendly and designed for non-bioinformaticians to easily visualize and browse their own, pre-filtered bed, bedgraph and bedpe datasets. To visualize HiC data, the web app implements Sushi (Phanstiel et al., 2014) to generate a plot of arcs as well as both igraph (Csardi and Nepusz, 2006) and visNetwork (Almende et al., 2019) to generate a network diagram and perform network analyses. DNA Rchitect accepts comma, semicolon, tab delimited, csv, or bg file formats. Users may deploy DNA Rchitect through a web browser provided via the link or in their own environment; the latter is likely the best option for users with very large datasets. This allows researchers to choose the option which best meets their needs. DNA Rchitect is most useful in the visualization of high-confidence contacts (pre-filtered or reproducible across replicates) and smaller range of interactions (10–20 kb resolution) across several chromatin conformation capture-based assays.
DNA Rchitect has an interactive plotting interface that permits the user to browse and visualize their data by gene name or specific genomic coordinates (refer to Fig. 1). The web version of DNA Rchitect hosts sample data as examples. For HiC datasets, the user must specify the number, identification of samples and selection of color(s) for each sample in the uploaded file in order to render the arc plot (bezier curves). The network analysis component of DNA Rchitect includes the ability to interactively view the entire genomic network as well as diagram network hubs, plots on degree distribution, community detection and node degree. Nodes and edges can be selected and moved using the ‘Genomic Network’ tab. DNA Rchitect is agnostic to features of HiC which include distance decay or compartmentalization. We advise users to filter or tune HiC contacts based on such features, which may impact interpretation of network analyses. All plots and diagrams generated through the web app may be downloaded from the web browser as a PDF, SVG, PNG, HTML or XGMML file. In addition, the XGMML download can serve as a bridge for additional network functionality currently supported in network based programs such as Cytoscape (Shannon et al., 2003). The code for this DNA Rchitect is open-source, and available under the MIT license. To streamline the user interaction with DNA Rchitect, the ‘Help’ tab can be a useful reference before you upload data in addition to the ‘Interactive tutorial’ which provides step-by-step guidance on the use of DNA Rchitect.
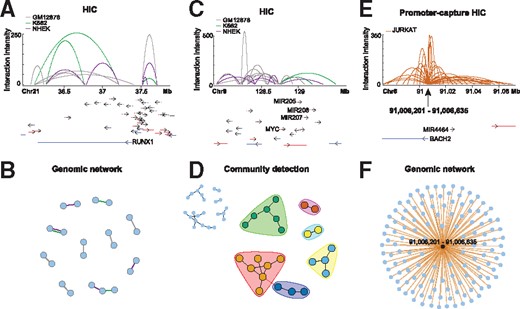
DNA Rchitect provides a genomic view and network analyses of chromatin interaction data. (A) DNA Rchitect arc plot showing HiC data for K562, NHEK and GM12878 human cells in the RUNXI gene locus. (B) Genomic network of HiC contacts in (A), where each edge is colored based on HiC sample type. (C) Arc plot for the MYC locus demonstrating complex chromatin architecture across the three cell types, which can be parsed into communities (D). Communities detected from the network analysis are colored as community groups while the inset shows the genomic network. (E) Promoter-capture HiC contacts and (F) respective genomic network for the human Jurkat cell line demonstrating high-resolution (10–20 Kb) cis-regulatory interactions with the BACH2 promoter
3 Usage scenario
We demonstrate the ability to rapidly and easily browse multiple genomic datasets using DNA Rchitect, which extends for data types in human, mouse and Drosophila Melanogaster. Additionally, local use of DNA Rchitect can be configured to visualize genomic data from any species. DNA Rchitect can be useful in the visualization of pre-defined and high confidence chromatin contacts from either HiC or other chromatin conformation data types (promoter-capture or HiChIP), through the representation of 2D-arcs genome-wide, at gene-level resolutions (Bonev and Cavalli, 2016; Li et al., 2014).
To demonstrate some niche applications of DNA Rchitect, we provide sample data from the following experiments: human HiC (Rao et al., 2014; Sanborn et al., 2015) and promoter-capture HiC (Martin et al., 2015, 2016). Using DNA Rchitect, we can visualize HiC loops from three cell types: K562, NHEK and GM12878. We demonstrate the power of DNA Rchitect in readily identifying cell-specific HiC contacts in the locus of the hematopoietic regulator RUNX1 (Fig. 1A and B). Here, we demonstrate multiple HiC arcs with maximum intensity specific to the myelogenous leukemia cell line K562, which span the RUNX1 locus, and is an integral regulator for maintaining the survival of malignant and leukemia cell types (Bonev and Cavalli, 2016; Li et al., 2014; Sood et al., 2017). This observation may follow proposed models for controlling gene expression through TAD insulation-based structure (Rowley and Corces, 2018) and/or the cis-regulatory interactions (Stadhouders et al., 2019) required for maintaining controlled expression of RUNX1 in K562 cells. Additionally, previous work with ChIA-PET data (IP-based 3C-technology) was successful in elucidating evolutionarily conserved lncRNA network hubs and enhancer-like functions (Thiel et al., 2019) using network analysis based approaches.
Extending our search of HiC contacts to the oncogene MYC (expressed in these same three cell lines), we observe that HiC contacts in this locus exhibit a more complex chromatin architecture (Fig. 1C) than observed for the RUNX1 locus. DNA Rchitect network analysis of this locus can parse chromatin interactions into HiC-based detected communities (Fig. 1D). Additionally, we observe increased K562 HiC contact intensity downstream of MYC with a cluster of miRNA genes, while the upstream HiC contacts are dominant in both GM12878 and NHEK cell-types (Fig. 1C). Furthermore, our results also complement previous experimental observations in identifying complex organization of chromatin interactions for the MYC locus among different cancer cell types (Schuijers et al., 2018). Along with experimentation, DNA Rchitect may be utilized as a way to interactively navigate and identify chromatin interactions for other exemplary loci that would otherwise be difficult to visualize.
In another example, we use the human Jurkat T cell line to observe magnified high-resolution chromatin architecture using the promoter-capture HiC data provided in DNA Rchitect. Focusing on the transcriptional regulator BACH2, we can observe several contacts emanating from the BACH2 promoter to nearby cis-regulatory elements (Fig. 1E and F). As represented, DNA Rchitect enables users to visualize high-resolution chromatin interactions (Fig. 1E), with several high-intensity contacts occurring less than 20 kilobases from the promoter. The examples we selected were to provide vignettes of 3C-technology data to illustrate three biological observations: cell-specificity, complexity of chromatin contacts and promoter-centered chromatin interactions. Figure 1B and D, detail chromatin contacts from three different cell types: B (GM12878), myeloid leukemia (K562) and keratinocytes (NHEK). Panel 1B illustrates the cell-specific chromatin structure for a gene whose expression is highest in the cell type (K562), and supported by an orthogonal data type (HiC). Panel 1D provides the complex nature of the chromatin architecture, even for a gene locus, where the gene (MYC) is expressed in all three cell–types. Lastly, 1F provides a promoter-centered view of the possible cis-regulatory configurations present for a single gene promoter, supporting the notion that gene regulatory control is often complex.
All network information generated from DNA Rchitect can be downloaded to network based programs such as Cytoscape. Additional network analyses, including network hub detection, network statistics and other metrics are detailed in our ‘Help’ page (in addition to what is in Fig. 1) whereas, additional examples for the visualization of ATAC-seq and ChIP-seq data types are covered in our DNA Rchitect tutorial. Our investigation of HiC data from human cell lines and promoter-capture HiC with DNA Rchitect resolve the cell-specific and gene-centric chromatin architectures across high (several Kb) and low (>1 Mb) genomic resolutions. While bulk HiC reflects an ensemble measurement of chromatin contacts, we envision the utility and power of DNA Rchitect to resolve chromatin networks from individual single-cell HiC data (Nagano et al., 2013). Furthermore, DNA Rchitect can also accommodate other genomic data types that are in bed, bedpe and bedgraph formats (i.e. DNA methylation). DNA Rchitect provides a valuable option for biologists who want to quickly visualize and analyze their data without the need to configure a server.
Acknowledgements
We thank Dr Christophe Benoist, Catherine Laplace and Jiaoyuan Elisabeth Sun for providing feedback and support on DNA Rchitect. We thank the Immunological Genome Project (ImmGen) Consortium.
Funding
This work was supported by a resource grant from the National Institute of Allergy and Infectious Diseases to the ImmGen Consortium [AI072073, AI116834-03S1 to R.R.].
Conflict of Interest: none declared.
References
Author notes
The authors wish it to be known that, in their opinion, R. N. Ramirez and K. Bedirian authors should be regarded as Joint First Authors.

