


Abstract
Deoxyribonucleic acid (DNA) methylation plays a crucial role in human health. Studies have demonstrated associations between DNA methylation and environmental factors with evidence also supporting the idea that DNA methylation may modify the risk of environmental factors on health outcomes. However, due to high dimensionality and low study power, current studies usually focus on finding differential methylation on health outcomes at CpG level or gene level combining multiple CpGs and/or finding environmental effects on health outcomes but ignoring their interactions on health outcomes. Here we introduce the idea of a pseudo-data matrix constructed with cross-product terms between CpGs and environmental factors that are able to capture their interactions. We then develop a powerful and flexible weighted distance-based method with the pseudo-data matrix where association strength was used as weights on CpGs, environmental factors and their interactions to up-weight signals and down-weight noises in distance calculations.
We compared the power of this novel approach and several comparison methods in simulated datasets and the Mothers and Newborns birth cohort of the Columbia Center for Children’s Environmental Health to determine whether prenatal polycyclic aromatic hydrocarbons interacts with DNA methylation in association with Attention Deficit Hyperactivity Disorder and Mental Development Index at age 3.
An R code for the proposed method together with a tutorial and a sample dataset is available for downloading from http://www.columbia.edu/∼sw2206/softwares.htm.
Supplementary data are available at Bioinformatics online.
1 Introduction
Deoxyribonucleic acid (DNA) methylation has been associated with cancers (Das and Singal, 2004; Ehrlich, 2002; Esteller and Herman, 2002; Kulis and Esteller, 2010) and a wide range of human diseases (Feinberg, 2007; Jager et al., 2014; Mill and Petronis, 2007, 2008; Mill et al., 2008; Nestler, 2014; Schanen, 2006). Studies have also demonstrated associations between DNA methylation and environmental factors (Bakulski et al., 2015; Cardenas et al., 2017; Faulk et al., 2015; Herbstman et al., 2012; Janssen et al., 2013; Nahar et al., 2015; Nye et al., 2016; Perera et al., 2009; Saenen et al., 2017; Sen et al., 2015) such as prenatal exposure to polycyclic aromatic hydrocarbons (PAH) (Herbstman et al., 2012; Perera et al., 2009), Bisphenol A (Faulk et al., 2015; Nahar et al., 2015). In addition, there is evidence supporting the idea that DNA methylation may modify the risk of environmental factors on health outcomes. For example, Fu et al. (2012) found that DNA methylation modifies the effect of NO2 on the progression from mild to severe asthma; White et al. (2015) found that DNA methylation modifies the risk of PAH–DNA adducts on breast cancer. Despite these findings, due to high dimensionality and low study power, current studies usually focus on finding differential methylation on health outcomes at CpG level or gene level combining multiple CpGs and/or finding environmental effects on health outcomes but ignoring their interactions.
Here, we developed a weighted epigenetic distance-based method with a pseudo-data matrix constructed with cross-product terms between DNA methylation and environmental factors that are able to capture their interactions on health outcomes. The distances between pairs of subjects can then be calculated combining the original data matrix with DNA methylation measures and environmental factors together with the pseudo-data matrix with interactions. Using this approach, we can identify both main and interaction effects. We focused on interactions between DNA methylation of CpGs in a gene and an environmental factor on health outcomes, but the proposed method can be readily adapted to interactions among CpGs in a gene on health outcomes. We conducted simulation studies and showed that, when there are both main and interaction effects between DNA methylation and environmental factors, the proposed novel approach that incorporates interactions through a pseudo-data matrix has much better power than comparison methods that consider either main effects or interaction effects. Most importantly, the power of the proposed method is not affected by the source of the signals, i.e. if the signals are main or interaction effects. This makes this approach very attractive due to the known low power of interaction detection.
We applied the proposed method to the data from the Mothers and Newborns (MN) birth cohort of the Columbia Center for Children’s Environmental Health (CCCEH) to identify effects of gene-level DNA methylation, prenatal PAH and their interactions on Attention Deficit Hyperactivity Disorder (ADHD) at age 3. We identified some main effects of DNA methylation and some interactions with prenatal PAH which were missed by comparison methods. Some of these findings were further replicated in the CCCEH Sibling cohort. We similarly applied the proposed method to the Mental Development Index (MDI) at age 3 and observed a similar pattern in results in both discovery and replication analyses.
2 Materials and methods
2.1 The proposed method
The proposed weighted distance-based method incorporating DNA methylation by environment interactions has three steps: (1) introducing a pseudo-data matrix constructed with cross-product terms between DNA methylation of CpGs in a gene and environmental factors that captures their interactions, on which a gene-level weighted distance matrix incorporating interactions is defined; (2) calculating the pseudo-F statistic; and (3) assessing the statistical significance empirically using permutations. We focus on binary outcomes and illustrate the method at the gene-level while it can be readily adapted to other types of outcomes and to genetic region or pathway-level.
Step 1: a pseudo-data matrix and a weighted distance matrix incorporating interactions
Here we focus on binary outcomes with equal number of cases and controls and consider one gene with n CpGs. Denote as a matrix with DNA methylation measures for N cases (Y = 1) and N controls (Y = 0) of n CpGs. Denote E as a vector with measures of an environment factor. Define , a matrix for main signals of n CpGs and one environmental factor. We normalize each column of to have mean zero and unit standard deviation (SD). The element harbors the normalized methylation measure of CpG j for subject i, , and normalized environmental factor Ei of subject i, . We then define , a pseudo-data matrix with element harbors the interaction between CpG j and the environmental factor of subject i, and . By using , a pseudo-data matrix, we capture main signals of n CpGs, one environmental factor and n pairwise CpG × E interactions. Here, the proposed method that tests the null hypothesis that there is no joint effect of methylation, the environmental factor and their interactions on the outcome. The proposed method is very flexible and can be easily adapted to test other hypotheses based on different pseudo-data matrices. Specifically, we are able to test (i) the association between methylation and the outcome by constructing the distance matrix based on the pseudo-data matrix , (ii) the association between interactions and the outcome based on , (iii) the association between the environmental factor and the outcome based on , (iv) the joint effect of methylation and the environmental factor based on and (v) the joint effect of methylation and interaction based on .
Step 2: the pseudo-F statistic
Step 3: the statistical significance
In the real data applications, we have G = 18 633 genes, which helps to have high-resolution gene-level empirical P-values.
To investigate if genes with different sizes, i.e. number of CpGs, will have different distributions for pseudo-F statistics under the null hypothesis, we conducted simulation studies to compare the Type I error rates when the P-value for each gene is calculated based on pooled pseudo-F statistics of all G genes across all permutations (Supplementary Section 1.1 and Table S1).
2.2 Comparison methods
We compare the performance of the proposed method that considers both main (M and E) and interaction signals with weights to that of several comparison methods, including the weighted distance-based methods considering (i) methylation signals only , (ii) interaction signals only , (iii) the distance-based methods without weights considering both main (M and E) and interaction signals , (iv) methylation signals only , (v) interaction signals only and (vi) the site-level EWAS methods via logistic regressions on each CpG considering methylation signals only LS or (vii) both main (M and E) and interaction signals LM. For LS, a simple logistic model is fitted for each CpG in the gene one by one and a significant methylation effect of the gene is claimed if any simple logistic model is significant after Bonferroni adjustment for testing the number of CpGs in the gene. For LM, a multiple logistic model with one CpG, the environmental factor and their interaction is fitted for each CpG in a gene, and the gene is considered significant if any multiple logistic model is significant after Bonferroni adjustment for the number of CpGs in the gene.
Note that we can also consider and models, which we included in Supplementary Materials to show the flexibility of the proposed method.
3 Simulation studies
We conducted simulation studies to evaluate Type I error and power of the proposed method and the comparison methods where we only considered one gene with multiple CpGs for illustration purpose. Type I error is defined as the proportion of simulations the gene is significant when the data are generated under the null hypothesis of no association. Power is defined as the proportion of simulations the gene is significant when the data are generated with a gene with multiple CpGs of different types of signals. We conducted 1000 simulations in each simulation setting.
3.1 Simulation setup
In each simulation, we set , for n CpGs, where −0.47 and 3.56 are the mean and SD of DNA methylation means of all CpGs with gene information from the 432 samples in the CCCEH MN cohort. We set , where 0.62 and 0.21 are the mean and SD of methylation SDs. We generated 100 cases and 100 controls. We set all β’s to be 0 to evaluate Type I error rates and considered multiple scenarios when signal CpGs have main signals only, interaction signals only and both main and interaction signals to evaluate power with null CpGs having β = 0.
3.1.1 Simulation settings with different types of signals
We set a gene with 30 CpGs with 1∼4 CpGs having (i) methylation main signals only, (ii) interaction signals only and (iii) both methylation main and interaction signals. Detailed simulation setups are in Table 1.
Simulation settings with different types of signals
| Scenario | Number of signal itemsa | Simulation setupb,c |
|---|---|---|
| Main signals only | 1 signal CpG | |
| 2 signal CpGs | ||
| 3 signal CpGs | ||
| 4 signal CpGs | ||
| Interaction signals only | 1 signal CpG | |
| 2 signal CpGs | ||
| 3 signal CpGs | ||
| 4 signal CpGs | ||
| Both main and interaction signals with fixed number of signal CpGs | 3 signal CpGs with interaction signals | |
| 1 signal CpG with main signals | ||
| (main-to-interaction signal ratio = 1:3) | ||
| 2 signal CpGs with interaction signals | ||
| 2 signal CpGs with main signals | ||
| (main-to-interaction signal ratio = 2:2) | ||
| 1 signal CpG with interaction signals | ||
| 3 signal CpGs with main signals | ||
| (main-to-interaction signal ratio = 3:1) |
A signal item represents a methylation signal in the data matrix no matter it is a main signal or an interaction signal.
X represents DNA methylation main effects, Z represents DNA methylation by environment interaction effects.
In each model, we also set .
3.1.2 Simulation settings with fixed number of signal items from different number of signal CpGs
A signal item represents a methylation signal in the data matrix regardless it is a main/interaction signal. Because we consider interaction signals as another type of signal compared to main signals, we investigated power when the same signal composition is from different number of signal CpGs. Detailed simulation setups are in Supplementary Table S2.
3.2 Simulation results
3.2.1 Type I error rate
Type I error rates are well controlled at the 0.05 significance level in all simulation settings for all methods (Table 2).
Type I error rates
| Methods | 20 CpGsa | 30 CpGs | 40 CpGs |
|---|---|---|---|
| 0.037 | 0.051 | 0.055 | |
| 0.051 | 0.053 | 0.052 | |
| 0.044 | 0.045 | 0.047 | |
| 0.048 | 0.048 | 0.045 | |
| 0.036 | 0.053 | 0.047 | |
| 0.047 | 0.048 | 0.049 | |
| LS | 0.036 | 0.041 | 0.029 |
| LM | 0.037 | 0.039 | 0.035 |
| Methods | 20 CpGsa | 30 CpGs | 40 CpGs |
|---|---|---|---|
| 0.037 | 0.051 | 0.055 | |
| 0.051 | 0.053 | 0.052 | |
| 0.044 | 0.045 | 0.047 | |
| 0.048 | 0.048 | 0.045 | |
| 0.036 | 0.053 | 0.047 | |
| 0.047 | 0.048 | 0.049 | |
| LS | 0.036 | 0.041 | 0.029 |
| LM | 0.037 | 0.039 | 0.035 |
Number of CpGs in a gene.
3.2.2 Simulation settings with different types of signals
As summarized in Figure 1, when there are only main signals, and that only consider interaction signals have no power, as expected. is slightly less powerful than and similar to LS. This is because the overall main signals are diluted by the inclusion of pseudo-data for interactions when there are no interaction signals. performs similarly as LM, while both of them perform inferior to with weights. In general, the weighted versions and outperform the corresponding non-weighted versions, suggesting that incorporating association strength weights in calculating distances indeed helps up-weight signals and down-weight noises thus improves the overall power.
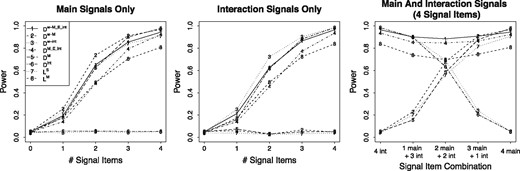
Power results for simulation settings with methylation signals only, interaction signals only and both methylation and interaction signals when there are 30 CpGs in a gene
When there are only interaction signals, and LS that only consider main signals have no power, as expected. is slightly less powerful than when both of them outperform the corresponding non-weighted versions. performs similarly as LM.
When there are both main and interaction signals, we fixed the number of signal items and the number of signal CpGs to be 4 but varying the main-to-interaction signal ratio, i.e. the ratio between the number of main signal CpGs and the number of interaction signal CpGs. As the main-to-interaction signal ratio increases, the power of and LS that only consider main signals increases, while that of and that only consider interaction signals decreases, and that of and LM that consider both main and interaction signals remains the same. Importantly, consistently has the largest power, which implies that the performance of is not affected by signal types. Again, the weighted versions outperform the non-weighted versions.
The power of other possible comparison methods as well as those of the simulation with 20 or 40 CpGs in a gene was summarized in Supplementary Figure S1. We found that when we fix the number of signal CpGs but increase the number of noise CpGs in a gene, power of non-weighted methods decreases, while power of weighted versions is well maintained. This suggests that adding weights is effective, especially when a smaller percent of CpGs in a gene are signals. This is consistent with that was observed in our previous work (Wang et al., 2019).
3.2.3 Simulation settings with fixed number of signal items from different number of signal CpGs
Power results for simulation settings with fixed number of signal items from different number of signal CpGs are summarized in Supplementary Material Section 1.3 and Figure S2. Overall, the power of distance-based methods increases as the number of signal CpGs increases.
4 Real data applications
4.1 CCCEH birth cohorts
Between 1998 and 2006, 727 pregnant women residing in Washington Heights, Harlem and the South Bronx were recruited in prenatal clinics to participate in the CCCEH MN prospective cohort study. During the third trimester of pregnancy, women were asked to wear a small backpack containing a personal monitor during the daytime for 48 h. The collected samples were then analyzed for eight carcinogenic PAHs (Perera et al., 2003). The PAH metric used in the analysis is the sum of eight carcinogenic PAHs and was dichotomized at the median in the parent population (2.26 ng/m3). In-person postnatal questionnaires were given when the child was 6 months and annually thereafter with developmental questionnaires and assessments were administered every 1–2 years. We have also measured DNA methylation in the white blood cells of umbilical cord blood.
Beginning in March 2008, pregnant women enrolled in the CCCEH MN Study were invited to participate in the CCCEH Sibling Study. Similar to the parent study, women were enrolled if they had a prenatal visit by the 20th week of pregnancy, and were not active smokers or illicit drug users. The same protocol was followed as in the MN cohort. Children were followed until age 7, with assessments of early childhood developmental and behavioral outcomes and cord blood DNA methylation.
4.2 Neurodevelopment outcomes
We investigated the associations between prenatal PAH and DNA methylation on neurodevelopmental outcomes when their interactions are considered. We assessed two neurodevelopment outcomes at age of 3: (i) Child Behavior Checklist DSM-IV-oriented ADHD (American Psychiatric Association, 2013) and (ii) the Bayley Scales of Infant Development MDI (Bayley, 1993).
Since ADHD diagnosis at age 3 may not be clinically reliable and the main purpose is to demonstrate the superior performance of the proposed method over comparison methods, we dichotomized ADHD at T-score of 50 (high ADHD group T-score >50 and low with T-score ≤50), which is the median of the normed population derived from the raw scores (Achenbach and Rescorla, 2000). Note that a T-score of 50 was assigned to those with raw scores below the population median, i.e. no differentiation for those below the population median, while a percentile-type T-score was assigned to those above the population median. We performed the discovery analysis using the MN cohort and the replication analysis using the Sibling cohort.
For the MDI outcome, children are dichotomized as normal (MDI ≥ 85) or moderately to severely delayed (MDI < 85) (Perera et al., 2006). Since there is only one case of moderately to severely delayed child in the Sibling cohort, to conduct discovery and replication analyses, we randomly split the MN cohort using 2/3 samples for the discovery analysis and 1/3 for the replication analysis.
4.3 DNA methylation data processing
We conducted standard data processing steps for DNA methylation with details in Supplementary Material Section 2.1.
4.4 Risk of PAH, DNA methylation and their interactions on ADHD
There are 328 samples with complete data of DNA methylation, prenatal PAH and ADHD in the discovery MN cohort, and 43 samples with complete data in the replication Sibling cohort.
4.4.1 Discovery analysis in the MN cohort
Since the main purpose is to demonstrate the power of the proposed method over comparison methods, instead of using the Bonferroni adjustment for 18 633 genes, we used a subjective threshold of 0.005 on the empirical gene-level P-values obtained from the permutation procedure. At the 0.005 threshold, identified 17 genes in the discovery analysis, with 11 due to main signals only and 6 due to interaction signals only (Table 3).
Application examining prenatal PAH, DNA methylation and their interactions on child ADHD at age 3 identified 17 genes by the proposed method at the 0.005 gene-level P-value threshold
| Rank in | Gene | # CpG | Rank in | Rank in |
|---|---|---|---|---|
| 1 | LOC84931 a | 9 | 1 | 1513 |
| 2 | SERPINB3 | 1 | 2 | 18 316 |
| 3 | CYP2E1 a | 13 | 6013 | 1 |
| 4 | KIR3DP1 | 1 | 18 535 | 3 |
| 5 | MIR518E | 1 | 13 908 | 2 |
| 6 | KRTAP20-1 | 1 | 8 | 18 472 |
| 7 | IGJ | 1 | 4 | 18 286 |
| 8 | ADAM32 | 11 | 5 | 15 841 |
| 9 | OR8G1 | 1 | 17 560 | 8 |
| 10 | CXCL9 | 1 | 9 | 16 665 |
| 11 | HIST1H2BJ a | 4 | 3 | 14 178 |
| 12 | SPACA1 | 6 | 17 | 17 866 |
| 13 | LYRM1 | 3 | 22 | 12 866 |
| 14 | WASH2P a | 1 | 15 711 | 9 |
| 15 | MAS1 | 2 | 4067 | 5 |
| 16 | BICD1 | 14 | 10 | 3485 |
| 17 | NDUFA5 | 9 | 7 | 9318 |
Genes replicated in the replication analysis.
4.4.2 Replication analysis in the Sibling cohort
Due to the small sample size of the Sibling cohort, we used a gene-level P-value threshold of 0.1 in the replication analysis. Among the 17 genes identified in the discovery MN cohort, 4 (LOC84931, CYP2E1, HIST1H2BJ and WASH2P) were replicated in the replication Sibling cohort. In both discovery and replication analyses, genes CYP2E1 and WASH2P were identified due to interaction signals, and genes LOC84931 and HIST1H2BJ were identified due to main signals.
Figure 2 plots boxplots of methylation measures of the 13 CpGs in gene CYP2E1, identified and replicated due to interaction signals, stratifying by PAH and ADHD. Eight out of the 13 CpGs have clear interaction signals in the discovery data, when all 8 showed interaction signals in the same direction in the replication data. It was reported that prenatal exposure to serotonin reuptake inhibitor antidepressants modifies the association between DNA methylation at regulatory region of CYP2E1 and third trimester maternal depressed mood symptoms (Gurnot et al., 2015). Elevated DNA methylation in the promoter-regulatory region of the gene CYP2E1 was also reported to be associated with severe psychosocial deprivation in early childhood and socio-cognitive impairment (Kumsta et al., 2016). We similarly plotted for genes LOC84931, HIST1H2BJ and WASH2P (Supplementary Figs S3–S5).
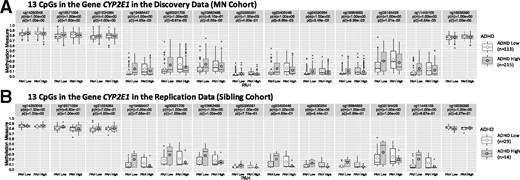
Boxplot of DNA methylation measures of the 13 CpGs in gene CYP2E1 stratified by PAH and ADHD status in the (A) discovery analysis using the MN cohort, and the (B) replication analysis using the Sibling cohort. Here p(m) and p(i) are Bonferroni-adjusted (for number of CpGs in gene CYP2E1) P-values testing in the logistic model and in the multiple logistic model , respectively
4.4.3 Results of the comparison methods
At the same 0.005 P-value threshold, the comparison methods identified different number of genes (Supplementary Tables S3–S9), when all these genes rank within top 4% of the proposed method results. The comparison methods have replication rates 0–33% with an average 12% (Supplementary Table S10). Detailed results are in Supplementary Material Section 2.2.
4.5 Risk of PAH, DNA methylation and their interactions on MDI
Two-third MN samples (n = 216) were used for the discovery analysis and 1/3 (n = 94) for the replication analysis.
4.5.1 Discovery analysis in the discovery data
At the same 0.005 P-value threshold, the proposed method identified seven genes in the discovery analysis, with five due to main signals only and two due to both main and interaction signals (Table 4).
Application examining prenatal PAH, DNA methylation and their interactions on child MDI at age 3 identified seven genes by the proposed method at the 0.005 gene-level P-value threshold
| Rank in | Gene | # CpG | Rank in | Rank in |
|---|---|---|---|---|
| 1 | UROS | 2 | 2 | 18 516 |
| 2 | FAM35A a | 7 | 1 | 15 325 |
| 3 | DIRC1 a | 3 | 5 | 17 815 |
| 4 | THSD1P a | 5 | 7 | 15 099 |
| 5 | C19orf77 | 9 | 6 | 647 |
| 6 | MIR521-1 | 1 | 9 | 18 302 |
| 7 | C8orf80 a | 4 | 3 | 2329 |
| Rank in | Gene | # CpG | Rank in | Rank in |
|---|---|---|---|---|
| 1 | UROS | 2 | 2 | 18 516 |
| 2 | FAM35A a | 7 | 1 | 15 325 |
| 3 | DIRC1 a | 3 | 5 | 17 815 |
| 4 | THSD1P a | 5 | 7 | 15 099 |
| 5 | C19orf77 | 9 | 6 | 647 |
| 6 | MIR521-1 | 1 | 9 | 18 302 |
| 7 | C8orf80 a | 4 | 3 | 2329 |
Genes replicated in the replication analysis.
4.5.2 Replication analysis in the replication data
At the same 0.1 gene-level P-value threshold for replication, three genes, FAM35A, DIRC1 and THSD1P, were replicated in the replication analysis due to main signals out of the five genes identified in the discovery analysis due to main signals only. Gene C8orf80 was replicated due to interaction signals, out of the two genes identified in the discovery analysis due to both main and interaction signals. That is, the replication rate is 57% with four out of seven genes replicated. Figure 3 plots boxplots of DNA methylation measures of the four CpGs in gene C8orf80 stratified by PAH and MDI status that was identified due to both main and interaction signals and replicated due to interaction signals. We similarly plotted genes FAM35A, DIRC1 and THSD1P (Supplementary Figs S6–S8).
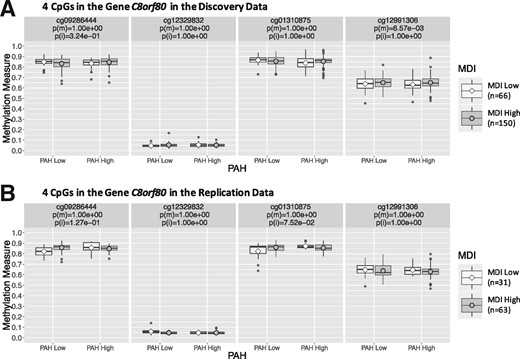
Boxplots of DNA methylation measures of the four CpGs in gene C8orf80 stratified by PAH and MDI status in the (A) discovery analysis using the 2/3 MN discovery data, and the (B) replication analysis using the 1/3 MN replication data. Here p(m) and p(i) are Bonferroni-adjusted (for number of CpGs in gene C8orf80) P-values testing in the logistic model and in the multiple logistic model , respectively
4.5.3 Results of the comparison methods
All genes identified by the comparison methods rank within top 3% of the proposed method results. The comparison methods have replication rates 0–25% with an average 16% (Supplementary Table S11 and details in Supplementary Material Section 2.3).
5 Discussion
We developed a novel weighted distance-based method that considered interactions between CpGs in a gene and an environmental factor through constructing a pseudo-data matrix with their cross-product terms. The proposed approach is powerful and flexible with several advantages. First, the weighted distance matrix always has a dimension N × N with N being the sample size regardless the added dimensionality from pairwise interactions. Second, by calculating distances between pairs of individuals across CpGs and their interactions with an environmental factor, weak main/interaction signals are accumulated, boosting the study power. Third, incorporating association strength weights in calculating distances helps up-weight signals and down-weight noises thus further improves the overall power, especially when a small percent of CpGs in a gene are signals. Most importantly, simulation results suggest that when the main-to-interaction signal ratio decreases, i.e. when the number of main signals decreases or the number of interaction signals increases but fixing the total number of signal items, the proposed method maintains similar power and almost achieves the highest power among all comparison methods, while the comparison methods have power drop. This makes the proposed approach especially attractive due to the known low power in detecting interactions.
In the application to the CCCEH MN and Sibling cohorts examining prenatal PAH, DNA methylation and their interactions on child ADHD at age 3, identified 17 genes in the discovery data with 4 replicated in the replication data, while the comparison methods have an average replication rate 12%. In another application on child MDI at age 3, identified seven genes in the discovery data with four replicated in the replication data, while the comparison methods have an average replication rate 16%.
In general, the proposed method that considers both main and interaction signals has a superior performance than methods that consider only one type of signals when there are both. The weighted versions are always more powerful than non-weighted versions, especially when a small percentage of CpGs in a gene have weak signals. The proposed method was developed for DNA methylation by environment interactions but can be readily extended to CpG by CpG interactions similarly using a pseudo-data matrix constructed with cross-product terms between CpGs. However, the dimension of this pseudo-data matrix capturing pairwise CpG by CpG interactions goes up exponentially, which could easily out-number the dimension of CpGs in the gene. We need to take extra caution to balance between main or interaction signals, especially when assigning weights.
Funding
This work was supported by the National Institutes of Health [5UG3OD023290-02 to Y.W., J.B.H., F.P.P., S.W.].
Conflict of Interest: none declared.
References
American Psychiatric Association (

