


Abstract
Microbes are the most diverse organisms on the planet. Deep sequencing of ribosomal DNA (rDNA) suggests thousands of different microbes may be present in a single sample. However, errors in sequencing have made any estimate of within-sample (alpha) diversity uncertain.
We developed a tool to estimate alpha diversity of rDNA sequences from microbes (and other sequences). Our tool, Distanced, calculates how different (distant) sequences would be without sequencing errors. It does this using a Bayesian approach. Using this approach, Distanced accurately estimated alpha diversity of rDNA sequences from bacteria and fungi. It had lower root mean square prediction error (RMSPE) than when using no tool (leaving sequencing errors uncorrected). It was also accurate with non-microbial sequences (antibody mRNA). State-of-the-art tools (DADA2 and Deblur) were far less accurate. They often had higher RMSPE than when using no tool. Distanced thus represents an improvement over existing tools. Distanced will be useful to several disciplines, given microbial diversity affects everything from human health to ecosystem function.
Distanced is freely available at https://github.com/thackmann/Distanced.
Supplementary data are available at Bioinformatics online.
1 Introduction
Microbes are found nearly everywhere and form communities more diverse than any other group of organisms. Though this diversity has been long recognized, it has become more apparent with deep sequencing their DNA. Recent work suggests there are hundreds or thousands of different ribosomal DNA (rDNA) sequences in most microbial communities (Thompson et al., 2017). This diversity is not only fascinating, but it is also likely important for human health and the planet’s ecosystems. In the human gut, low diversity of bacterial rDNA sequences is associated with obesity (Turnbaugh et al., 2009). In soil, low diversity is associated with low plant productivity, nutrient cycling and other measures of ecosystem function (Philippot et al., 2013; Soliveres et al., 2016).
Though rDNA sequences from microbes are no doubt diverse, it has been challenging to determine exactly how diverse they are. Initial reports of a ‘rare biosphere’ of seawater claimed unprecedented levels of alpha (within-sample) diversity. Most samples were estimated to have over 10 000 different sequences (Sogin et al., 2006). Later analysis showed sequencing errors created false sequences, and the actual diversity was likely much lower (Kunin et al., 2010).
Sequencing errors pose a problem for estimating alpha diversity, but computational tools have been developed to tackle this problem. These tools aim to correct sequencing errors and output the original (error-free) rDNA sequences. DADA2 (Callahan et al., 2016) and Deblur (Amir et al., 2017) belong to the latest generation of these tools, which claim accuracy to single nucleotide letters. Evaluations with artificial microbial communities would seem to support their accuracy and use for estimating alpha diversity. In these evaluations, the number of rDNA sequences outputted by the tools closely matched the number of sequences (or organisms) known in the community (Amir et al., 2017; Callahan et al., 2016; Nearing et al., 2018). When expressing alpha diversity as the number of sequences, DADA2 and Deblur appear to have solved the problem posed by sequencing error.
Though DADA2 and Deblur estimate it accurately, the number of sequences (richness) is a very simple measure of alpha diversity. Richness ignores how abundant or related sequences are, though these are important aspects of diversity (Lozupone and Knight, 2008). If they use richness, investigators may miss ecologically important relationships in their data. For example, investigators found a relationship (positive correlation) between bacterial diversity and pH in a hot spring (Stout et al., 2009). The relationship was weak when using richness as a measure of alpha diversity. The relationship was strong, however, when using a more complex measure [mean pairwise distance (MPD)]. This more complex measure accounts for both sequence abundance and relatedness (distance). Thus, evaluations of DADA2 and Deblur should consider not only richness, but also more complex ways of measuring alpha diversity.
Our objective was to determine if computational tools accurately estimate alpha diversity of DNA sequences from microbes and other sources. Unlike previous evaluations, we considered a measure of alpha diversity that accounts for both abundance and relatedness. We found that DADA2 and Deblur are not accurate. Indeed, they produced estimates worse than when the tools were not used (errors were left uncorrected). These tools corrected or removed most erroneous sequences, but they distorted sequence abundance in the process. We propose a tool, Distanced, that does not remove erroneous sequences. Instead, it corrects alpha diversity for the expected increase after sequencing, doing so directly with Bayes’s theorem.
2 Materials and methods
2.1 Approach used by Distanced
Our tool, Distanced, estimates MPD, a measure of alpha diversity (Martin, 2002; Tucker et al., 2017). Because it relies on sequence distances, it accounts for the relatedness of sequences (organisms) (Fig. 1A). It also accounts for sequence abundance and evenness (Fig. 1A) (Lozupone and Knight, 2008).
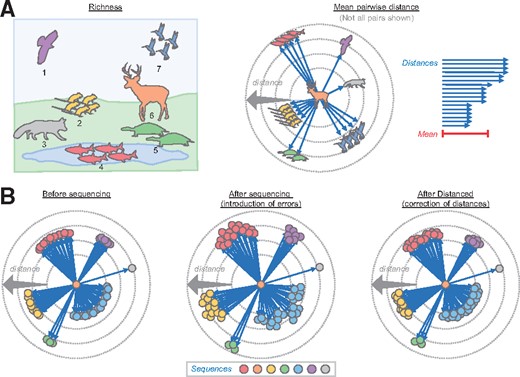
Alpha diversity and the unique approach used by Distanced to estimate it. (A) Comparison of richness and MPD, which are two measures of alpha diversity. A non-microbial community is used for illustration. Distances are arbitrary. (B) Approach used by Distanced to estimate MPD
This complexity makes MPD more useful than richness and other measures of alpha diversity. As mentioned, it revealed that bacterial diversity was related to pH in a hot spring (Stout et al., 2009). By contrast, richness was not strongly related to pH, and neither were the Simpson and Shannon indices. Additionally, it revealed alpha diversity of cecal and fecal bacteria differed across human subjects, whereas Shannon and Simpson indices could not (Eckburg et al., 2005).
MPD is calculated by averaging the distance between all pairs of sequences in a sample (Fig. 1A). Distance is defined here as the fraction of different nucleotide letters, but it can also be defined as the total number of different letters. MPD is also known as θ, and it is 1/2 the Rao Diversity Coefficient (Lozupone and Knight, 2008).
Distanced estimates MPD before introduction of sequencing errors (Fig. 1B). The only inputs required by the tool are (i) the observed distances (after introduction of sequencing errors) and (ii) error rates. Sequencing errors inflate distances between sequences by changing their letters and making them more different on average (though some individual letters may become more similar). Our tool uses Bayes’s theorem to estimate the original distances (before introduction of sequencing errors). The average of those estimated distances is the estimated MPD.
At present, Distanced uses estimated distances to calculate only one measure of alpha diversity (MPD). However, other measures of diversity can be calculated from sequence distances (Lozupone and Knight, 2008; Tucker et al., 2017), and these measures are targets of future work.
2.2 Simulated reads
We first evaluated our tool with simulated reads. Twenty-five thousand pairs of reads were simulated with n = 300 positions. Letters (A, T, C, G) were chosen randomly for one member of the pair. Letters for the other member were chosen to match at a specified distance (e.g. 0.05). Errors were introduced at a rate of 0.0025, which is a typical value for real reads (data not shown). Errors were introduced under the assumptions they (i) occur independently and (ii) are substitutions.
2.3 Real reads from artificial microbial communities
We next evaluated our tool with real (biological) reads from artificial microbial communities. Reads were processed according to steps in Fig. 2 and as described below.
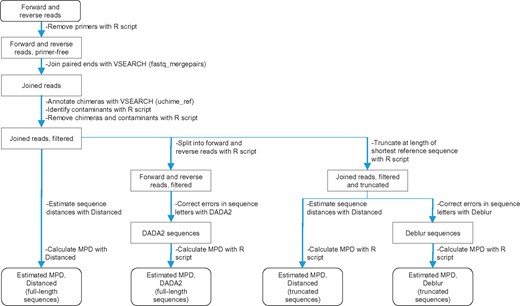
Sequence reads were analyzed with Distanced, DADA2 and Deblur following outlined steps. VSEARCH and custom R scripts were also used as indicated
Reads corresponded to three different types of sequences: 16S rDNA of 21 bacterial strains (Kozich et al., 2013), internal transcribed spacer (ITS) rDNA of nine fungal strains (Bakker, 2018) and synthetic mRNA of 16 different antibodies (Khan et al., 2016). The antibody sequences were based on the immunoglobulin G heavy chain of the mouse. Samples are fully described in Supplementary Table S1. Reference sequences (the actual sequences) were obtained from the publications or, in the case of 16S rDNA, downloaded from https://www.mothur.org/MiSeqDevelopmentData.html.
Primers were removed using a custom R script. This script enabled removal of primers at both 5′ and 3′ ends. Primers were present at the 3′ end of many ITS1 reads because the original sequences (amplicons) were short, and the read could extend to the very end. The script was not applied to 16S rDNA because primers had already been removed by the authors (Kozich et al., 2013).
The paired ends of forward and reverse reads were joined with VSEARCH (v. 2.8.5) (Rognes et al., 2016). The fastq_mergepairs command was used with parameters in Supplementary Table S1 and a custom script. For 16S rDNA of bacteria, this step served to separate the different regions analyzed.
Reads were annotated as polymerase chain reaction chimeras (concatenations of two parent sequences) using VSEARCH and the uchime_ref command. This command requires databases of reference sequences. For 16S rDNA, the database was from SILVA (Quast et al., 2013). It was the SSU Ref release 132 (https://www.arb-silva.de/download/arb-files/). For ITS rDNA, the database was from UNITE (Kõljalg et al., 2013). It was the QIIME release, version 7.2, and with a dynamic threshold value (https://doi.org/10.15156/BIO/587481). For antibody mRNA, we made a reference database containing the original 16 synthetic mRNA sequences (Khan et al., 2016).
Using the output from the usearch_global command of VSEARCH, we annotated contaminants as reads with ≥25 differences from reference sequences. Contaminants may originate from laboratory reagents (de Goffau et al., 2018), or they may originate from other samples (due to faulty demultiplexing) (Kircher et al., 2012). The threshold of 25 differences was set to a high value to avoid removing too many good reads (non-contaminants). The high value was needed because the number of errors follows a distribution with a long tail (see Supplementary Fig. S2). In total, 0.63% of 16S rDNA, 0% of ITS rDNA and 0.02% of antibody mRNA reads were annotated as contaminants.
After their annotation, chimeras and contaminants were removed. This gave joined and filtered reads.
For DADA2, joined reads were split into individual forward and reverse reads. The splitting was done by matching the sequence identifier of the joined and filtered reads with the IDs of the original forward and reverse reads. This step was needed because DADA2 corrects (denoises) sequences prior to joining them. DADA2 (v. 1.8) was subsequently run using these reads, parameters in Supplementary Table S2 and a custom script. The number of reads inputted, outputted and remaining at different steps in DADA2 is reported in Supplementary Table S2.
For Deblur, joined reads were truncated (trimmed) at the 3′ end to the length of the shortest reference sequence. This step was needed because Deblur requires reads to be the same length. Deblur was run within QIIME2 (Bolyen et al., 2018) using these reads, parameters in Supplementary Table S3 and a custom script. The number of reads inputted, outputted and remaining at different steps in Deblur is reported in Supplementary Table S3.
Deblur includes a positive filtering step, which removes sequence reads that do not match a reference database. For 16S rDNA, the database was 88% operational taxonomic units from GreengeneS13_8 (the default). For ITS rDNA and antibody mRNA, the databases were the same as used for chimera removal with VSEARCH.
Distanced was run using a custom R script. For each sample, 1000 reads were randomly subsampled (out of the total number of reads reported in Supplementary Table S1). If present in a read, ambiguous letters (N) were replaced with an A, T, C, or G (chosen randomly). Reads were aligned against reference sequences with CLUSTAL OMEGA (Bodenhofer et al., 2015; Sievers et al., 2011). A matrix of estimated distances was constructed by calculating distances between each pair of sequence reads. Distances were calculated according to Eq. (1), observed distances and instrument-reported error rates. The observed distance was 0 if letters of the nucleotide pair matched and 1 if they did not. For indels, estimated and observed distances were both set to 1.
Estimated MPD was the mean of distances in the matrix. The diagonal elements in the matrix were not included.
Values of MPD were also calculated for sequences outputted by DADA2, sequences outputted by Deblur, and for sequences with errors left uncorrected (joined and filtered reads). This was done using a custom R script, which aligned reads and calculated a matrix of distances.
This subsampling of 1000 reads and calculation of MPD was iterated 100 times per sample. Reported values of MPD and other variables are means of these 100 iterations. With this number of iterations, values of MPD had small standard errors (<0.6% of the mean).
Distanced was run with both truncated and non-truncated (full-length) sequences. This enabled separate comparison to Deblur and DADA2. For the V3–V4 region of 16S rDNA, DADA2 outputted fewer than 1000 reads for some samples (see Supplementary Table S2). For the full-length sequences for this region, 900 reads were thus subsampled.
A matrix of actual distances was determined by (i) finding a matching reference sequence for each read and (ii) calculating the distance between these matches. The matching reference sequence was that with highest identity with the read. Actual MPD was calculated from this matrix.
Instrument-reported error rates were calculated from quality scores () as . These quality scores were calculated for the merged reads according to Edgar and Flyvbjerg (2015) by the fastq_mergepairs command of VSEARCH. The actual number of errors was calculated by comparing uncorrected sequences with matching reference sequences.
2.4 Real reads from real microbial communities
We applied our tool to real reads from real bacterial communities. Bacterial communities were from human feces, mouse feces or soil (Kozich et al., 2013) (Supplementary Table S1). The V4 region of 16S rDNA was analyzed throughout.
Estimated MPD was calculated in the same way as for artificial microbial communities. Because no reference sequences were available, contaminants were not identified or removed. Additionally, reads were aligned against only themselves, rather than against reference sequences.
2.5 Computational resources
Computational resources for analyzing samples were determined using the time package in Ubuntu 18.04 LTS. The resources were maximum memory and run time. Analyses were completed with one thread of a Xeon Platinum 8175 processor and with 16 GiB of RAM.
2.6 Statistical analysis
3 Results
3.1 Distanced accurately estimated alpha diversity of simulated sequence reads
We developed a tool to estimate alpha diversity of rDNA sequences from microbial communities. We evaluated this tool, Distanced, against DADA2 and Deblur, which represent the state-of-the-art for analyzing these sequences (Knight et al., 2018). We focused on how well these tools estimate MPD, a measure of alpha diversity more complex and useful than richness (see above).
We began our evaluation by using simulated sequence reads, where the sequences and sequencing error rates are known. For these reads, Distanced corrects distances exactly (without bias) and estimates MPD without error (Supplementary Fig. S1).
3.2 Distanced accurately estimated alpha diversity of artificial communities
We continued our evaluation by using artificial microbial communities, in which the organisms and rDNA sequences are known. Unlike with simulated reads, error rates are not known, but they can be estimated with Phred quality scores reported by sequencing instruments (Ewing and Green, 1998).
For these artificial communities, we found that Distanced produced estimates of MPD that were close to the actual values (Fig. 3). However, estimates from DADA2 were generally worse (Fig. 3A). Indeed, using no correction for sequencing errors generally produced better estimates than DADA2.
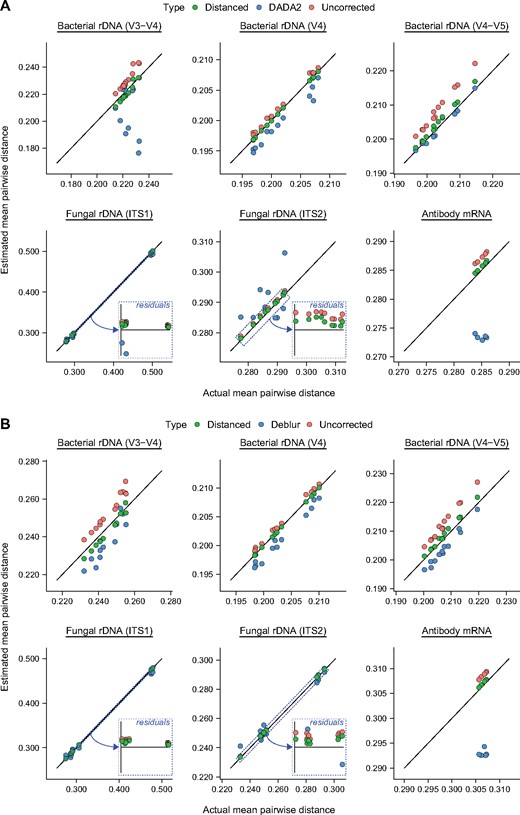
Distanced accurately estimates alpha diversity (MPD) of artificial microbial communities. Estimates from Distanced are shown alongside those from (A) DADA2 and (B) Deblur. Sequences analyzed are for different regions (V4, V3–V4, V4–V5, ITS1, ITS2) of rDNA from artificial microbial communities. mRNA from antibodies is included for comparison. Distances between sequences were estimated by Distanced. Errors in sequence letters were corrected by DADA2 or Deblur. MPD was calculated using Distanced or a custom R script. This calculation was iterated 100 times per sample. Estimates of MPD when using no correction are shown for comparison. Each observation represents one sample
Similar results were found when comparing Distanced and Deblur (Fig. 3B). This comparison was made separate from the previous one because Deblur requires sequence reads that are truncated (trimmed to a fixed length).
We quantified performance of these tools by calculating RMSPE. We found that Distanced always reduced error in MPD (Fig. 4). DADA2 and Deblur, in contrast, usually increased it.
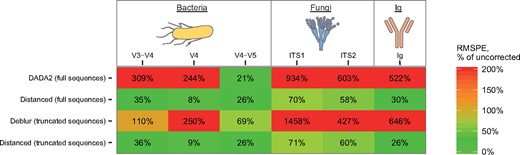
Calculating error confirms that Distanced accurately estimates alpha diversity (MPD). RMSPE was calculated from observations in Fig. 3 and expressed as a percentage of using no correction for sequencing errors. A value >100% means that leaving errors uncorrected is better. Ig, immunoglobulin (antibodies)
To determine why DADA2 and Deblur performed poorly, we first determined how many errors remained in the sequences they outputted. We found that almost no errors remained (Fig. 5A and Supplementary Fig. S2). When we manually corrected all remaining errors, we found that estimates of MPD did not improve (Supplementary Fig. S3). Thus, uncorrected errors do not explain why DADA2 and Deblur estimate MPD poorly.
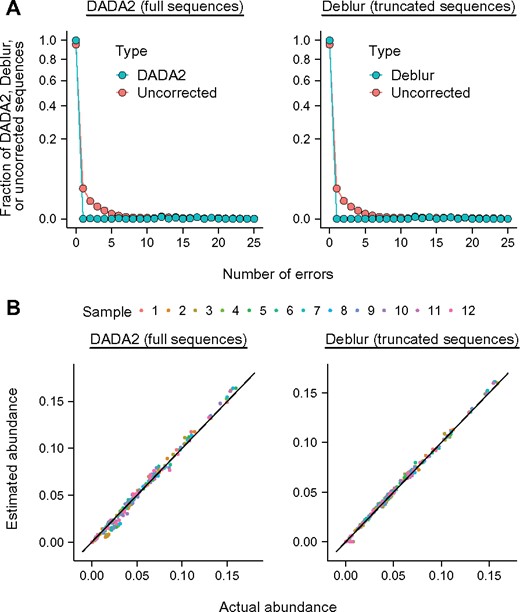
Sequences outputted by DADA2 and Deblur have few errors, but their abundance is distorted. (A) Frequency of errors. Values when using no correction for sequencing errors are shown for comparison. (B) Abundance of sequences outputted by DADA2 and Deblur versus actual abundance. Sequences analyzed are for the V4 region of 16S rDNA of an artificial bacterial community. Other regions and sequence types are shown in Supplementary Figs S2 and S4
Though they had few errors, the sequences outputted by DADA2 and Deblur had abundances different from the sequences in the original sample. Most often, DADA2 and Deblur (i) underestimated rare sequences and (ii) overestimated sequences at medium or high abundance (Fig. 5B and Supplementary Fig. S4). Some rare sequences were missing entirely. For DADA2 and the V3-V4 region of 16S rDNA, missing sequences had abundance as high as 0.04 (Supplementary Fig. S4). Thus, DADA2 and Deblur distorted abundances of sequences. This distortion, rather than uncorrected errors, explains why the tools estimated MPD poorly (see Supplementary Fig. S3).
Past evaluations examined how well DADA2 and Deblur estimated richness (Amir et al., 2017; Callahan et al., 2016; Nearing et al., 2018). In our evaluation, DADA2 and Deblur generally underestimated this measure of alpha diversity (Supplementary Fig. S5). This was expected because some rare sequences were missing from their output. However, the estimates were good compared to leaving sequencing errors uncorrected.
3.3 Distanced can be applied to many different types of sequences
Our evaluation has focused on rDNA sequences from microbial communities. In principle, however, Distanced can be applied to any type of sequence. DADA2 and Deblur use parameters calibrated with data from artificial microbial communities (Amir et al., 2017; Callahan et al., 2016). Their use may be restricted to these data. In contrast, Distanced has no such parameters (see Section 2).
To test this idea, we evaluated Distanced with antibody sequences, which are highly diverse (Georgiou et al., 2014). Distance’s performance was similar for antibodies as for microbes (Figs 3 and 4), confirming that it can be applied to a wide range of data. The performance of DADA2 and Deblur was poor. These results show that Distanced can be applied to many types of sequences, whereas application of DADA2 and Deblur is more restricted.
3.4 Distanced, DADA2 and Deblur produce different estimates of alpha diversity of real communities
We continued our evaluation by using real microbial communities. Our evaluation included bacterial communities from human feces, mouse feces and soil. For each community, Distanced produced estimates of MPD very different from those produced by DADA2 and Deblur (Fig. 6).
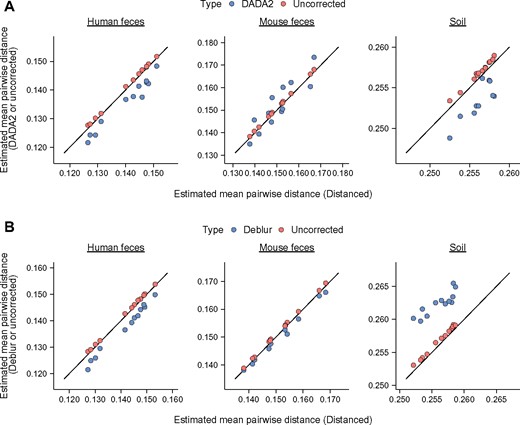
Distanced shows that DADA2 and Deblur are inaccurate for real bacterial communities. (A) Comparison of MPD estimated by DADA2 and Distanced. (B) Comparison of Deblur and Distanced. Sequences analyzed are for the V4 region of rDNA for bacterial communities from human feces, mouse feces and soil. Distances between sequences were estimated by Distanced, and errors in sequence letters were corrected by DADA2 or Deblur. MPD was calculated using Distanced or a custom R script. This calculation was iterated 100 times per sample. Estimates of MPD when using no correction are shown for comparison. Each observation represents one sample
The organisms in real communities are not known, and there is no direct way to determine if Distanced is more accurate than DADA2 or Deblur. However, there is indirect evidence that DADA2 and Deblur are inaccurate. Specifically, DADA2 and Deblur produced very high estimates of MPD for some samples. In fact, they could produce estimates higher than when using no correction for sequencing errors. This behavior was most apparent for Deblur and bacterial communities from soil (Fig. 6B). An accurate tool should not display this behavior; statistically, estimates of MPD are expected to be lower, not higher, after correcting errors (see Fig. 1B and Supplementary Fig. S1). This behavior suggests that DADA2 and Deblur are not accurate for real bacterial communities.
3.5 Distanced requires modest amounts of memory but has a long run time
We ended our evaluation of Distanced by determining what computational resources it requires. To analyze the real bacterial communities described above, Distanced required ∼1.2 GiB of memory (Supplementary Fig. S6). For the same set of samples, Deblur required the same or less memory. DADA2 required more (up to ∼4.7 GiB).
Though it required a modest amount of memory, Distanced had a long run time. It required ∼17 h to analyze all 12 samples per community (Supplementary Fig. S6). DADA2 required ∼8 h or less, and Deblur required ∼2 h or less.
Work is underway to improve Distance’s run time. The slowest steps are aligning reads (accounting for ∼55% of run time) and estimating distances (∼20% of run time). These steps are targets for improvement.
4 Discussion
Though introduced in medicine, the principle of primum non nocere (do not harm) should apply to all arenas of science. Towards this end, tools for correcting rDNA sequences from microbial communities should improve, not worsen, estimates of microbial diversity. We show, unfortunately, that this principle is broken with two popular tools (DADA2 and Deblur). The original sequencing data (with sequencing errors) generally produced better estimates of alpha diversity than did the output of the tools.
The problem has been overlooked by evaluating these tools with a simple measure of alpha diversity (richness) (Amir et al., 2017; Callahan et al., 2016; Nearing et al., 2018). It becomes apparent only when using a more complex measure (MPD) that accounts for sequence abundance and relatedness (distance). Past evaluations had shown that tools distort abundance of sequences (Amir et al., 2017). In retrospect, it is unsurprising that the existing tools would estimate MPD poorly.
Our tool, Distanced, does not estimate alpha diversity perfectly, but it does reduce error markedly and consistently. In a display of its flexibility, its accuracy for antibody sequences was as high as for microbial sequences. No adjustments to the tool were required to accommodate different sequences.
DADA2 and Deblur output sequences containing few errors. They are useful tools when the goal of analyzing rDNA sequences is to correct or remove erroneous sequences. However, they estimate alpha diversity poorly when accounting for sequence abundance and relatedness. By using a novel approach, Distanced estimates alpha diversity accurately.
At present, Distanced can estimate only one measure of alpha diversity (MPD). However, its scope can be expanded. Distanced works by estimating sequence distances before introduction of sequencing errors. We used those distances to calculate one measure of alpha diversity (MPD), but other measures of diversity can be calculated from sequence distances (Lozupone and Knight, 2008; Tucker et al., 2017). We are currently generalizing Distanced in order to estimate other measures of diversity.
Distanced represents a direct and accurate approach to estimate microbial diversity. With accurate estimates in hand, investigators can answer important questions about microbial diversity. In particular, they can better answer how loss in microbial diversity may affect human health or ecosystem function. This will make Distanced an important tool to investigators.
Acknowledgements
We thank S. Hackmann (University of Florida), J. Tao (University of Miami) and Courtney McCourt (University of Florida) for reviewing the manuscript.
Funding
This work was supported by an Agriculture and Food Research Initiative Competitive [grant 2017-67030-26589/project accession 1012177] and Hatch Project [accession 100275 and 1002352] from the United States Department of Agriculture National Institute of Food and Agriculture.
Conflict of Interest: none declared.
References

