


Abstract
Many methods have been developed to estimate immune cell composition from tissue transcriptomes. One common characteristic of these methods is that they are trained using a set of general immune cell transcriptomes that ignores tissue specificities. However, as immune cells are localized in different tissues, they may have distinct expression profiles. Hence, calculations that use general signature matrices may hinder the deconvolution accuracy.
This study used single cell RNA-sequencing (scRNA-Seq) data from different mouse tissues instead of general signature expression values to generate tissue-specific signature gene matrices that are used as the input of the deconvolution model. First, the transcriptome of immune cells in each tissue was extracted from scRNA-Seq data and used to construct the entire expression matrix of tissue immune cells. Then, after comparing different gene selection strategies, the expressions of 162 seq-ImmuCC derived signature genes in tissue immune cell scRNA-Seq data were regarded as the tissue specific signature matrices. Finally, a modest improvement in performance was observed in multiple tissues that refer to a traditional general signature matrix in the deconvolution model. With the fast accumulation of scRNA-Seq data, the introduction of these data into an estimation of immune cell compositions for different tissues will open a new window for avoiding tissue bias for immune cell expression.
The signature matrices were available at https://github.com/wuaipinglab/ImmuCC/tree/master/tissue_immucc/SignatureMatrix).
Supplementary data are available at Bioinformatics online.
1 Introduction
The use of tissue-infiltrating immune cells has long been recognized as informative of health status due to the cells’ special role in maintaining the balance of the local microenvironment. The composition of immune cells is closely associated with the function or disease state of tissues. This composition has traditionally been measured using the expression of protein markers via flow cytometry and immunohistochemistry (Basa et al., 2016; Yu et al., 2016). In recent years, some computational methods have been proposed to estimate immune-cell components from multi-omics data, particularly tissue transcriptomes (Abbas et al., 2009; Altboum et al., 2014; Avila Cobos et al., 2018; Chen et al., 2017, 2018; Li et al., 2016; Qi et al., 2014).
Among these methods, gene expression in tissues has been assumed to be a linear summation of expression scales obtained from all the cellular components. Therefore, the proportions of cellular components have been inferred by building a fitting model between bulk and cell type specific expression profiles. In general, these computational models have consisted of four steps. First, the transcriptomes of immune cells profiled on one platform are collected. After quality control, immune cell transcriptome data that can be correctly classified using principal component analysis and hierarchical clustering methods are filtered and selected. Second, a set of signature genes is defined by comparing gene expression across different cell types and is then used to build an expression matrix of signature genes, the signature matrix. For each cell type, genes significantly up-regulated are identified by comparing with other immune cells. Significantly differentially expressed genes are then ranked according to their fold change, and the top n genes for each immune cell type are combined to form the signature gene sets. In addition, the average gene expression values across the replicates for each cell type are used as a representative expression matrix. Combining the signature genes selected and the representative expression matrix, the signature matrix is then constructed. Third, a deconvolution model is developed by integrating the identified signature matrix with an appropriate machine learning method. Finally, the model is validated with both the simulated data and the experimental data.
Even though these computational models have been increasingly applied (Abbas et al., 2009; Aran et al., 2017; Chen et al., 2017, 2018; Liebner et al., 2014; Newman et al., 2015; Qi et al., 2014; Zhong et al., 2013), the existing models have some inherent limitations. These limitations include such factors as the sources of immune cells that are primarily collected from immune tissues or in vitro cultured samples to generate a common training expression dataset (Abbas et al., 2009; Altboum et al., 2014; Chen et al., 2017; Li et al., 2016; Qi et al., 2014). This strategy could potentially introduce data bias into the model when it uses divergent biological samples from different tissues. Evidence has suggested that the behavior of internal cell components can be shaped by tissue micro-environmental factors (Lavin et al., 2014; Mollaoglu et al., 2018). Immune cells localized at different positions may have distinct expression profiles (Mass et al., 2016). Macrophages can be classified into various types according to their tissue origins; for example, brain microglia, spleen red pulp macrophages, liver Kupffer cells, lung alveolar macrophages and others (Ginhoux and Guilliams, 2016). Typically, bias will be introduced when the testing data and the training data of the computational model are not from the same tissue. A solution is to construct a deconvolution model with a set of tissue-specific signature gene matrices, which means, one tissue used one matrix to build one model. Fortunately, with the development of single cell RNA-sequencing (scRNA-Seq) technology, we are now able to view the transcriptional information of tissue infiltrating immune cells at the single cell level (Han et al., 2018). Therefore, it is possible to construct a tissue-specific deconvolution model by integrating the scRNA-Seq data of tissue immune cells.
In this study, a series of tissue-specific signature matrices are constructed to predict immune cell compositions from tissue RNA-Seq data. Using the scRNA-Seq data collected by Han et al. (Han et al., 2018), the transcriptome of tissue immune cells was obtained and used to construct an entire expression matrix of tissue-specific immune cells. With the signature genes selected and the expression profiles of tissue immune cells, a tissue-specific signature matrix can be constructed. This tissue-specific signature matrix is then combined with the computational frameworks of the CIBERSORT (Newman et al., 2015) and ImmuCC methods (Chen et al., 2017), and a tissue-specific deconvolution approach named tissue-ImmuCC is developed to infer the immune cell composition from the tissue transcriptome data. Specifically, the training data used in tissue-ImmuCC is comprised of several tissue specific signature matrices. To evaluate different selection strategies for signature genes, the root mean square error (RMSE) between the predicted proportions and the flow cytometry results (Chen et al., 2017) are calculated. The results indicate that the tissue-specific signature matrices developed using the bulk RNA-Seq data-derived signature genes (Chen et al., 2018) outperformed the scRNA-Seq data-derived signature genes. Using the same evaluation strategy, the performance of three different quantification methods used to measure the gene abundance of testing data were compared. The gene length scaled quantification units, including fragments per kilobase million (FPKM) or transcripts per kilobase million (TPM) based testing data, exhibited a better performance than the read counts-based model. Furthermore, the tissue-specific approach was applied to seven synthetic tissue transcriptomes, and a better performance was found when the training data and testing data were from the same tissue. A comparison of the tissue-ImmuCC and seq-ImmuCC showed that the tissue-ImmuCC performed slightly well.
2 Materials and methods
2.1 Overview of approach development
(i) Data collection. Mouse tissue scRNA-Seq data produced by Han et al. (Han et al., 2018) was downloaded from https://figshare.com/articles/MCA_DGE_Data/5435866, and the batch removed digital gene expression (DGE) data ‘MCA_BatchRemove_dge.zip’ was used for later analysis. (ii) Sample annotation. The Pearson correlation between the single-cell sequencing data and the reference data (A matrix for the average transcriptome data of 894 cell types) (Han et al., 2018) was calculated to assign a cell type to each sample datum (Supplementary Materials and Methods Section). Tissue immune cells were extracted and merged into ten major cell types (T cells, B cells, NK cells, macrophages, dendritic cell, granulocytes, neutrophils, basophils, mast cells and monocytes) according to their labels. (iii) Median expression calculation. For each cell type, the median expression of the genes was calculated and used to represent its tissue expression value. For cell types with no more than 100 cells in the tissue scRNA-seq data, the expression profile of peripheral blood derived cells was used. (iv) Signature gene selection. Genes that could be used to distinguish each immune cell from others were used as its specifically expressed genes. According to the source of immune cell and non-hematopoietic tissue sequencing data, three different gene selection methods were designed. (v) Signature matrix construction. By utilizing the transcriptome and signature genes of the tissue immune cells, the expression pattern of signature genes across different immune cells was used as the signature matrix. Combined with the computational framework used in our previous research (Chen et al., 2017; Newman et al., 2015), three different signature gene selection strategies were evaluated using the experimental data to provide the best option. (vi) Quantification method comparison. The performance of three different quantification methods used in the bulk RNA-Seq data, including read counts, FPKM and TPM, were compared to select the best data type for the testing data. (vii) Model evaluation. The tissue-specific model was validated using the aggregated single-cell expression data and experimental data.
2.2 Data
(i) Single-cell sequencing data. Single-cell sequencing data of mouse tissue from Han et al. was used to construct the signature matrix, and the data were downloaded from the link https://figshare.com/articles/MCA_DGE_Data/5435866/MCA_BatchRemove_dge.zip. The scRNA-Seq data of 39 mouse tissues [bladder, bone marrow (BM), BM cKit, brain, fetal brain, fetal female gonad, fetal intestine, fetal kidney, fetal liverE14, fetal lung, fetal male gonad, fetal pancreas, fetal stomach, kidney, liver, lung, mammary gland involution, mammary gland lactation, mammary gland pregnancy, mammary gland virgin, muscle, neonatal brain, neonatal calvaria, neonatal heart, neonatal muscle, neonatal pancreas, neonatal rib, neonatal skin, ovary, pancreas, peripheral blood, placentae 14, prostate, small intestine, spleen, stomach, testis, thymus and uterus] were included in this dataset. In addition, the single cell transcriptomics of five mouse tissues (spleen, mammary gland, BM, lung and kidney) generated by The Tabula Muris Consortium (Tabula Muris et al., 2018) were downloaded from https://ndownloader.figshare.com/articles/5829687/versions/7. The transcriptome of tissue immune cells of these two datasets was compared to evaluate the consistency for the expression profiles of tissue immune cells. (ii) Bulk RNA-Seq data of normal mouse tissue. To obtain the genes highly expressed in non-hematopoietic tissues, the bulk RNA-Seq data of 228 mouse non-hematopoietic tissues collected in our previously published work was used in this study. Since immune cells typically account for only a small proportion in non-hematopoietic tissues, genes highly expressed in these tissues were primarily contributed by some other non-immune cells. Therefore, it would be helpful to reduce the bias when removing those genes that are highly expressed in both immune cells and non-immune cells. The expression matrix for these 228 normal mouse tissues was available at https://figshare.com/articles/TissueSpecificDeconvolitionModel/8168120. (iii) Bulk RNA-Seq data of mouse immune organs. Transcriptome data of three immune organs (BM, spleen and peripheral blood) that had been previously used to evaluate our seq_ImmuCC model were also used here to validate the capability of the signature matrix. The expression matrix can be downloaded at http://wap-lab.org: 3200/immune/, and the raw fastq file at EMBL-EBI (www.ebi.ac.uk/arrayexpress) under accession number E-MTAB-6458. (iv) Aggregated single-cell expression data. To assess the performance of the tissue specific signature matrix, the aggregated single-cell expression data were generated from single-cell RNA-Seq data as previously reported (Schelker et al., 2017). Specifically, unique molecular identifier (UMI) counts from all the cells in each sample were added to form the bulk transcription of genes in that tissue. The scRNA-Seq data from seven tissues (lung, peripheral blood, BM, liver, spleen, small intestine and mammary gland) were used to construct the aggregated single-cell expression data. The aggregated single-cell expression data are available at Figshare https://figshare.com/articles/TissueSpecificDeconvolitionModel/8168120. (v) Flow cytometry data. The flow cytometry data measured in our previous work were used herein to evaluate the capability of the signature matrix. (vi) Software and codes. The R script of this approach was the same as our previously reported tool, which is available at GitHub: https://github.com/wuaipinglab/ImmuCC/blob/master/Microarray_Deconvolution.R. The tissue-specific signature matrices of this model are available at (GitHub: https://github.com/wuaipinglab/ImmuCC/tree/master/tissue_Immucc/SignatureMatrix).
2.3 Immune cell expression matrix construction
For each tissue, the transcriptome data of all the immune cells were extracted according to the annotation result of the tissue scRNA-Seq data. Based on the scRNA-Seq data of the tissue immune cells, the median expression of genes for each immune cell was calculated. Then, to ensure the expression value in the signature matrix was at the same scale as the cell number, the median expression of genes for each cell type multiplied by 1000 was used to represent its tissue expression level. Finally, the average gene expression of all the immune cells was used as the expression matrix of the tissue immune cells.
2.4 Signature gene selection
The RMSE between the predicted proportion, p and the real proportion, q, were used to evaluate the model performance. p: predicted proportion; q: real mixed proportion or flow cytometry determined proportion; n: number of immune cells.
2.5 Deconvolution algorithm
Several computational algorithms have been applied to estimate the relative proportions of different immune cells (Avila Cobos et al., 2018). Among these tools, a method called CIBERSORT has been shown to be robust to the background noise and resistant against multi-collinearity (Newman et al., 2015). This algorithm framework has already been validated and successfully applied in some single-cell sequencing data based deconvolution models (Frishberg et al., 2019; Newman et al., 2019; Schelker et al., 2017). Similar to other deconvolution algorithms, this method also assumes that the gene expression of heterogeneous tissues can be modelled as a linear summation of expression scales from all the cellular components. This relationship can be represented as A = BX, where A is the transcriptome data of the biological sample, B is the signature matrix for the expression of genes in all immune cells and X is the vector of relative proportions of all immune cells. By minimizing the residuals between BX and A with a support vector regression-based algorithm, the immune cell proportions in the tissue can be successfully inferred. Here, by integrating the tissue-specific signature matrix with the computational framework of CIBERSORT and ImmuCC, the tissue-specific computational approach named tissue-ImmuCC was constructed and used to determine the proportions of tissue immune cells.
2.6 Aggregated single-cell expression data evaluation
Seven aggregated single-cell expression datasets, for BM, peripheral blood, spleen, small intestine, lung, liver and pregnancy mammary gland, were constructed by aggregating the expression values of all the single cell data in that tissue (Supplementary Materials and Methods Section). After this, all aggregated single-cell expression data were deconvolved using the signature matrix that corresponded to these tissues. As the premixed proportion for each immune cell was known, the Pearson correlation coefficient (PCC) between the predicted result and the real mixed proportion was used to assess the computational efficiency.
3 Results
3.1 Overview of the tissue-ImmuCC approach
In this approach, it was assumed that the entire tissue transcriptome contributed and was linearly summed from the tissue’s cellular components. As gene expression of immune cells is shaped by tissue-specific factors, immune cells localized in different tissues present divergent expression profiles (Fig. 1a). With the cell cluster markers and single cell RNA-Seq data provided by Han et al. (Han et al., 2018), up-regulated genes for each cell type were determined (Fig. 1b and Supplementary Fig. S1). One good example is macrophages. Some already known macrophage associated genes were up-regulated for most tissue conditions, including Cd68, Adgre1, Ccl3, Cxcl2 and some others (Fig. 1b). In addition, it is worth noting that localized macrophages in different tissues also have their own specifically expressed genes. Due to these conditions, computation with a tissue-specific signature matrix was necessary to improve the performance of the model. Four major steps were used to construct the tissue-ImmuCC approach (Fig. 1c): (i) scRNA-Seq data preprocessing. The PCCs between tissue scRNA-Seq data and the reference transcriptome data of different cell types were calculated. The cell type with the highest PCC was used to label that cell (Han et al., 2018) (Materials and Methods Section). (ii) Quality examination. scRNA-Seq data of tissue immune cells were analyzed for the expression of some flow cytometry valid marker genes. (iii) Model construction. Different gene selection strategies were compared and evaluated to obtain the best signature gene matrix. By integrating the signature matrix with the deconvolution framework developed by the CIBERSORT team (Newman et al., 2015), the tissue-specific computation tool can be used to estimate the immune cell proportion from the transcriptome data. (iv) Model evaluation. The final model was evaluated using both aggregated single-cell expression data and flow cytometry data (see the Data Section in Materials and Methods Section).
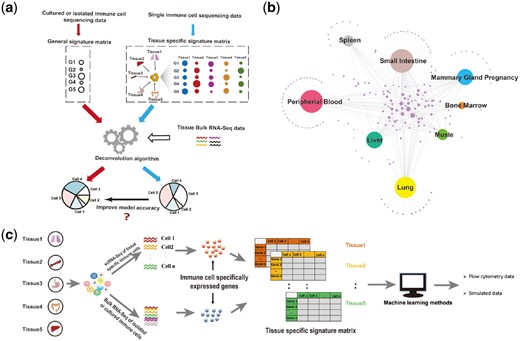
Schematic of the tissue-ImmuCC approach. (a) A sketch map of the limitations of the traditional deconvolution model and potential strategies of dealing with each. (b) Network relationship of macrophage specifically expressed genes derived from the scRNA-Seq data of eight tissues. Genes specifically expressed in each tissue were connected to the node representing that tissue. The area of the dot is proportional to their degree. (c) The workflow for the construction of the tissue-ImmuCC approach
3.2 Annotation of immune cells from tissue scRNA-Seq data
Sequencing data for immune cells, including B cells, T cells, γδ T cells, NK cells, neutrophils, eosinophils, basophils, mast cells, dendritic cells, macrophages and monocytes, were extracted from single-cell RNAseq datasets of tissues (Materials and Methods Section). Here, the transcriptome of tissue infiltrated immune cells from 39 mouse tissues including lung, BM and others, were extracted from their scRNA-Seq data (Materials and Methods Section). As shown in Figure 2a, immune cell constitutions across 39 tissues were successfully obtained. Consistent with prior knowledge, the adult mouse tissue was primarily composed of macrophages, whereas the neonatal body was dominated by granulocytes. For leukocytes, including B cells and T cells, relatively high cell abundances were observed in the spleen, thymus, small intestine, blood and mammary gland, which was consistent with our previously calculated results obtained from bulk RNA-Seq data (Chen et al., 2018). In addition, some immune cell types whose transcriptomes have been seldom reported were also observed in this dataset. For example, basophil cells were detected in multiple tissues including BM, blood, muscle and other tissues, which highlights the potential advantage of this method to discover rare tissue cell types.
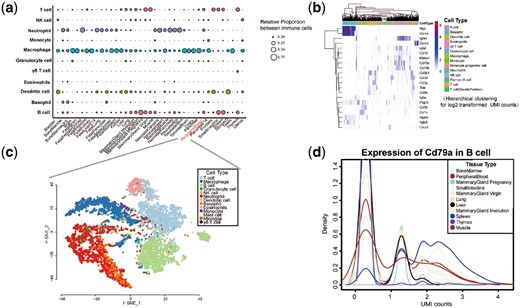
Characteristics of tissue immune cells identified from scRNA-Seq data. (a) Relative proportion of 11 immune cell types in 39 mouse tissues. (b) Hierarchical clustering for the expression of the selected custom marker genes in the scRNA-Seq data of peripheral blood immune cells (log2 transformed UMI counts). (c) A t-SNE visualization of scRNA-Seq data of peripheral blood derived immune cells. Cells are colored according to the cell type. (d) Distribution for the expression of CD79b in B cells across multiple tissues (log2 transformed UMI counts). The lines are colored by tissue type
After assigning scRNA-Seq data onto cell types, their expression features at the single cell level were investigated. Initially, custom marker genes of some immune cells that had been previously verified in both nucleic acid and protein levels were selected to examine their expressions in the scRNA-Seq data (ThermoFisherScientific, 2017) (Supplementary Table S1). In general, cell type-specific expression profiles were observed for these selected marker genes at the single cell level (Fig. 2b and Supplementary Fig. S2). For example, neutrophils in peripheral blood tended to have relatively high expression of Ngp and Camp, while B cells had significantly higher expression of Ighm, Cd79a, Cd79b and Ms4a1. In addition, similar to other scRNA-Seq data, most immune cell-specific marker genes had zero counts that were partially a result of the relatively low resolution of the scRNA-Seq technology. Next, to demonstrate the assigning efficiency, all immune cells in each tissue were visualized using the t-SNE method. The results indicated that immune cells assigned into the same cell type could be exactly classified into one group (Fig. 2c and Supplementary Fig. S3). The distributions of gene expression among different tissues were also generated and compared (Fig. 2d and Supplementary Fig. S4). For example, B cells could be classified into different groups according to their expression of CD79a. The proportion of cells with a relative high expression of CD79a in the spleen and mammary gland were larger when compared to other tissues. Additionally, the expression of CD79a was not observed in thymus tissue-derived B cells. Therefore, some gene expression levels of the same immune cell type originating from different tissues had significantly different distributions. Furthermore, the median expression level of genes in tissue immune cells used here (Han et al., 2018) was compared with another study for mouse tissue scRNA-seq data generated by The Tabula Muris Consortium (Tabula Muris et al., 2018) (Supplementary Table S2). As indicated in Supplementary Figure S5, a high consistency for the gene expression between these two different datasets was observed for most immune cells.
3.3 Evaluation of different selection strategies for signature genes
To reduce the interference of non-immune cell types, genes highly expressed in non-hematopoietic tissues had to be filtered out to obtain suitable signature genes. Three gene selection strategies were proposed and evaluated to yield a best set of signature genes according to the different sources of immune cell specifically expressed genes and non-hematopoietic tissues highly expressed genes (Fig. 3a). In the first strategy, ‘BuImm + TT_NonHema’, 162 signature genes selected in our previously developed seq-ImmuCC model were used (Chen et al., 2018). Here, the bulk RNA-Seq data of immune cells generated from the bulk immune tissues or in vitro cultured samples were used to obtain immune cell specifically expressed genes without considering their tissue specificity. Next, genes with a high expression level in the bulk RNA-Seq data of 146 non-hematopoietic tissues or cell lines were filtered out. The second strategy, ‘scImm + TT_NonHema’, involved deriving immune cell specifically expressed genes from the scRNA-Seq data and obtaining the non-hematopoietic highly expressed genes from the bulk RNA-Seq data. Tissue scRNA-Seq data were analyzed using the R package ‘Seurat’ for each tissue, and the marker genes for each immune cell cluster were extracted. By removing genes highly expressed in 146 non-hematopoietic mouse tissues or cell lines, tissue specific immune cell signature genes were selected. In the third strategy, ‘scImm + TS_NonHema’, the immune cell specifically expressed genes were the same as in ‘scImm + TT_NonHema’, whereas the definition of the non-hematopoietic highly expressed genes was different. For each tissue, only the genes highly expressed in their own bulk RNA-Seq data were filtered out from the immune cell specifically expressed gene sets, whereas genes highly expressed in other tissues were kept. As indicated in Figure 3b and Supplementary Figure S6, the signature genes selected in these three different strategies were largely different. For peripheral blood, only 44 genes were commonly selected using all 3 methods. Compared with the other 2 methods, there were 109 distinct signature genes selected by ‘BuImm + TT_NonHema’.
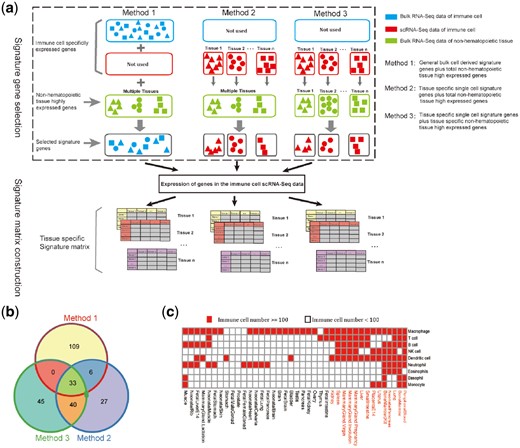
Overview of the different signature matrix construction strategies. (a) Diagram of the three different signature gene selection strategies and signature matrix construction. (b) Venn plot of the signature genes selected in peripheral blood using three different methods. (c) Source for the sequenced immune cell data in each tissue. The red squares indicate that the amount of immune cell sequencing data directly derived from that tissue was sufficient, whereas the white squares indicate the cell number is less than 100 and the peripheral blood derived immune cell was replaced (the scRNA-Seq data of eosinophils is not shown because it was not detected in the peripheral blood)
As the sequencing data of some immune cells were missing in many tissues of the scRNA-Seq data, the transcriptomes of these immune cells were replaced with the peripheral blood derived sequencing data (Fig. 3c). Finally, tissue specific signature matrixes for 14 mouse tissues were constructed, including lung, liver, spleen, small intestine and others. In the BM, peripheral blood, lung and neonatal pancreas, transcriptome data of immune cells were detected for most of the cell types. For the other nine selected tissues, only expression profiles approximately five out of nine immune cells were detected from the scRNA-Seq data of those tissues. To examine the potential bias, the lung was used as a representative tissue to test the effect of mixing blood immune cell data. It has been observed that the predicted proportions were not affected for most immune cell types except for two major tissue residential immune cells, including macrophage and dendritic cells. As illustrated in Figure 3c, the transcriptome data of these immune cells was detected in most of our selected tissues and did not need to be replaced.
After signature gene selection, the expression of signature genes across different immune cells were taken as the correspondent signature matrix, and the tissue specific signature matrixes designed from these three different methods were validated using both the bulk RNA-Seq of three immune organ and the correspondent flow cytometry data (Data Section). As indicated in Supplementary Figure S7, regardless of the quantification units used for testing the data, a lower RMSE in ‘BuImm + TT_NonHema’ was observed when both the training data and the testing data were from the same origin. In addition, the other two gene selection strategies yielded relatively poor results. Finally, ‘BuImm + TT_NonHema’ was chosen for the latter analysis, and the signature genes used in each tissue were the same.
The gene segments in the scRNA-Seq were counted using UMI counts, whereas the quantification methods primarily used in the bulk RNA-Seq were the read counts, FPKM and TPM. To examine which expression units used in the bulk RNA-Seq would be more suitable for this tissue specific model, the performances of these three different counting methods were compared. As shown in Supplementary Figure S7, in ‘BuImm + TT_NonHema’, the FPKM and TPM-based model performed better in PBMCs and the spleen (SP), whereas a slightly lower RMSE was seen for BM using the read counts based model. However, for ‘scImm + TT_NonHema’ and ‘scImm + TS_NonHema’, no significant improvement was seen in all three tissues. In summary, the FPKM or TPM based quantification method for the bulk RNA-seq data plus ‘BuImm + TT_NonHema’ achieved the best performance.
Finally, the potential bias when replacing the transcriptome of missing cell types with the peripheral blood cell types was evaluated. By replacing the tissue specific immune data with blood cell immune data, the PCCs between the predicted immune cell proportion and the real mixed proportion were used to evaluate the bias. Then, with this new generated signature matrix and the aggregated single-cell expression data of lung, the relative proportion for each immune cell was calculated. It has been observed that the predicted proportion will not be affected for most cell types except for tissue residential immune cells, including macrophages and dendritic cells (Supplementary Fig. S8). As illustrated in Figure 3c, the transcriptome data for these two immune cells was detected in most of the selected tissues. Therefore, it is reliable when replacing the transcriptome of some other immune cells with the blood derived immune cells.
3.4 Evaluation of tissue-ImmuCC on different tissues
After using the signature gene matrix and using it for further deconvolution, the performances of tissue specific models were tested with training data and testing data that were not from the same tissue. Seven aggregated single-cell expression datasets were deconvolved with seven tissue specific models. The PCCs between the predicted immune cell proportions and the premixed proportions were calculated. As indicated in Figure 4a, the PCCs ranged from 0.94 to 0.99 when the testing data and training data were from the same tissue. However, when tissue specific models were used for other tissues, the PCCs were nearly all lower than 0.5. With respect to each tissue expression data, the proportions of five immune cells, including neutrophils, macrophages, dendritic cells, T cells and B cells, were estimated using the tissue specific signature matrix and these were more consistent with the real proportions (Fig. 4b and Supplementary Fig. S9). When applying these models on BM data, the largest cell group was neutrophils in the BM model, accounting for 45.03% and the dominant immune cell in the other models was dendritic cells (38.61 ± 7.08%) and T cells (23.89 ± 14.08%). For instance, the PCC was 0.51 when liver transcriptomic data was used in the lung-specific model. Taken together, better performance was observed when both the training data and testing data were derived from the same tissue type.
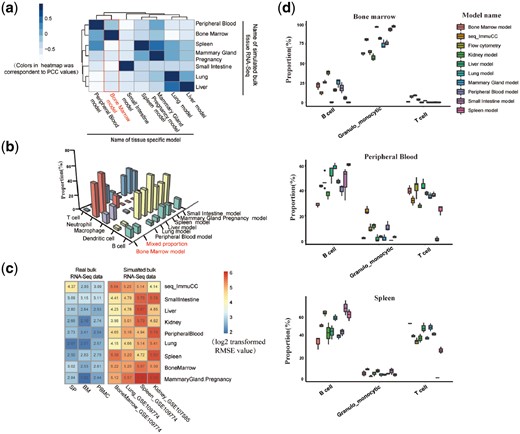
Comparison of the performance of seven tissue-specific models’ different tissue transcriptomic data. (a) Evaluation for tissue-specific model using the aggregated single-cell expression data. Pearson correlation between the predicted proportions and the real mixed proportions was used to represent the performance. The row shows the name of the tissue-specific model, and the column lists the tissue name of the aggregated single-cell expression data. Blue corresponds to a high PCC value, and white corresponds to a lower value. (b) Evaluation of the performance of the tissue-specific model in the aggregated single-cell expression data of BM. A 3D bar plot was used to show the predicted and real mixed immune proportions. (c) Evaluation of the performance of both the tissue-specific model and seq_ImmuCC with five tissue transcriptome datasets (three real bulk RNA-Seq datasets and four aggregated single-cell expression datasets). The RMSEs between the predicted proportions and the real proportions were used to evaluate performance. (d) Comparison of the performance between the tissue-ImmuCC and seq-ImmuCC in three mouse tissues. Both the tissue-ImmuCC and seq-ImmuCC estimated proportions were compared with the flow cytometry measured proportion
Next, this tissue-specific model was applied to four aggregated single-cell expression data derived from other datasets. As illustrated in Figure 4c, compared with the previous bulk model seq-ImmuCC, a lower RMSE was observed when both the training data and testing data were derived from the same tissue type. However, it should be noted that a generally acceptable result was still observed in some cases when the tissue used for building the training data and the tissue used to generate the aggregated single-cell expression data were not same. For example, in kidney tissue under the accession number GSE107585, a similar RMSE value was seen in both the liver model and the kidney model. This may indicate the possibility of using the tissue specific model for cross use under some conditions.
3.5 Comparison of tissue-ImmuCC with the traditional model
To evaluate the performance in real applications, the tissue-ImmuCC was compared with our previously developed seq-ImmuCC model that was derived using only bulk data (Chen et al., 2018). Three immune tissues, SP, BM and PBMC, were used for this analysis that compared the predicted results with experimentally measured data (Fig. 4d). In BM, values for B cells and granulo_monocytes calculated using tissue-ImmuCC were 21.76 ± 5.09% and 76.90 ± 4.86%, respectively, which was more consistent with the percentage of experimentally measured B cells (26.34 ± 1.60%) and granulo_monocytes (64.61 ± 2.59%). In peripheral blood, a modest improvement was observed by using tissue-ImmuCC for granulo_monocytes (14.49 ± 4.89%) and T cells (36.70 ± 2.21%) when compared with the seq-ImmuCC estimated result (23.95 ± 3.37% for granulo_monocytes and 32.06 ± 3.86% for T cells). However, the cytometry detected proportions were 9.62 ± 2.55% and 42.92 ± 6.63%, respectively. Furthermore, for the spleen, the B cell proportion returned by using tissue-ImmuCC was 61.23 ± 5.78%, which was closer to the experimental value (63.2 ± 2.20%) compared to the seq-ImmuCC calculated result (50.87 ± 1.79%). Simultaneously, in terms of the granulo_monocytes, poor performance was observed for these two computational models (8.24 ± 1.16% in seq-ImmuCC and 11.65 ± 1.87% in tissue-ImmuCC). In summary, the tissue-ImmuCC approach displayed slightly improved performances compared to the bulk only derived seq-ImmuCC model for three tested tissues.
4 Discussion
By combining the transcriptomic information of signature genes across each immune cell and a suitable computational framework, tissue immune cell constitution can be directly estimated from its expression profile. For traditional computation tools, the attention has primarily been focused on how to optimize the capability of different machine learning methods. As is well known, model accuracy may also be determined by the training data, with the exception of algorithms. Limited by previous transcriptomic analysis technologies, immune cells used to profile their expression were primarily isolated from immune organs including the blood, spleen, BM, lymph nodes and other tissues. Thus, in previous models, a single signature matrix was applied to different tissue transcriptomic data. However, immune cells that are localized in different tissues may possess distinct expression profiles. Therefore, bias will be introduced when the transcriptomic data of immune cells used for model training are not consistent with the sample tissue. In this study, a training data curation and selection approach has been tested using scRNA-Seq data to address this problem. Using tissue scRNA-Seq data, tissue-specific training data were constructed using their own immune cells. Different from previous models, the training data in tissue-ImmuCC is composed of several tissue specific signature matrices. After the application of the tissue-ImmuCC approach on both synthetic data and experimental data, the model’s performance under various conditions was evaluated.
In terms of the signature matrix, both the cell types in the column and the selected signature genes in the row contribute to the accuracy and range of application of this model. First, for cell types in the tissue-specific signature matrix, the tissue-ImmuCC approach developed here can be used to predict the proportion of major immune cells, including T cells, B cells, NK cells, macrophages, dendritic cells, monocytes and other cell types. Moreover, immune cells like basophils, whose transcriptomic information is rarely reported, were successfully captured in some tissue scRNA-Seq data. Thus, relative to traditional transcriptomic analysis methods, scRNA-Seq is helpful for comprehensive learning of rare immune cells. However, it should be noted that some immune cells were missed in several of the tissue scRNA-Seq datasets (Fig. 3c). In addition, except for the major immune cell types, further information concerning immune subtypes including CD4 T cells, CD8 T cells, γδ T cells and others will also be useful for understanding immune functions. The cell preparation method in our datasets consisted of directly harvesting single cells from the total cells without prior sorting. As immune cells only account for a small proportion of all cells in non-immune organs, it is difficult to capture enough immune cells using routine experimental techniques. To extend the application of the tissue-ImmuCC approach, the enrichment of immune cells should be conducted to obtain enough sequencing data for immune cells.
Obviously, signature genes are another important constituent of the signature matrix. In the present study, signature genes identified from both the traditional bulk RNA-Seq data and tissue scRNA-Seq data were selected, and the performance of these models was compared. Unexpectedly, the bulk RNA-Seq data-derived signature genes exhibited better performance than gene sets obtained from scRNA-Seq data. Generally, the bulk RNA-Seq data represent the average value among multiple cells and may be more robust than scRNA-Seq data. Because all of the tissue single cells are sequenced without the enrichment of immune cells, the cell number in most tissue scRNA-Seq data is not sufficient. Also, as the sequencing depth was somewhat low in this dataset (each cell was sequenced at approximately 3000 reads/cell), immune cell expression information may not be fully captured. Therefore, transcriptomic analysis with a larger number of cells and deeper sequencing may result in a more comprehensive picture of gene expression. Furthermore, research has shown that datasets collected from a single platform or only from healthy individuals will introduce unwanted biological and technical noise (Vallania et al., 2018). Thus, integrating the transcriptomic data profiled on multiple platforms and including both the scRNA-Seq and the bulk RNA-Seq will be beneficial for obtaining a more robust result.
In addition to the training data, the quantification method used for the testing data will also have an impact on model performance. The algorithm framework used in most deconvolution tools has been developed based on a linear model. It has been reported that TPM based quantification methods can best mimic the linearity of tissue components in bulk RNA-Seq (Jin et al., 2017). Different from traditional bulk RNA-Seq, the UMI counts-based quantification method was applied in this study to single-cell sequencing data. The results showed that the tissue-ImmuCC, the gene length scaled quantification method that included FPKM and TPM resulted in a better performance when signature genes were obtained from bulk RNA-Seq data. However, a slightly lower RMSE was observed when the read counts-based model was applied to BM. In summary, these results indicate that further validation of the linearity in the scRNA-Seq data is still needed, because the expression value generated using different quantification methods was in different units.
Previously, a model named seq-ImmuCC developed by us has demonstrated the ability to estimate the composition of ten immune cells from mouse RNA-Seq data. However, the immune cell transcriptome collected from multiple tissues, including peripheral blood, spleen, lymph node, BM and others, was combined to construct this model without considering tissue origins. Primarily, the transcriptome of some tissue residential immune cells will be shaped by the tissue-specific regulators. Due to limitations of the experimental detection technology, it was difficult for us to view the expression profile of rare cells using the bulk RNA-Seq method. To reduce the bias produced under various tissue microenvironments, the tissue-specific gene expression for each immune cell was used in this tissue-specific signature matrix. The tissue-ImmuCC approach was then compared with the previously reported seq-ImmuCC (Chen et al., 2018), whose signature matrices were developed from the bulk RNA-Seq data of immune cells. The model performances were compared for three immune tissues. The tissue-ImmuCC approach showed a modest improvement. However, a relatively worse result was seen for T cells in BM. A possible explanation may be that the sequencing depth for the scRNA-Seq data were somewhat low, which made it difficult to distinguish those cells from other cells. Also, as the scRNA-Seq data were composed of both immune cells and non-immune cells, this may have resulted in the sequence data not fully representing tissue immune cells. Thus, further sequencing for CD45 positive cells will be needed to improve upon this study. It should be noted that the immune cell data used in seq-ImmuCC were primarily from immune tissues that included blood, BM, spleen and other tissues (Chen et al., 2018). Relative to other non-immune tissues, immune cells localized in these tissues may share a similar transcriptome. In addition to these immune tissues, we also applied this model to the aggregated single-cell expression data of other non-immune tissues. Compared with seq-ImmuCC, a modest improvement was observed in this tissue-specific model in respect to the RMSE values. However, limited by the validation data, only 5 out of 14 mouse tissues selected in our signature matrix were used to assess this tissue-specific model. Thus, further application of tissue-ImmuCC on other non-immune tissues will assist in the evaluation of the model’s performance.
In addition to discrete cell types, the expression trajectory from naïve states to terminal differentiation states can also be constructed from single-cell sequencing data. By analyzing the transcription dynamics at the single cell level, the trajectory of cell differentiation can be successfully constructed. Recently, studies have shown that the cellular abundance over the entire differentiation space can be successfully estimated with a single-cell sequencing-based expression profile for continuous cell states (Frishberg et al., 2019). Limited by the amount of sequenced single cell data, it would be difficult to build a complete differentiation route for each immune cell in these datasets. The scRNA-Seq data for each cell type was merged to represent its expression information without considering that type’s localization in the entire differentiation route. Therefore, further sequencing of more immune cells will be useful to construct a complete transcriptome profile across different cell states. By integrating this strategy with our tissue-specific approach, the tissue immune cell composition can be viewed from multiple perspectives.
In summary, this study explored some uncertainty issues that have resulted from the application of scRNA-Seq data. Due to limitations caused by the amount of sequencing data, tissue-ImmuCC can only be partially implemented in mouse tissues. Conceivably, with the comprehensive application of single-cell technologies such as scRNA-Seq and mass cytometry, tissue immune cells under various conditions will be more accessible. Due to the model construction framework developed in this study, the application of these tools can be easily expanded.
Acknowledgements
Z.C. and A.W. conceived and designed this study. Z.C., X.Q. and A.W. analyzed the data and results. C.J., W.L. and Q.S. contributed to the discussion and analysis of the studies. Z.C. and A.W. wrote the manuscript. All authors have approved of the final manuscript.
Funding
This work was supported by the following funding: (i) The National Key Plan for Scientific Research and Development of China (2016YFD0500301), (ii) The CAMS Initiative for Innovative Medicine (2016-I2M-1-005), (iii) The Six-talent Peaks Project in the Jiangsu Province (SWYY-169), (iv) The Jiangsu Provincial Natural Science Foundation (BK20161245), (v) The Open Project Program of the National Laboratory of Pattern Recognition (NLPR) (201900004), (vi) The Non-profit Central Research Institute Fund of Chinese Academy of Medical Sciences (2018RC310022) and (vii) Central Public-Interest Scientific Institution Basal Research Fund (2016ZX310195, 2017PT31026 and 2018PT31016).
Conflict of Interest: none declared.
References
ThermoFisherScientific. (

