


Abstract
There are very few methods for de novo genome assembly based on the overlap graph approach. It is considered as giving more exact results than the so-called de Bruijn graph approach but in much greater time and of much higher memory usage. It is not uncommon that assembly methods involving the overlap graph model are not able to successfully compute greater datasets, mainly due to memory limitation of a computer. This was the reason for developing in last decades mainly de Bruijn-based assembly methods, fast and fairly accurate. However, the latter methods can fail for longer or more repetitive genomes, as they decompose reads to shorter fragments and lose a part of information. An efficient assembler for processing big datasets and using the overlap graph model is still looked out.
We propose a new genome-scale de novo assembler based on the overlap graph approach, designed for short-read sequencing data. The method, ALGA, incorporates several new ideas resulting in more exact contigs produced in short time. Among these ideas, we have creation of a sparse but quite informative graph, reduction of the graph including a procedure referring to the problem of minimum spanning tree of a local subgraph, and graph traversal connected with simultaneous analysis of contigs stored so far. What is rare in genome assembly, the algorithm is almost parameter-free, with only one optional parameter to be set by a user. ALGA was compared with nine state-of-the-art assemblers in tests on genome-scale sequencing data obtained from real experiments on six organisms, differing in size, coverage, GC content and repetition rate. ALGA produced best results in the sense of overall quality of genome reconstruction, understood as a good balance between genome coverage, accuracy and length of resulting sequences. The algorithm is one of tools involved in processing data in currently realized national project Genomic Map of Poland.
ALGA is available at http://alga.put.poznan.pl.
Supplementary data are available at Bioinformatics online.
1 Introduction
Advances in next-generation sequencing (NGS) technologies, which reduce time and cost of producing billions of short sequences in a single run, led to rapid increase of sequencing data. The first NGS technology, 454 sequencing, has been currently superseded by a newer NGS platform, Illumina and single-molecule sequencing (SMS) technologies for producing long reads (Ameur et al., 2019). NGS still gives reads of much higher quality than SMS and, together with high accessibility of genomic data, results in many different applications: creation of population studies of genetic variation (1001 Genomes Consortium, 2016; Siva, 2015), DNA methylation (Kawakatsu et al., 2016) and metagenomic studies (Pereira-Marques et al., 2019). Many applications have also been developed in the context of bioforensics, biosurveillance and infectious disease diagnostics, see, e.g. the recent survey (Minogue et al., 2019).
However, many organisms still do not have their genomes recognized, and those that already have a reference genome have gaps in it due to high repetition rate or limitation of sequencing technologies. Thus, a lot of effort is put into de novo genome reconstruction (de novo sequence assembly), which bases only on the information about reads reported by a sequencer. Matching the reads together, nowadays hundreds of millions at once, is done by finding pairs of overlapping reads. Such a reconstruction of a genome is characterized by high demand on computational resources and is realized on the basis of assembly graphs: overlap/string graphs or de Bruijn graphs. Paths in such graphs represent larger fragments of a chromosome.
The computational model of overlap graphs was historically first among those related to DNA sequencing problems. Its origin dates back to 1988, when Lysov and co-authors proposed a graph model for the problem of DNA sequencing by hybridization (Lysov et al., 1988). There, every oligonucleotide was represented by a vertex of the graph, and directed edges corresponded to possible overlaps of the oligonucleotides. For years, the model was adjusted to new requirements; oligonucleotides were replaced by reads produced by sequencers, in overlaps one had to take into account inexact matches due to sequencing errors, and the process of sequence reconstruction moved to the higher level of DNA sequence assembly. However, the basic graph remained more or less the same.
The overlap graph model is a straightforward conceptualization of the real-world process and works well as long as the sequencing data are not too large. The necessity of representing whole sequences in the graph and calculating inexact sequence alignments for most of pairs of the sequences makes the computational process very time and memory consuming (Blazewicz et al., 2018). The literature reports cases where assemblers from this group did not finish computations for greater datasets because of excessive memory requirements (Gonnella and Kurtz, 2012; Kajitani et al., 2014). Long processing time of such assemblers is also often reported in the literature (see, for example, supplementary material for Assemblathon 2, Bradnam et al., 2013). Subsequent propositions in this research area were aimed at shortening the time and reducing memory usage, usually at the cost of completeness of information kept (Gonnella and Kurtz, 2012; Ilie et al., 2014; Kececioglu and Myers, 1995; Myers et al., 2000; Simpson and Durbin, 2012; Swiercz et al., 2018; some of them refer to a similar concept of string graphs). Among the most significant improvements, one may point the resignation from the dynamic programming algorithm in favor of heuristic methods calculating the sequence alignment or alignment-free sequence comparison, a strict selection of pairs of sequences undergoing the comparison procedure, or reduction of the resulting graph.
In the meantime, the main research thread in DNA sequence assembly directed to the so-called de Bruijn graph model. It was proposed in 1989 by Pevzner for solving sequencing by hybridization (Pevzner, 1989) and later applied to de novo sequence assembly (Bankevich et al., 2012; Idury and Waterman, 1995; Kajitani et al., 2014; Luo et al., 2012; Pevzner et al., 2001; Zerbino and Birney, 2008). For the latter purpose, reads are decomposed into a series of overlapping subsequences (k-mers, where k stands for their length), each one represented by a directed edge in the graph, and vertices represent their prefixes and suffixes of length k − 1. In such a graph, only exact matches of sequences kept in vertices are assumed, sequencing errors are handled by allowing a k-mer to occur in different versions. A gain in efficiency of computations is achieved by a much lower volume of stored information and a smaller traversed graph, but mainly by discarding inexact matches. On the other hand, quality of resulting contigs diminishes a bit due to the sequence decomposition to k-mers, as the information about whole reads is partially lost (Blazewicz et al., 2018).
Taking into account all the practical constraints, de novo reconstruction of a DNA sequence in genome scale from NGS reads was done in most cases via an assembler based on the de Bruijn graph approach. Assemblers representing the overlap graph model often worked too long; moreover, they might not finish their computations because of memory limitation. Nowadays, however, the latter approach comes back to practice. There is a strong recommendation to use this graph model when reads are long, as the information lost following the decomposition in the de Bruijn graph approach is then more problematic. But even for shorter reads, there is a need to obtain more accurate results. Our new proposition for short-read data, assembler ALGA (ALgorithm for Genome Assembly), is to exploit such a potential of the overlap graph approach with reasonable time and memory usage. We realize this, among others, by switching to bit representation of data and substitution-based error model, using hash values instead of strings in comparing reads, removing transitive connections in advance, and solving iteratively the minimum directed spanning tree problem as a part of graph reduction.
It is worth noting that ALGA can be used without setting any parameter by a user. The parameters of ALGA are adjusted internally by the algorithm on the basis of input data. We left only one optional parameter, the maximum allowed error rate in overlaps of reads, with its default value 0 that gives good results in the case of most datasets.
2 Algorithms
De novo reconstruction of a genome sequence from NGS reads requires no additional information besides sets of reads, paired or not. At the level of sequence assembly, it brings a series of disjoint contigs (contiguous segments of a genome), later on, at the level of scaffolding, possibly combined into longer structures (scaffolds) basing on the information about pairing of reads. Our new method, ALGA, realizes this process at the level of sequence assembly and follows the traditional overlap-layout-consensus strategy. After feasible overlaps between pairs of reads are established, an overlap graph is built, and paths covering the graph are looked for. Finally, the paths are translated to nucleotide sequences, i.e. contigs. These computational problems are solved through a series of constituent algorithms.
2.1 Preprocessing
Reads from a dataset are first corrected by Musket, an external tool based on a k-mer analysis (Liu et al., 2013) (values of parameters given in Supplementary Material). Musket is dedicated to Illumina reads and identifies erroneous positions basing on frequency of k-mers in a dataset; if necessary, it can be replaced by another correcting tool. Our observation how such corrected reads overlap gave us a reason to trim reads from both ends in ALGA by three nucleotides. Although many errors are corrected by Musket, ends of poor quality still tend to contain errors, and such additional trimming helps us to get better results. Filtering of input dataset is realized in ALGA by rejecting all reads composed periodically of a fragment not longer than 20. Such reads are sources of unwanted substructures in an overlap graph, leading to forks that do not reflect really different contigs. Reduction at this stage makes our final graph simpler with very slight loss of information. Finally, reads being duplicates or prefixes of other reads are removed, thus also suffixes, as we include reverse complementary forms of reads. It is done quickly via creating the longest common prefix array for sorted lexicographically reads, where the string comparison is realized with bitwise operations.
2.2 Data encoding and error model
We identified high memory usage as the most significant problem of the overlap graph approach. Our basic decision was to encode each position of nucleotide strings on two bits. This gives us the possibility to encode four nucleotides and the appearance of other characters in strings we solve in steps. Subsequent steps of the preprocessing stage remove or correct most of unwanted characters. All remaining characters outside the 4-letter nucleotide alphabet are then replaced by one of the letters. Because such positions are not too numerous, this gives us information accurate enough to assemble. It also goes along with the error model we realize, where only substitutions of nucleotides are allowed. Although indels in reads are also possible, substitutions are more frequent sequencing errors in Illumina technology and the appearance of ‘N’s in the strings better matches substitutions. This is another point on the way to optimize the method, as aligning strings with indels is very costly from the computational point of view. By switching to the bit representation of nucleotide sequences and the error model restricted to substitutions, we gain a lot regarding time at every stage of computations.
2.3 Graph construction
As ALGA was intended to solve genome-scale datasets with acceptable memory usage, possibly on personal computers, the overlap graph had to be created as sparse as possible. At the same time, we wanted to keep the whole valuable information, thus to reject only edges duplicating some connections. At the current stage of the algorithm, we restrict our attention to transitive edges.
In the graph, every read outgoing the preprocessing step constitutes a vertex, as well as its reverse complementary counterpart. Reads of different lengths are allowed. Two vertices are connected by a directed edge if they have a prefix-suffix connection acceptable due to two parameters: minimum overlap area, automatically set to 55% of the average read length, and error rate of the overlap, the parameter defined by a user (optional, set to 0 by default). For each pair of reads, one best connection is stored, which is the one representing the greatest possible overlap, and the edge is weighted by the offset of the overlap (i.e. the distance between beginnings of the reads in the overlap). First, errorless overlaps are collected. We start with the shortest possible overlap area and systematically increase it by one after checking all pairs of reads for exact overlaps of the current length. Prefixes and suffixes of reads are processed as hash values instead of strings. This enables us to extend each prefix and suffix in time O(1) using a rolling hash function. In order to find, for each read a, all reads b with a given property, we keep all suffixes on a custom-made hash map. This way, each valid pair (a, b) is found in O(1) time, and the algorithm is able to construct the graph in time O(n × m), where n stands for the number of reads and m for the average read length, which is the optimal bound.
Such a graph, if constructed without further constraints, could be extremely large. This is due to the presence of a huge number of transitive edges. They can surpass irreducible edges by a factor of O(m) or greater if the genome contains a large number of identical, repeated regions. A connection of two overlapping reads a and c resulting in a longer sequence s is expressed by a transitive edge in the graph, if there is another read b that can be inserted, with proper overlaps, in between a and c with the same sequence s as a result. These connections are present in the overlap graph as three edges (a, c), (a, b) and (b, c). The reduction of transitive edges is made as soon as edges being a better choice are found, immediately after finding the second edge of a proper triplet, see Figure 1; this, however, comes at a cost of some additional computation. Such an action is supported by the implementation we chose, i.e. the systematic increase of the overlap area with the use of the rolling hash function. This way we avoid a peak in memory usage, observed in other algorithms with a natural reduction of transitive edges, applied after collecting in a graph all edges of a triplet.
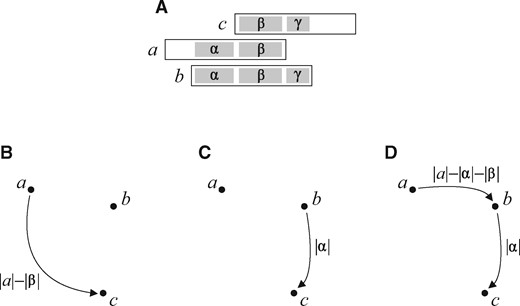
An example of the construction of a sparse graph. (A) Three overlapping reads. (B) The algorithm starts with the overlap area set to its minimum value and increases it once overlaps of such a length have been checked within the whole dataset. The first found edge is (a, c), weighted by the appropriate offset. (C) After increasing the overlap area to , edge (b, c) is found, and it replaces (a, c) recognized at this moment as a transitive edge because of the presence of the supplementing connection from a to b. This connection can be quickly checked with bitwise operations, for the offset between a and b is already known. (D) Edge (a, b) is added once the overlap area rises to
After that, we admit overlaps with errors (if set up by a user). It is assumed that erroneous positions cannot be located within first or last three nucleotides of reads, as a difference in such regions usually means growing distance and an incorrect path. Connections from vertices with outdegree 0 to ones with indegree 0 are searched for with a method based on a k-mer comparison of reads, where k is set to 35. We divide each read into six equal (roughly) segments, select one least lexicographically k-mer per segment (it can project beyond a segment), and efficiently check via dynamic programming all pairs of candidates containing at least one common k-mer. In order to make this procedure alphabet-independent, we execute it four times with different ‘lexicographical’ orders assumed: (A, C, G, T), (C, G, T, A), (G, T, A, C) and (T, A, C, G). Edges representing those pairs that overlap in such a way that user’s parameters are satisfied are added to the graph.
2.4 Graph simplification
In order to create contigs, the overlap graph built in the previous stage needs to undergo a few simplification steps that transform it to the state where every single edge represents a candidate for a final sequence.
2.4.1 Neighborhood reduction
Some vertices in the graph have more numerous neighborhood (in the sense of outgoing edges) than the others. As long as their neighbors fit them tightly, all the connections are important. However, loose connections accompanying the tight ones can worsen quality of contigs. In ALGA, we treat a connection as tight if it represents the overlap area of length at least 1.4 of the minimum overlap area. All such edges are kept, and if there are at least three such outgoing edges at a vertex, other edges representing loose connections from this vertex are removed. Otherwise, we keep at the vertex some outgoing edges representing loose connections, to the total number of three edges leaving the vertex (if possible), and the ones representing the greatest overlap area are selected.
2.4.2 Triangle inequality rule
Another simplification step is based on the triangle inequality. It is for further reduction of transitive edges, this time identified in a broader range. During the graph construction, these transitive edges which exactly covered other existing connections have been discarded. Now, we accept for reduction all edges violating the triangle inequality, i.e. of a weight not lower than the sum of weights of its constituent edges: edge (a, c) of weight w is removed if there are edges (a, b) and (b, c) of weights w1 and w2 such that . Currently, matching of reads is not examined.
2.4.3 Short parallel paths
Transitive edges together with their alternative edges are small examples of more general structures, parallel paths. If such paths are short, they usually represent more or less the same sequence of nucleotides as their counterparts or one of them is a shortcut of the other. Removal of short parallel paths (structures also known as bubbles) is a procedure known from assemblers based on the de Bruijn graph approach (e.g. Zerbino and Birney, 2008). Although such a graph is different from the overlap graph, the latter also can have parallel paths, and they also can arise from sequencing errors. Our procedure for removing short parallel paths solves iteratively the minimum directed spanning tree problem in a local subarea. This way we identify edges which can be deleted without loss on contiguity of a solution.
For each vertex a having at least two outgoing edges, a subgraph Sa is identified, induced by a subset of vertices reachable from a via a directed path not longer than a given value D (in ALGA equal to 250% of the average read length). More formally, for graph , has as a vertex set and as an edge set, where means the shortest distance from a to b measured in weights of edges of the path (with ). Next, all edges belonging to Sa are removed from G, and a part of them is added back according to the following rule. Elements of I are sorted in the non-decreasing order by weight, and every taken in this order is added back to G unless there is such that . This way we leave in G edges composing a minimum directed spanning tree of Sa rooted at a and, as a result, from among alternative paths in this subarea, the one with the lowest relative weight is preferred.
There is an exception in this procedure. If Sa contains a directed cycle, we do nothing with edges of Sa in this step; this is for retaining structures representing short repetitions within a genome. However, some edges of Sa can be removed from G in an iteration of the procedure executed for other vertex, see Figure 2.
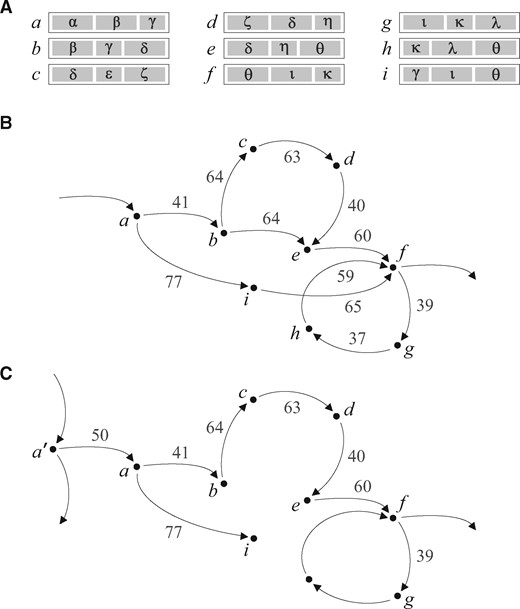
Solving the minimum directed spanning tree problem in a local subarea. (A) Reads from the example. (B) Subgraph Sa identified in a larger graph for vertex a, here . Sa contains a directed cycle and no edge is deleted in this iteration. (C) Result of the reduction for subgraph identified for vertex . Vertex h is not reachable from within distance D, so edges (g, h) and (h, f) do not belong to
2.4.4 Dead-end branches
Execution of the procedure for removing short parallel paths leaves in the graph a lot of short dead-end branches [as, for example, edge (a, i) in Fig. 2C], also called tips. We remove them all by setting the maximal length of the dead ends to be removed to value D, the same as in the previous procedure. At every fork, if all outgoing (incoming) paths are not longer than D, the longest one is treated as the main path and retained.
2.4.5 Path compression
Directed paths between forks are compressed to single edges according to the following conditions. Each path , where ( or ) and ( or ) and (, ), is replaced by edge ; and stand for the numbers of incoming and outgoing edges at a vertex, respectively. Weights of the compressed edges are set to weights of the corresponding paths (being sums of weights of their constituent edges). Information about components of the original paths is kept.
2.5 Graph traversal
Candidates for final sequences (contigs) are nucleotide sequences corresponding to edges in the transformed overlap graph. Single edges can be merged into longer structures. This situation occurs when there are edges (a, b) and (b, c) long enough (in ALGA defined as at least twice the average read length), where and there exist paired reads r1 and r2 such that r1 is a fragment of a sequence represented by (a, b) and r2 is a fragment of a sequence represented by (b, c). From among alternative traversals through a vertex b this one is chosen which is confirmed by a greater number of pairs r1, r2. In order to avoid duplicated sequences, corresponding to complementary strands of a DNA fragment, candidates for contigs are compared with already accepted contigs. The candidates are rejected if they are too similar to any sequence stored so far. In ALGA, the level of similarity is set to 95% measured in vertices of compared uncompressed paths. The similarity is determined with taking into consideration also vertices corresponding to reverse complementary versions of reads. Finally, in order to minimize mismatch rate, contigs are trimmed from both sides so that each nucleotide is covered by at least three reads.
3 Results
In the computational experiment, ALGA was compared with assemblers highly rated in scientific community: Velvet (Zerbino and Birney, 2008), SGA (Simpson and Durbin, 2012), SOAPdenovo2 (Luo et al., 2012), SPAdes (Bankevich et al., 2012), Readjoiner (Gonnella and Kurtz, 2012), Platanus (Kajitani et al., 2014), MEGAHIT (Li et al., 2015), SAGE2 (Molnar et al., 2018) and with our previous assembler GRASShopPER (Swiercz et al., 2018). Altogether, we have five assemblers based on the de Bruijn graph approach (Velvet, SOAPdenovo2, SPAdes, Platanus, MEGAHIT) and five based on the overlap/string graphs (SGA, Readjoiner, SAGE2, GRASShopPER, ALGA). Only the assembly stages of the packages were compared (a few of them also have a scaffolding module). Versions of the programs, web pages with source code and values of parameters used in the experiment are specified in Supplementary Material (including other programs supporting the computations). In Section 3.1 a wide comparison of the assemblers is made, Section 3.2 describes additional tests with a whole human genome dataset.
3.1 Comparison with other assemblers
Characteristics of datasets used in tests are summarized in Table 1. They all were produced by an Illumina sequencer according to the paired-end protocol, for whole genomes of nematode C.elegans, plant A.thaliana, alga C.sorokiniana, bacteria E.coli and Microthrix parvicella and for chromosome 14 of H.sapiens. The length of chromosome 14 is approx. 107 Mbp, but due to a large gap of unknown nucleotides (N) at the beginning, its effective length is shorter as reported in the table. A few assemblers benefited from read correction made by Musket (Liu et al., 2013), which is based on analysis of frequencies of k-mers within a dataset. We performed tests for all assemblers in two configurations: with and without the correction made by Musket, and took to the comparison this configuration which gave better results. Assemblers which benefited from the Musket correction are SOAPdenovo2, Readjoiner, SAGE2 and ALGA. It should be noted, that the authors of SAGE2 recommend to make the read correction by their own program Racer; however, Musket gave better results with SAGE2 (on average). All references for the datasets are given in Supplementary Material.
Characteristics of datasets used in the comparison
| G [Mbp] | N [M] | R [bp] | I [bp] | D | |
|---|---|---|---|---|---|
| H.sapiens chr.14 | 91.0 | 18.3 | 101 | 158 | 41 |
| C.elegans | 100.3 | 34.3 | 110 | 225 | 75 |
| A.thaliana | 120.3 | 48.0 | 101 | 272 | 81 |
| C.sorokiniana | 58.7 | 48.5 | 250 | 499 | 413 |
| E.coli | 4.6 | 22.7 | 101 | 504 | 989 |
| M.parvicella | 4.2 | 4.9 | 98 | 315 | 229 |
Note: ‘G’ stands for genome length, ‘N’ for number of read pairs, ‘R’ for average read length, ‘I’ for average insert size, ‘D’ for average depth of coverage.
Computations were done on a PC cluster consisting of general purpose CPU nodes, each equipped with two Intel Xeon E5-2697 v3 processors and 256 GB RAM, and GPGPU nodes, each with two Nvidia V100 graphics cards with Intel Xeon Gold 5115 and 187 or 754 GB RAM. Processes were run on 16 cores in parallel. Outcomes of the assemblers were evaluated with the standard tool QUAST (Gurevich et al., 2013), which reports commonly used metrics, such as genome fraction, duplication ratio, largest alignment, NG50, NG75, number of contigs and many others. The program was run with the minimum length of contigs undergoing the evaluation set to 250, with the exception for C.sorokiniana, where it was 500 because of longer reads. Tables generated by QUAST for the outcomes are enclosed in Supplementary Material (Supplementary Tables S1–S6), here summarized. Average values given below have been calculated for six datasets, except for GRASShopPER, which failed with the dataset of A.thaliana due to too high memory usage and five values have been counted there.
The most important role of assemblers is to generate reliable contigs. Typically, the longer contigs are, the greater fraction of disagreements to a reference genome they contain. Some assemblers pay too much attention to extend contigs, so they win on the metrics promoting length, but lose on the number of alignment errors. Table 2 and Figure 3 present this aspect of results. Our conclusion was to exclude from further analysis these assemblers which produced results (on average) very far from users’ expectations: MEGAHIT and SPAdes because of too large fraction of inaccurate parts of a solution, and Readjoiner because of too small genome coverage.
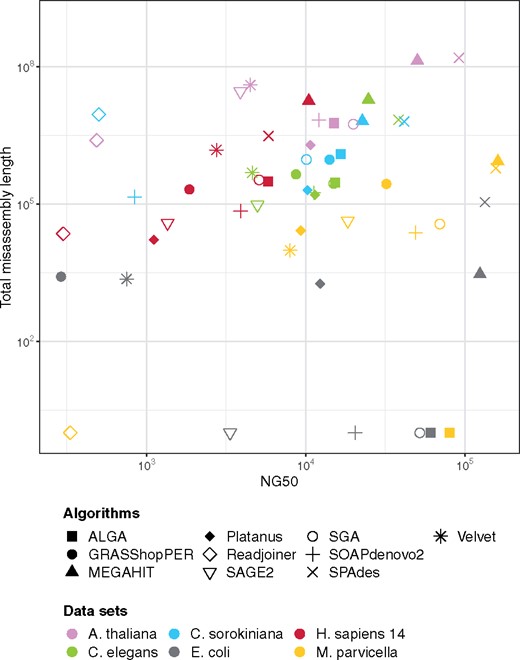
Results shown as the dependency of NG50 values and the length of misassemblies. NG50 means the length of a contig that together with at least such long contigs cover half of a reference genome. Total misassembly length is the sum of lengths of inaccurate contigs (being contigs misassembled, unaligned or partially unaligned to a reference genome). The better the results are, the closer to the right-bottom part of the graph they are visualized. Axes are in logarithmic scale
Results summarized for all genomes from Table 1 (average values) from the point of view of assemblers’ functionality
| Assembler | Genome fraction | Dupl. ratio | Inaccuracy |
|---|---|---|---|
| ALGA | 95.98% | 1.004 | 1.26% |
| GRASShopPER | 86.44% | 1.053 | 1.76% |
| MEGAHIT | 96.00% | 1.017 | 30.33% |
| Platanus | 92.30% | 1.008 | 0.47% |
| Readjoiner | 44.54% | 1.133 | 2.90% |
| SAGE2 | 76.65% | 1.008 | 4.83% |
| SGA | 95.77% | 1.008 | 1.28% |
| SOAPdenovo2 | 91.89% | 1.008 | 1.12% |
| SPAdes | 96.62% | 1.004 | 27.76% |
| Velvet | 81.93% | 1.015 | 6.01% |
Note: Genome fraction is the part of a reference genome covered by contigs aligned to it; duplication ratio is the relation of aligned result to the aligned part of a genome (with 1 being optimum); inaccuracy is the sum of lengths of inaccurate contigs (being contigs misassembled, unaligned or partially unaligned to a reference genome) divided by the genome length.
The highest located markers in Figure 3, for a given organism, represent results of worst accuracy. Some assemblers repeatedly occur in such a situation, especially MEGAHIT and SPAdes. When to remove markers of these two algorithms, the rightmost markers, that is of best NG50 values, belong to ALGA (except for A.thaliana). At the same time, the total misassembly length of ALGA’s results is comparable to others, or smaller.
Figure 4 shows the fraction of genomes covered by contigs aligned to them, as a function of changing bound on the length of contigs taken into account. The same figure brings us also information about NGA values (similar to NG but for aligned parts of contigs) and the longest aligned contig, which can be read from the rightmost point of a particular plot (also given explicitly in Supplementary Material, Supplementary Tables S1–S6). The leftmost value on X axis is equal to the minimum length of contigs analyzed by QUAST, i.e. 500 for C.sorokiniana and 250 for the other sets.
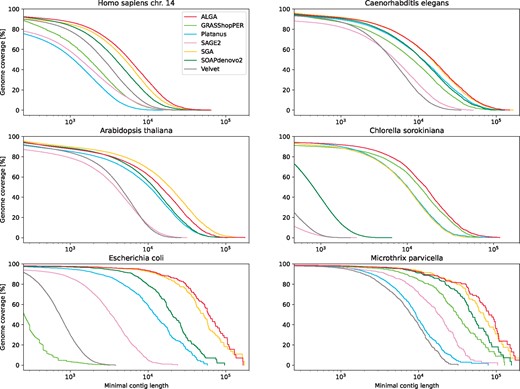
Results shown as the part (per cent) of a reference genome covered by contigs aligned to it, depending on the minimal length of contigs taken into account. X axis is in logarithmic scale
As an additional measure indicating accuracy of assemblers’ outcomes we took BUSCO, which returns a number of gene sequences, at the level of order or phylum of an organism, correctly recognized (or not) within produced contigs (Seppey et al., 2019). Table 3 contains values of this measure summed up for all datasets, detailed results for particular organisms are given in Supplementary Material (Supplementary Tables S7–S12).
Values of BUSCO measure summed up for all datasets
| Complete and single-copy genes | Complete and duplicated genes | Fragmented genes | |
|---|---|---|---|
| Reference genomes | 10 055 | 70 | 39 |
| ALGA | 9259 | 74 | 362 |
| GRASShopPER | 4228 | 23 | 451 |
| Platanus | 8967 | 61 | 447 |
| SAGE2 | 7236 | 70 | 734 |
| SGA | 9178 | 61 | 410 |
| SOAPdenovo2 | 7983 | 62 | 778 |
| Velvet | 6472 | 62 | 1167 |
Note: The values refer to numbers of BUSCO genes recognized correctly or partially within contigs produced by the assemblers.
3.2 Whole human genome
Separate tests were done with a whole human genome dataset (specified in Supplementary Material). It contains 359M pairs of reads of average length 151, average depth of coverage for the genome is 34. Previously described details of the computational experiment remain valid, with RAM of CPU nodes expanded to 320 GB. Only four assemblers finished computations with a result: ALGA, MEGAHIT, SGA, SOAPdenovo2; others either did not fit within available memory or had other runtime error. MEGAHIT once again produced contigs of inacceptable inaccuracy, this time 23.4%. SOAPdenovo2 obtained genome fraction 85.7% only. ALGA and SGA achieved results of similar high quality, ALGA much faster, SGA with much lower memory usage. In genome fraction, SGA was slightly better, 90.5% versus 90.3% for ALGA, but with a high value of duplication ratio: 1.108 versus 1.009 for ALGA. ALGA assembled much longer contigs than SGA, ALGA’s NG50 value is 2.5 times greater (11 495 versus 4481), largest alignment is 2 times greater (140 579 versus 67 917). Inaccuracy of both algorithms is the same and very low, 0.78%. For detailed results see Supplementary Material (Supplementary Tables S13–S16).
4 Discussion
The results of all assemblers shown from the point of view of their functionality (Table 2) demonstrate that ALGA is the best in this context. On average, it reconstructed the longest portion of genomes with keeping high accuracy level, and has the best value of duplication ratio. This best result has been achieved without any changes to program’s parameters (despite the datasets are so different), which are set internally to predefined values as described in section Algorithms. When we look into particular tables (Supplementary Tables S1–S6, not counting the methods of high inaccuracy, i.e. MEGAHIT and SPAdes), we can see that ALGA has the best value of genome fraction for H.sapiens and E.coli, second best for A.thaliana (after SGA) and C.sorokiniana (after Platanus) and third best for C.elegans and M.parvicella (after SGA and GRASShopPER).
The first rank of ALGA in reliability of results is confirmed by the values of BUSCO measure (Table 3). ALGA is placed ahead of other assemblers, both in the number of completely and uniquely recognized genes (the highest value) and the number of fragmented genes (the lowest value). The second and third place in this ranking is taken by SGA and Platanus, respectively.
From the point of view of contig lengths, the particular results in Figure 4 show that ALGA produced best results for each dataset except A.thaliana, where it is ranked after SGA. At the same time, ALGA generates the smaller number of contigs, averaged for all datasets. The longest aligned contig belongs to ALGA for H.sapiens and A.thaliana, for other datasets ALGA takes the second position after SGA or Platanus (not counting MEGAHIT and SPAdes).
Wide representation of tested assemblers and their equal allocation to the models of de Bruijn and overlap/string graphs allow us to infer basic predispositions of these models. The supremacy of de Bruijn-based assemblers according to time and memory usage was already known, but it happens that the other assemblers perform better; complete tables with such information can be found in Supplementary Material (Supplementary Tables S13–S15). Two best results in memory usage have been achieved by the overlap/string graph assemblers Readjoiner and SGA. Readjoiner also worked in shortest time, with ALGA being next. In memory usage ALGA is ranked in the middle. When considering the group of three best-quality assemblers from the computational experiment, ALGA, SGA and Platanus, ALGA is the fastest one and, in the average usage of memory, the second one (after SGA). The respective values for ALGA, SGA and Platanus, average for datasets from Table 1, are 14.7, 3.2, 108.5 (memory peak in GB) and 50, 190, 77 (time in minutes, incl. Musket for ALGA). As to the quality of results of assemblers from particular groups, it can be observed that three assemblers of highest inaccuracy (counted as in Table 2) use the de Bruijn graph model. However, another assembler from that group (Platanus) has the smallest inaccuracy value.
Tests with data from sequencing the whole human genome showed that only two assemblers were able to reconstruct the genome with satisfactory values of quality measures: ALGA and SGA. Both follow the overlap/string graph approach. They returned results of similar quality, except for duplication ratio, NG50 and largest alignment, where ALGA achieved much better values.
We used to implement the overlap-layout-consensus strategy in our methods for DNA sequencing and assembly (e.g. Blazewicz et al., 2002, 2009; Swiercz et al., 2018) as giving more reliable contigs, where the most significant problem was time and memory requirements. Now, ALGA manages large datasets, even of big depth of coverage. The genome of A. thaliana, of the length over 120 Mbp and covered with the average depth 81, appeared to be the most difficult dataset in the first part of the computational experiment, according to the greatest factor of incorrectly assembled contigs. Actually, the big coverage depth brought many new possibilities of connecting reads and traversing through forks in a graph, and assemblers hardly coped with such a situation. ALGA, by preferring errorless connections and doing a series of graph reduction steps, especially the one referring to the problem of minimum spanning tree of a local subgraph, achieved overall the second best result for A. thaliana, and the best results for other highly covered genomes of C. sorokiniana (the average depth 413) and E. coli (the average depth 989). It fits within memory constraints due to bit representation of data and building a sparse graph, and shortens computation time by a new procedure of comparing reads.
Switching to the error-free mode of aligning reads (by setting the parameter of error rate to zero) is worth attention as a decision toward optimizing computation time, memory usage and quality of solutions. A difficulty in the overlap graph approach which cannot be ignored is to establish a final consensus sequence from partial information about overlapping pairs of reads (neighbors in an already found path). It is a hard computational problem consisting in solving a series of problems of multiple sequence alignment in subsequent segments of a solution. In practice, due to time requirements, it is solved by a simple heuristic method giving non-optimal results. The de Bruijn graph approach does not have such a problem, because all connections appearing there are exact. The assumption of error-free connections in the overlap graph seemingly worsens a solution, but in practice, for currently obtained depth of coverage and small percentage of sequencing errors, it works very well (as shown in Results), even for the whole human genome assembled at once. But even in the case of errors allowed, the problem of establishing a consensus sequence in ALGA is turned to be computationally easy thanks to the assumed model of errors restricted to substitutions only, and we solve it optimally in polynomial time. The advantage of the error-free mode of ALGA over the mode with errors allowed, for Illumina datasets of a typical quality, can be observed through results shown in Supplementary Material (Supplementary Table S17).
5 Conclusion
The proposed method for sequence assembly, ALGA, proved to be effective in tests on a genome scale, including datasets coming from Illumina sequencing of several model organisms. It achieved better results than nine other tested assemblers in the sense of overall quality of genome reconstruction. In particular measures, like genome coverage, duplication ratio, accuracy, NG50, number of contigs and others, ALGA is ranked as the best or nearly the best. It is also the second fastest assembler with memory consumption kept at a medium level, which comes to the fore when restricting attention to assemblers giving best quality contigs.
Long read SMS technologies, such as the ones developed by Pacific Biociences or Oxford Nanopore, becomes the key mean to sequence de novo long or repetitive genomes. Assembly tools based on the de Bruijn graph model are preferred for shorter reads because of the information lost following the read decomposition. But also a high error rate connected with the new technologies poorly corresponds with the decomposition graphs. As we mentioned in Introduction, the sequencing errors are represented in these graphs by multiplying k-mers in versions differing in erroneous places. Further graph exploration bases on the possibility of identification which k-mers seem to be false positives, which can be efficiently done only if they are not too numerous comparing to the rest of the graph. This is the room to apply assembly methods following the overlap graph approach, and the efficient implementation of ALGA can be a part of a method satisfying practical expectations in this area.
Funding
The research was done based on infrastructure developed within European Center for Bioinformatics an Genomics project (Genomic Map of Poland, www.ecbig.pl/page/genomic-map-of-poland/), grant no. POIR.04.02.00-30-A004/16 supported by the European Regional Development Fund (ec.europa.eu/regional_policy/en/funding/erdf). Computational experiments were performed within PLGrid infrastructure (www.plgrid.pl/en), cluster Eagle in Poznan Supercomputing and Networking Center.
Author contributions
J.Bl., M.K., A.S. and P.W. conceived the study and supervised tasks of the project. S.S. developed and implemented the algorithms. S.S., A.L., J.Ba. and W.F. carried out computational experiments. M.K. and S.S. drafted the manuscript. A.S. drew up results of computations. All the authors were involved in discussions, data analysis and proofreading and approved the final version of the manuscript.
Conflict of Interest: none declared.

