


Abstract
Population studies such as genome-wide association study have identified a variety of genomic variants associated with human diseases. To further understand potential mechanisms of disease variants, recent statistical methods associate functional omic data (e.g. gene expression) with genotype and phenotype and link variants to individual genes. However, how to interpret molecular mechanisms from such associations, especially across omics, is still challenging. To address this problem, we developed an interpretable deep learning method, Varmole, to simultaneously reveal genomic functions and mechanisms while predicting phenotype from genotype. In particular, Varmole embeds multi-omic networks into a deep neural network architecture and prioritizes variants, genes and regulatory linkages via biological drop-connect without needing prior feature selections.
Varmole is available as a Python tool on GitHub at https://github.com/daifengwanglab/Varmole.
Supplementary data are available at Bioinformatics online.
1 Introduction
Statistical analyses have associated a variety of genomic variants with phenotypes in human diseases such as cancers and brain disorders. For example, genome-wide association study (GWAS) analyses have identified many disease risk single-nucleotide polymorphisms (SNPs) from population genetic data. However, predicting individual disease risk from those associated variants remains elusive. To address this issue, the polygenic risk scores (PRSs) have been developed based on a linear regression model to calculate the weighted sum of individual genotypes of variants as a predictive score for individual disease risk (Torkamani et al., 2018). However, like other complex polygenic diseases and possibly under an omnigenic model (Boyle et al., 2017), a great number of variants and genes are expected to function together as networks in diseases, with each individual risk variant or gene contributing small effects. Therefore, interpreting such statistical scores are still challenging for discovering the causal variants that are contributing most to the disease and understanding underlying mechanisms (Torkamani et al., 2018). For instance, a majority of GWAS SNPs are on non-coding regulatory regions, suggesting their potential roles in the mechanisms regulating genes in the diseases (Wang et al., 2018).
Recently, functional information from omics has been integrated to fine-map and link risk variants to molecular and cellular activities, aiming to reveal causal variants and mechanisms. For example, many molecular quantitative trait loci (QTLs) have associated variants with molecular activities such as eQTLs for gene expression. Also, the imputation methods such as TWAS (Gusev et al., 2016) and PrediXcan (Gamazon et al., 2015) use these QTLs to impute gene expression levels from disease risk variants and then connect to corresponding disease phenotypes. However, such associating variants, gene activities and phenotypes at separate steps, likely use different studies and typically assume that variants and genes are independent variables without considering their interactions (i.e. gene regulatory networks). Thus, this potentially mismatches molecular activities and disease phenotypes and misses causal and functional variants. For example, only between 3.5% and 11.7% of top eQTLs in the Genotype-Tissue Expression (GTEx) project are the actual causal variants affecting gene expression across various human tissues (GTEx Consortium et al., 2017).
In addition, machine learning has been widely used to integrate such functional information of variants for improving disease prediction and revealing high-order interactions of variants in the mechanisms. For example, prior biological knowledge (e.g. gene regulation and eQTLs) has been embedded into the machine learning models for genotype-phenotype prediction (Kong and Yu, 2018; Wang et al., 2018). However, the use of machine learning also has specific issues, including needing prior feature selection due to the ‘curse of dimensionality’ (i.e. large-scale variants and genes versus small-scale sample sizes). As well, enhancing the interpretability of machine learning from a ‘black box’ from genotype to phenotype is also challenging, especially for uncovering causal mechanisms from risk variants to diseases.
To address these challenges, we developed an interpretable deep learning method, Varmole, by inputting genotyping and gene expression data at the population level to predict disease phenotypes in a single coherent model. Varmole can also simultaneously prioritize causal variants and molecular mechanisms such as gene regulation for specific phenotypes. To achieve the interpretability, Varmole embeds prior biological knowledge such as QTLs and gene regulatory networks (GRNs) into a deep neural network. That said, we use QTLs and GRNs to define the biological architecture of Varmole, compared to the conventional fully connected ‘black box’ neural networks. Furthermore, compared to our previous work that requires selecting genes and variants before training and binarized gene expression data (Wang et al., 2018), Varmole is more scalable for enabling the implicit feature selection via Lasso regularization and biological drop-connect as well as taking input data with continuous values.
2 Methods and implementation
Varmole is built on a deep neural network model with multiple hierarchical layers corresponding to particular biological or clinical types. It aims to predict phenotypes from genotypes indirectly mediated by gene expression. Unlike conventional neural networks, Varmole (Fig. 1A) is a gray box model for its partial internal structure defined by prior biological knowledge; i.e. a biologically interpretable model. Varmole model has four major layers: (i) the input layer consists of SNPs and genes; (ii) a transparent layer duplicating the gene nodes in the input layer; (iii) hidden layer(s); (iv) the phenotype layer as output. We use the gene regulatory network (GRN) and eQTLs to build the connections between the input layer and the transparent layer, modeling the regulatory relationships among genes such as transcription factors (TFs) to target genes, and from SNPs to genes. This step also enables biological drop-connect; i.e. drop the links not supported by eQTLs or GRNs, which is inspired by DropConnect for neural networks (Wan et al., 2013). That said, the extra biological network structure is added to the transparent units of Varmole to reflect regulatory relationships between various genomic elements to help uncover the molecular mechanisms between genotype and phenotype. For example, it enables the interpretation in which important features (i.e. SNPs, genes) and important paths (i.e. SNP-gene and gene-gene regulation relationships) contributing to the prediction results are extracted. The other layers of the Varmole model the mechanisms in which gene expression gives rise to the phenotypes. Varmole does not have to input prior select features. Instead, it uses the - 1 regularization technique to omit features less responsible for the prediction outcomes (i.e. implicit feature selection). Furthermore, Varmole implements biological DropConnect (Wan et al., 2013) for prioritizing SNPs, genes and connections while predicting phenotypes. DropOut and DropConnect are the two most effective regularization techniques specifically for deep learning models, which are based on a random subset selection of output activations (in case of DropOut) or of weight connections (in case of DropConnect) between the two consecutive layers of a neural network. Instead of selecting a subset of connections randomly as conventional DropConnect, the connections in Varmole are selected according to prior biological knowledge (i.e. GRNs and eQTLs); i.e. biological DropConnect. In addition to interpretability, this architecture also helps address the overfitting issues caused by the problem of a small number of samples versus a large number of features in the biological datasets (Wan et al., 2013). Mainly, Varmole is composed of the following components:
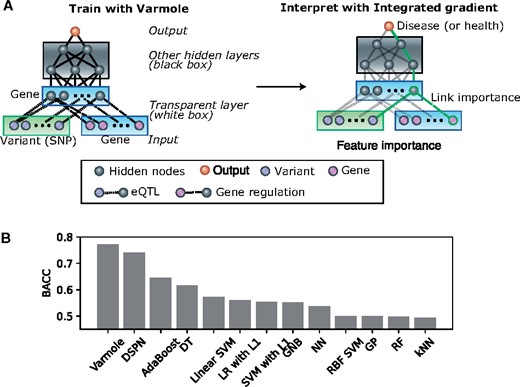
Varmole, a biologically drop-connect deep neural network model for prioritizing disease risk variants and genes. (A) Varmole model has four major layers: (i) the input layer consists of SNPs and genes; (ii) a transparent layer duplicating the gene nodes in the input layer; (iii) hidden layer(s); (iv) the phenotype layer as output. The prior biological networks from eQTLs and GRNs link SNPs/genes to genes from the input layer to the transparent layer, which enables biological drop-connect. Varmole can be evaluated by BACC and prioritizes the genes, SNPs and links for a phenotype (e.g. green path) using the integrated gradients. (B) Classification performance comparison by the BACC between Varmole and other state-of-the-art methods for genotype-phenotype prediction. The BACC is defined by BACC where TP, TN, FP, FN are true positive, true negative, false positive and false negative, respectively
Input X is the concatenation of the gene expression matrix (n genes by p samples) and SNP genotype (e.g. dosage) matrix (m SNPs by p samples) where is the matrix transpose operator;
The first transparent layer Z1 with its dimension being the number of genes n. Hence the weight W1 of this layer has a dimension of . The links of eQTLs and GRNs are embedded in this layer. Specifically, the two matrices and encode eQTL and GRN respectively where in eQTL data, and in gene regulatory network. Instead of a full connection between input X and hidden layer Z1, we now have a ‘Biological DropConnect’ layer where , and is the Hadamard product. Varmole enables an implicit feature selection method while training with the -1 penalty (Lasso) to W1;
Other fully connected hidden layers Zl index by ;
Softmax classification layer ;
- The Cross-Entropy Loss is used to quantify the classification error:
Once the Varmole model is trained, we can further use a derivative-based method called integrated gradient (Sundararajan et al., 2017) for prioritizing nodes (i.e. SNPs and genes) and connections (i.e. eQTLs and regulatory relationships) for phenotypes. In particular, we computed the gradient of the model’s prediction for each SNP and/or gene to show how the output response value (i.e. disease versus control) changes with respect to a small change in input gene expression or SNP genotype. Hence, calculating these gradients for given input SNPs and genes provides potential clues about which SNPs and/or genes attributed the disease outcomes. This step can also be interpreted to see which features are not selected due to - 1 regularization since the gradients for these input features are zeros. Furthermore, the gradient for given input features is also decomposed (via the chain rule) into a flow of gradients’ attribution via a visible unit encoding the expression of a gene in the transparent layer for prioritizing the importance of paths from SNPs to genes (i.e. eQTLs) or from genes to genes (i.e. regulatory relationships). For example, a particular Varmole model can be input to the Python package, Captum (Kokhlikyan et al., 2020) that implements the integrated gradient method for prioritizing SNPs, genes and links.
3 Usage cases
We applied Varmole to the functional genomic data for the human brain in the PsychENCODE consortium (Wang et al., 2018) for predicting schizophrenia from SNP genotype dosage and RNA-seq gene expression at the population level. The RNA-seq samples in PsychENCODE were uniformly reprocessed from the raw sequencing data using the same ENCODE-based pipeline and then normalized for removing co-factors representing potential batch effects across multiple cohorts (Wang et al., 2018). After filtering out SNPs and genes to match with those in eQTLs and GRN, we input the genotype data of 127 304 SNPs (dosage) and the expression data of 2598 genes from 487 schizophrenia and 891 non-schizophrenia samples including control and other disorders such as autism, bipolar. Also, we used a full GRN in PsychENCODE for the human brain to connect 674 TFs and 2578 target genes in Varmole (Wang et al., 2018). We also used 146 763 eQTLs of the human brain front cortex (BA9) in GTEx to link 127 304 SNPs and 2598 genes in Varmole. The input data was split into training/validation/testing with the ratio 64/16/20. The details of the model’s hyperparameters and training parameters are provided in the Supplementary Materials.
While the conventional classification accuracy is the typical metric for measuring the performance of a classification algorithm, it potentially misleads with respect to data imbalance since an imbalanced training set may bring about a classifier that is biased toward the more frequent class. For example, in binary classification, the classifier can label every test point to the dominant class and thus yield an optimistic accuracy estimate. The balanced accuracy (BACC) (Brodersen et al., 2010) has been developed to address imbalanced training data by taking the average of sensitivity (true positive rate) and specificity (true negative rate). In particular, BACC balances the contributes of different classes by assigning a weight to each class such that the resulted classifier can learn equally from all classes (Fig. 1A). The BACC also equals the area under the ROC curve with binary predictions. Also, if the dataset is balanced, this metric is equivalent to the regular accuracy. Therefore, given imbalanced sample sizes across disease and control in this application, we used the BACC to evaluate Varmole and found that it outperforms other state-of-the-art classifiers and PRS (Varmole BACC = 0.77, Figure 1B, Supplementary Materials). In particular, we experimented using multiple train-test splits (5 times) for Varmole and other methods. The BACC of Varmole is 0.77 on average (standard deviation is 0.01) while other methods have significant lower BACC values (t-test P-value < 2.04e-13). In addition, we further used the integrated gradient based method, Captum to prioritize the genes for predicting schizophrenia, based on the neural network architecture. In total, we ranked the importance of 127 304 SNPs, 2598 genes and 146 763 SNP-gene eQTL links for predicting schizophrenia from their importance scores in Captum (Supplementary Tables S1 and S2). Further, we performed the enrichment analyses for top ranked genes (Supplementary Materials), and found that they are enriched with a number of known functions and pathways in the schizophrenia, including neuron development, axon guidance, cell adhesion, calcium signaling, response to external stimulus, NMDA receptor and insulin secretion (FDR < 0.05, Supplementary Table S3). These results were also supported by previous schizophrenia studies (Coyle, 2012; Fromer et al., 2016; Gandal et al., 2018; Jaffe et al., 2018; Wang et al., 2018; Zhao et al., 2006). In addition, we overlapped the SNP-gene pairs with the interacting enhancers (±20 kb) and gene promoters for the human brain front cortex, identified from the PsychENCODE Hi-C data. We found that the overlapped SNP-gene pairs have significantly higher importance scores than the rest of the pairs (t-test P-value < 5 e-5) (Supplementary Materials). This suggests the distal regulatory roles of those SNPs prioritized by Varmole to the genes (Supplementary Table S2), implying potential novel schizophrenia-associated regulatory pathways linking risk SNPs, enhancers to genes. Finally, in addition to schizophrenia, we also applied Varmole to classify the lung cancer stages using TCGA data (Weinstein et al., 2013) and found that it also has higher accuracy than other classifiers (Supplementary Materials).
4 Conclusions
This article introduces an interpretable deep learning tool, Varmole, to predict disease phenotypes from multi-omic data. Using embedded biological networks and DropConnect, Varmole simultaneously prioritizes genomic variants and functional mechanisms such as gene regulation for particular phenotypes. This step thus provides the biological interpretability of Varmole, compared to that many existing machine learning methods that attempt to learn a ‘black box’ between genotype and phenotype. Varmole is publicly available as a Python tool at Github, https://github.com/daifengwanglab/Varmole.
Funding
This work was supported by NIH [R01AG067025, R21CA237955 and U01MH116492].
Conflict of Interest: none declared.
References
Sundararajan,M. et al. (2017) Axiomatic attribution for deep networks. InVolume 70 of Proceedings of Machine Learning Research, pp.3319–3328, International Convention Centre, Sydney, Australia. PMLR.
Wan, L. et al. (2013). Regularization of neural networks using dropconnect. volume 28 of Proceedings of Machine Learning Research, pages 1058–1066, Atlanta, Georgia, USA. PMLR.

