


Abstract
The emergence and subsequent pandemic of the SARS-CoV-2 virus raised urgent questions about its origin and, particularly, its reservoir host. These types of questions are long-standing problems in the management of emerging infectious diseases and are linked to virus discovery programs and the prediction of viruses that are likely to become zoonotic. Conventional means to identify reservoir hosts have relied on surveillance, experimental studies and phylogenetics. More recently, machine learning approaches have been applied to generate tools to swiftly predict reservoir hosts from sequence data.
Here, we extend a recent work that combined sequence alignment and a mixture of alignment-free approaches using a gradient boosting machines machine learning model, which integrates genomic traits and phylogenetic neighbourhood signatures to predict reservoir hosts. We add a more uniform approach by applying Machine Learning with Digital Signal Processing-based structural patterns. The extended model was applied to an existing virus/reservoir host dataset and to the SARS-CoV-2 and related viruses and generated an improvement in prediction accuracy.
The source code used in this work is freely available at https://github.com/bill1167/hostgbms.
Supplementary data are available at Bioinformatics online.
1 Introduction
Prevention and management of emerging viral infections (e. g. SARS, Ebola, MERS and Zika), require urgent identification of the natural reservoir hosts that carry these viruses. This has been emphasized by the emergence and current pandemic of the SARS-CoV-2 virus and the questions surrounding its origin (Lu et al., 2020). Common practice to identify reservoir hosts has used a combination of methods such as field surveillance, laboratory experiments and phylogenetic analyses, which are time consuming and often inconclusive (Viana et al., 2014) and delays could lead to more economic and health losses. As an alternative, a Gradient Boosting Machines (GBMs)-based machine learning model was developed to rapidly predict natural reservoir hosts of single-stranded RNA (ssRNA) viruses (Babayan et al., 2018). It utilized viral sequences that can now be generated at low cost, and integrated selected genomic traits (GT) and phylogenetic neighbourhood (PN) traits to make reservoir host predictions with high confidence (Babayan et al., 2018), generating field testable hypotheses and narrowing the gap between virus discovery and insights into virus ecology and management.
The GBM machine learning model was trained on a curated set of viruses and reservoir hosts established from literature sources (Babayan et al., 2018). To compute PN traits, BLAST was used to align a query sequence against a set of references, which were mainly non-homologous. As BLAST-based alignment is designed to not select non-homologous sequences, including those that might have the same reservoir host, PN traits obtained in this way may avoid information that could help classification and so limit the performance of the model. Alignment-free approaches (Zielezinski et al., 2017) can bypass the requirement for homology or divergent evolution to potentially identify related sequences. The alignment-free GT approach, which selected the best 50 predictors from a set of over 4000 that was based on nucleotide, codon and amino acid composition parameters, was originally used to balance this (Babayan et al., 2018).
Here, we present an augmented machine learning model that combines the GT and PN approaches (Babayan et al., 2018) with Machine Learning with Digital Signal Processing (MLDSP)-based structural patterns (M-SP) of viral sequences (Randhawa et al., 2019; 2020a). The MLDSP approach applies a one-dimensional, consistent numeric recoding or the two-dimensional Chaos Game Representation (CGR) (Almeida et al., 2001; Jeffrey, 1990; Karamichalis et al., 2015), of the sequences in a signal processing approach and was used to classify early SARS-CoV-2 sequences within a large viral genomic sequence dataset (Randhawa et al., 2020b). This more structured approach to an alignment-free method than the GT approach might allow better detection of non-homologous viruses with the same reservoir host. MLDSP builds on alignment-free approaches that are widely used for sequence comparisons and can overcome the sequence length constraints that may hamper alignment based methods (Zielezinski et al., 2017; 2019) and a similar approach was used to compare genomic sequences (Lichtblau, 2019). In this work, the use of MLDSP methods improved the prediction of reservoir hosts of ssRNA viruses.
We demonstrate how this consistent sequence structural information, using the alignment-free MLDSP method, could properly detect host predictors that were not seen by the alignment-based (PN) approach and improve accuracy over the GT combination of compositional parameters method. Through error analysis of the previous model, we suggest two combinations of family categories, into the order level, to achieve a higher confidence in host predictions. The primary classification of a host at the order level allows targeted investigations of subgroups and could provide insights into outbreaks of viruses and their management.
The trained model was applied to the SARS-CoV-2 and related viruses to identify their natural reservoir hosts. Our model suggested a bat origin for SARS-CoV-2, consistent with field surveillance and phylogenetic analysis (Latinne et al., 2020; Lau et al., 2020; Vijaykrishna et al., 2007; Zhou et al., 2020). Further analysis using a deep learning model indicated that the host subgroup Pteropodiformes (Hutcheon and Kirsch, 2006) was more likely to be the natural reservoir of the SARS-CoV-2 viruses.
2 Materials and methods
2.1 Datasets
From the earlier work predicting natural reservoir hosts (Babayan et al., 2018), ssRNA viruses were further explored as they are the major pathogen group responsible for emerging human diseases (Olival et al., 2017; Woolhouse and Gaunt, 2007). 437 viral species that cover 80% of the ssRNA virus families that contain human-infecting species (Olival et al., 2017) as developed in Babayan et al. (2018) were included. Each virus has been assigned a reservoir host that belongs exclusively to one of nine host categories, Artiodactyl, Bat, Bird, Carnivore, Fish, Insect, Plant, Primate and Rodent, that are defined mainly at the class/order level. Other possible reservoir host categories were excluded from the dataset as underrepresented examples, where the number of known viral species was less than 15 (Babayan et al., 2018). The Bird and Bat categories were each divided into two subgroups in Babayan et al. (2018), but were not in this work as this resulted in significantly higher accuracy.
Two coronaviruses, SARS-CoV-2 isolate Wuhan-Hu-1, NCBI accession NC_045512.2 (18) and hCoV-19/bat/Yunnan/RaTG13/2013, aka RaBatCoV/4991, detected in Rhinolophus affinis from Yunnan province, GISAID accession EPI_ISL_402131 (Ge et al., 2016; Zhou et al., 2020), were used for detailed analysis. Another seven SARS-related viruses (Lam et al., 2020) and ten SARS-CoV-2 virus strains, sequenced from January to June 2020 during the first wave outbreak, were collected from the NCBI database for phylogenetic analysis. Coding sequence (CDS) information of these 17 viruses were retrieved for feature computation to predict their reservoir host using the GBM-based model. The GT and PN features were used to train a subsequent deep-learning model (built using Keras with default parameters) to subclassify bat host predictions.
2.2 Construction of features
Three layers of traits, as viral features, were used to represent a pathogen’s association with its natural reservoir host. These were selected genomic traits (GT) and phylogenetic neighbourhood traits (PN) (as in Babayan et al., 2018), and MLDSP-based structural patterns of viral sequences (M-SP). GT contained the codon pair score (CPS), dinucleotide biases, codon biases and amino acid biases from Babayan et al. (2018) and the 50 most important features from GT as defined in Babayan et al. (2018) were used. PN traits were computed as in Babayan et al. (2018), except that only nine host categories were mapped here, with the top five BLAST hits retained, as in Babayan et al. (2018).
The third set of traits was designed to capture association patterns between a virus and its reservoir host that could have been missed by the BLAST local alignment-based method in the PN traits or the GT traits. The Machine Learning with Digital Signal Processing (MLDSP) strategy (Randhawa et al., 2019; 2020a), which was developed to make alignment-free comparisons among sequences, was adopted. Sequences were recoded based on a one-dimensional purine/pyrimidine code [a two-dimensional Chaos Game Representation Method with a k-tuple size of 7 (Karamichalis et al., 2015; Randhawa et al., 2020b) was also examined, see Supplementary Information], Fourier transformed (FT) and the Pearson correlation coefficients among the FT sequences were obtained (Randhawa et al., 2019; 2020a). A distance matrix was computed from the input sequences, and the matrix of a virus was associated with the host categories to gauge the weight of each host group (create a weight vector) for the target virus.
The process was: (i) Use the MLDSP algorithm (details shown in Supplementary Information) to compute a distance matrix of query sequences against the whole viral dataset. (ii) The distance values for each query sequence were inverted to give its weights against different reference sequences. (iii) The top five weights, as with the PN traits, were selected and mapped to the host categories. (iv) Weights were normalized by taking the absolute value of subtraction between each adjacent weight pair to measure the distance. (v) Weights pointing to the same host group were summed and all weights were converted into a percentage over the nine host categories to give the final weight vector, or M-SP traits, representing the association patterns between the query sequence and its potential hosts.
The GT traits, PN traits and M-SP traits are concatenated as the feature input of the model, so that the number of features considered is 68 (GT = 50, PN = 9, M-SP = 9).
2.3 Machine learning model
Prior to building the model, the strength of virus-host associations between PN and M-SP traits was compared using the six methods in Randhawa et al. (2019) (i.e. LinearDiscriminant, LinearSVM, QuadraticSVM, FineKNN, SubspaceDiscriminant and SubspaceKNN). The PN-host and M-SP-host pairs were used as two sets of data for input to the six algorithms, as described in Randhawa et al. (2019). The outcomes demonstrated the extent of host identification achieved by the PN or M-SP traits alone.
For the main predictive model, the GBM framework from Babayan et al. (2018) that performed best at host prediction was adopted for host inference here. A random stratified split strategy was used to divide the dataset into training (70%), optimization (15%) and test (15%) sets. Five hundred and fifty rounds of training, as in Babayan et al. (2018) were conducted.
Performance for each of the 437 viruses was evaluated by two methods. Firstly, as in Babayan et al. (2018), the overall top 25% of the 550 trained models were selected. For an individual virus, the bagged prediction accuracy was calculated by selecting from these ‘top 25%’ models all that had that virus in the test set. In the second method, the performance of the models was defined by selecting the top 25% of all models that had a specific virus in the test set and bagging their predictions. Therefore, the host of every virus is predicted from exactly 25% of the models for which it was in the test set.
As the GT and M-SP traits are calculated without alignment against reference sequences, models with GT only versus GT and M-SP combined (excluding PN traits) were compared to investigate the benefit brought by the M-SP traits. The best 138 models from the 550 rounds of training (similar to the first method above) were selected for comparison and were averaged (a bagging strategy) to generate a final prediction. The performance between this (averaged) model and the model of Babayan et al. (2018) were compared based on identical configuration settings.
As bats are reservoir hosts of many recently emerging zoonoses (Brierley et al., 2016; Luis et al., 2013; Zhou et al., 2016), a deep learning (DL) model (Supplementary Table S1) was built to further analyze the host subgroup of bat predictions. Of the 437 virus species in the dataset, those from bats were extracted to train this model (with 50 rounds of training) to predict between the Pteropodiformes and Vespertilioniformes subgroups (Hutcheon and Kirsch, 2006). Further taxonomic subdivision was not possible due to the limited number of examples.
2.4 Implementation
The following computing environments were used: numpy and pandas in Python for data processing, MATLAB for M-SP feature generation, h2o in R and tensorflow with keras in Python for machine learning, and matplotlib in Python for plotting and visualization.
2.5 Code and data availability
Source code is available at https://github.com/bill1167/hostgbms. Training data were the curated virus-reservoir host dataset generated and published by Babayan et al. (2018).
3 Results
3.1 Missed association patterns captured by the MLDSP method
The six models used for the MLDSP performance test in Randhawa et al. (2019) were applied to the virus-host dataset and compared to predictions from the PN traits-based approaches (Table 1). The MLDSP-based predictions were better or comparable to those from the PN-based methods for most cases, with SubspaceKNN and FineKNN giving the best results at accuracies of 54.9% and 53.8%, respectively, and clearly outperforming any method using PN traits. The extent to which patterns captured by the MLDSP algorithm correlated with their reservoir host was visualized through Multi-dimensional Scaling (MDS), as shown in Figure 1a. Prediction accuracies over 90% (Supplementary Table S2) were achieved when MLDSP-based traits were used to predict the virus family (Fig. 1b). Thus, this alignment-free method captures most of the information in the phylogenetic classification, while finding patterns relating to virus-host associations that were missed by the alignment-based PN approach.
![Visualization of pattern-category associations revealed by the MLDSP method using Multi-dimensional Scaling. (a) Associations between viral patterns and host categories using the MLDSP method. (b) Associations between viral patterns and virus categories using the MLDSP method. Each circle represents a virus [a total of 437 and 139 examples in (a) and (b), respectively] with colour indicating the corresponding category](https://oup.silverchair-cdn.com/oup/backfile/Content_public/Journal/bioinformatics/37/19/10.1093_bioinformatics_btab338/2/m_btab338f1.jpeg?Expires=1716447784&Signature=CWPiejO5kzcE7tvq5xk2OjH7sDaax-rTMQEoVEzmskuZTuwNQ~BDqe~s04WyL7JUmQVY-ZLd1EV3XcXa8cW0F5d2hHp6QZCbmw~tVRJt4We5R89ZGhRVWCoB7f2I2oUiv08jySu-Z7HzhJRTZPAwS68fosLPBR0St8pgZE-s1PUY8-lEc-ycruXoLYI7UU9ywksMwWgygqP7NFb2rHGmmcVZ~~Kcgyixcox2~nrqDvGSzjkBdDnmDJ3RfUKWgEpls2hIKouglkjhCeu1C7NueKZPvRMETF1lT9Og2V2bMPrpATHUWgPzj1NDrVF-lNXKIYsENo~9snMN~oB0D~AWow__&Key-Pair-Id=APKAIE5G5CRDK6RD3PGA)
Visualization of pattern-category associations revealed by the MLDSP method using Multi-dimensional Scaling. (a) Associations between viral patterns and host categories using the MLDSP method. (b) Associations between viral patterns and virus categories using the MLDSP method. Each circle represents a virus [a total of 437 and 139 examples in (a) and (b), respectively] with colour indicating the corresponding category
Accuracy of predictions of the virus’ host for different traits
| Model | PN traits (%) | MLDSP traits (%) |
|---|---|---|
| LinearDiscriminant | 38.9 | 47.8 |
| LinearSVM | 44.4 | 36.6 |
| QuadraticSVM | 49.2 | 49.0 |
| FineKNN | 46.2 | 53.8 |
| SubspaceDiscriminant | 38.9 | 43.0 |
| SubspaceKNN | 46.0 | 54.9 |
| AverageAccuracy | 43.9 | 47.5 |
| Model | PN traits (%) | MLDSP traits (%) |
|---|---|---|
| LinearDiscriminant | 38.9 | 47.8 |
| LinearSVM | 44.4 | 36.6 |
| QuadraticSVM | 49.2 | 49.0 |
| FineKNN | 46.2 | 53.8 |
| SubspaceDiscriminant | 38.9 | 43.0 |
| SubspaceKNN | 46.0 | 54.9 |
| AverageAccuracy | 43.9 | 47.5 |
The PN and MLDSP methods were compared over the training examples (Table 2). Both methods failed for the Goose calicivirus (NC_024078.1), although the MLDSP method was a marginal failure. The PN method failed in a further three cases and gave less strong predictions than MLDSP in the six remaining cases where both methods were correct. Integrating MLDSP-based patterns into the machine learning model should improve the accuracy of its predictions.
Reservoir host prediction by the PN and MLDSP methods
| Virus | Accession number | Reservoir | Method | Artiodactyla | Bat | Bird | Carnivore | Fish | Insect | Plant | Primate | Rodent |
|---|---|---|---|---|---|---|---|---|---|---|---|---|
| Akabane virus | NC_009896.1 | Artiodactyl | PN | 0.00 | 0.00 | 0.00 | 0.00 | 0.00 | 0.00 | 0.00 | 0.00 | 1.00 |
| MLDSP | 0.92 | 0.03 | 0.00 | 0.00 | 0.00 | 0.00 | 0.00 | 0.00 | 0.05 | |||
| Malsoor virus | KF186496.1 | Bat | PN | 0.11 | 0.11 | 0.11 | 0.11 | 0.11 | 0.11 | 0.11 | 0.11 | 0.11 |
| MLDSP | 0.12 | 0.85 | 0.00 | 0.03 | 0.00 | 0.00 | 0.00 | 0.00 | 0.00 | |||
| Newbury-1 virus | NC_007916.1 | Artiodactyl | PN | 0.28 | 0.00 | 0.00 | 0.72 | 0.00 | 0.00 | 0.00 | 0.00 | 0.00 |
| MLDSP | 0.99 | 0.00 | 0.00 | 0.00 | 0.00 | 0.00 | 0.00 | 0.00 | 0.00 | |||
| Goose calicivirus | NC_024078.1 | Bird | PN | 0.00 | 0.25 | 0.25 | 0.00 | 0.00 | 0.00 | 0.00 | 0.50 | 0.00 |
| MLDSP | 0.00 | 0.00 | 0.40 | 0.19 | 0.00 | 0.00 | 0.00 | 0.41 | 0.00 | |||
| Tyuleniy virus | NC_023424.1 | Bird | PN | 0.00 | 0.00 | 0.26 | 0.00 | 0.00 | 0.00 | 0.00 | 0.25 | 0.49 |
| MLDSP | 0.00 | 0.00 | 0.80 | 0.00 | 0.00 | 0.00 | 0.00 | 0.17 | 0.03 | |||
| Chicken calicivirus | KM254171.1 | Bird | PN | 0.29 | 0.00 | 0.47 | 0.00 | 0.00 | 0.00 | 0.00 | 0.24 | 0.00 |
| MLDSP | 0.00 | 0.00 | 0.60 | 0.00 | 0.00 | 0.00 | 0.00 | 0.40 | 0.00 | |||
| Kama virus | NC_023439.1 | Bird | PN | 0.25 | 0.00 | 0.26 | 0.00 | 0.00 | 0.00 | 0.00 | 0.25 | 0.25 |
| MLDSP | 0.00 | 0.00 | 0.97 | 0.00 | 0.00 | 0.00 | 0.00 | 0.03 | 0.00 | |||
| Human- | NC_003443.1 | Primate | PN | 0.00 | 0.24 | 0.00 | 0.25 | 0.00 | 0.00 | 0.00 | 0.51 | 0.00 |
| parainfluenza | MLDSP | 0.00 | 0.35 | 0.00 | 0.00 | 0.10 | 0.00 | 0.00 | 0.55 | 0.00 | ||
| Junin arenavirus | NC_005081.1 | Rodent | PN | 0.00 | 0.25 | 0.00 | 0.00 | 0.00 | 0.00 | 0.00 | 0.00 | 0.75 |
| MLDSP | 0.00 | 0.00 | 0.00 | 0.00 | 0.00 | 0.00 | 0.00 | 0.00 | 1.00 | |||
| Rabies virus | JQ685970.1 | Carnivore | PN | 0.00 | 0.00 | 0.00 | 1.00 | 0.00 | 0.00 | 0.00 | 0.00 | 0.00 |
| MLDSP | 0.00 | 0.00 | 0.00 | 1.00 | 0.00 | 0.00 | 0.00 | 0.00 | 0.00 |
The highest values by the PN- and MLDSP-based methods are marked in bold.
3.2 Improved accuracy of predictions when the GT, PN and M-SP traits were combined
The overall performance of the models was examined by taking the best 25% of the 550 trained GBM models, with and without the M-SP traits, and assessing their predictions on their test sets over the host groups (Supplementary Table S3). Adding the MLDSP approach gave an average accuracy of 77.0% (Fig. 2a), against 75.1% without it (Fig. 2b). Prediction accuracies for the Bat and Bird host groups were approximately 10% higher than their component subgroups (Supplementary Fig. S1). For most of the host groups, prediction accuracies were better for the model including M-SP traits.
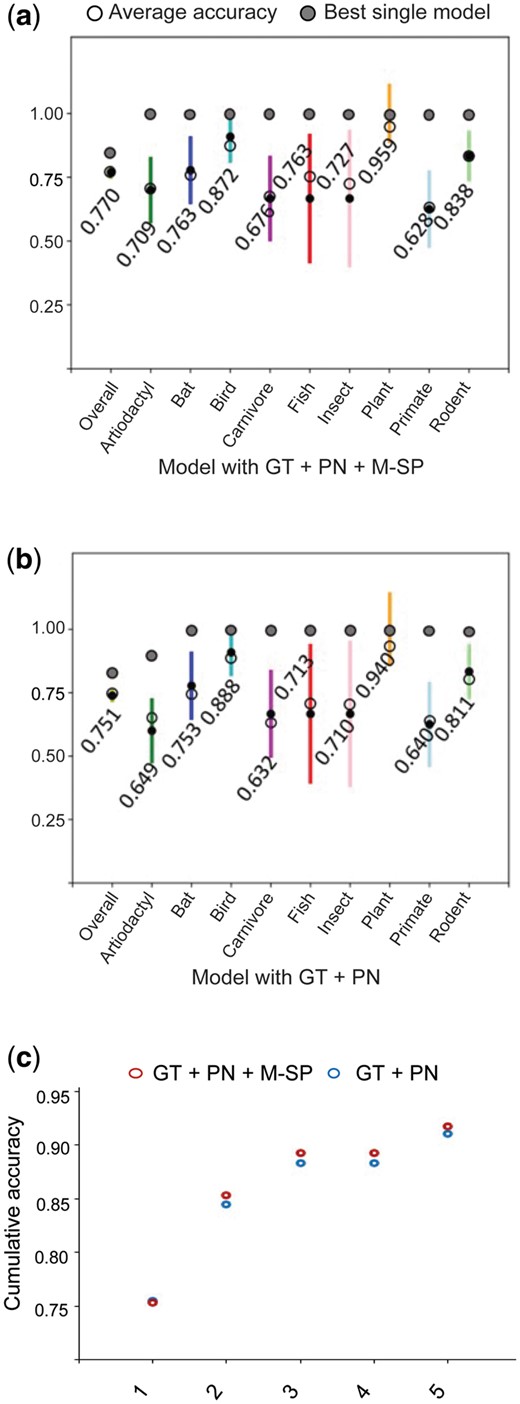
Accuracy of the GBMs model using features captured by different algorithms. (a) Accuracy of the GBMs model using GT + PN + M-SP features. (b) Accuracy of the GBMs model using GT + PN features. Dark points and coloured lines are median and SD, respectively. (c) Cumulative bagged accuracy of models with GT + PN (blue) and GT + PN + M-SP (red) on all 437 viruses from the first prediction to the fifth ranked prediction
The cumulative prediction accuracy for the bagged 138 models is presented in Figure 2c and Supplementary Table S4. Bagging of the models removed the accuracy distinction between the two approaches for first rank predictions, but an improvement remained for lower ranked predictions with M-SP traits.
Analysis of GT only versus GT and M-SP combined, without PN, showed that the average of the best ten performances improved by 2.6%, from 70.9% to 73.5% (Supplementary Table S5).
3.3 Prediction of bat origin for SARS-CoV-2 and related viruses
As a test of the method, the predicted natural reservoir hosts for two coronaviruses, Wuhan-Hu-1 [SARS-CoV2 isolate NC_045512.2 (Wu et al., 2020)] and hCoV-19/bat/Yunnan/RaTG13/2013 [EPI_ISL_402131.3 (Ge et al., 2016; Zhou et al., 2020)] are presented in Table 3, with individual models (the ten best of 50 trained models) making correct predictions for both viruses. For the 17 SARS-related and SARS-CoV-2 test viruses (phylogeny shown in Supplementary Fig. S2), the bagged predictions indicated that, as expected, all these SARS-related coronaviruses were of bat origin when the M-SP method was included (Table 4).
Natural reservoir host of two coronaviruses predicted by the GT-PN-M-SP GBMs model
| Virus | Accession number | Modelb | Prediction | Artiodactyl | Bat | Bird | Carnivore | Fish | Insect | Plant | Primate | Rodent |
|---|---|---|---|---|---|---|---|---|---|---|---|---|
| Wuhan- | NC_045512.2 | 47 | Bat | 0.000 | 1.000 | 0.000 | 0.000 | 0.000 | 0.000 | 0.000 | 0.000 | 0.000 |
| Hu-1 | 39 | Bat | 0.103 | 0.234 | 0.092 | 0.093 | 0.094 | 0.089 | 0.087 | 0.119 | 0.089 | |
| 40 | Bat | 0.004 | 0.996 | 0.000 | 0.000 | 0.000 | 0.000 | 0.000 | 0.000 | 0.000 | ||
| 45 | Bat | 0.000 | 1.000 | 0.000 | 0.000 | 0.000 | 0.000 | 0.000 | 0.000 | 0.000 | ||
| 50 | Bat | 0.007 | 0.993 | 0.000 | 0.000 | 0.000 | 0.000 | 0.000 | 0.000 | 0.000 | ||
| 12 | Bat | 0.003 | 0.996 | 0.000 | 0.000 | 0.000 | 0.000 | 0.000 | 0.000 | 0.000 | ||
| 16 | Bat | 0.002 | 0.997 | 0.000 | 0.000 | 0.000 | 0.000 | 0.000 | 0.001 | 0.000 | ||
| 11 | Bat | 0.000 | 0.999 | 0.000 | 0.000 | 0.000 | 0.000 | 0.000 | 0.000 | 0.000 | ||
| 32 | Bat | 0.000 | 1.000 | 0.000 | 0.000 | 0.000 | 0.000 | 0.000 | 0.000 | 0.000 | ||
| 01 | Bat | 0.001 | 0.993 | 0.000 | 0.000 | 0.000 | 0.000 | 0.000 | 0.006 | 0.000 | ||
| RaTG13a | EPI_ISL_ | 47 | Bat | 0.000 | 1.000 | 0.000 | 0.000 | 0.000 | 0.000 | 0.000 | 0.000 | 0.000 |
| 402131 | 39 | Bat | 0.094 | 0.243 | 0.094 | 0.092 | 0.099 | 0.092 | 0.090 | 0.103 | 0.092 | |
| 40 | Bat | 0.000 | 1.000 | 0.000 | 0.000 | 0.000 | 0.000 | 0.000 | 0.000 | 0.000 | ||
| 45 | Bat | 0.000 | 1.000 | 0.000 | 0.000 | 0.000 | 0.000 | 0.000 | 0.000 | 0.000 | ||
| 50 | Bat | 0.005 | 0.994 | 0.000 | 0.000 | 0.000 | 0.000 | 0.000 | 0.001 | 0.000 | ||
| 12 | Bat | 0.000 | 1.000 | 0.000 | 0.000 | 0.000 | 0.000 | 0.000 | 0.000 | 0.000 | ||
| 16 | Bat | 0.000 | 0.999 | 0.000 | 0.000 | 0.000 | 0.000 | 0.000 | 0.001 | 0.000 | ||
| 11 | Bat | 0.000 | 0.999 | 0.000 | 0.000 | 0.000 | 0.000 | 0.000 | 0.000 | 0.000 | ||
| 32 | Bat | 0.000 | 1.000 | 0.000 | 0.000 | 0.000 | 0.000 | 0.000 | 0.000 | 0.000 | ||
| 01 | Bat | 0.010 | 0.903 | 0.000 | 0.000 | 0.000 | 0.000 | 0.000 | 0.087 | 0.001 |
RaTG13 is hCoV-19/bat/Yunnan/RaTG13/2013.
The best ten individual GBMs of the 50 trained models are shown.
Natural reservoir host of SARS-related coronaviruses predicted by the GT-PN-M-SP GBMs model
| Virus | Accession number | Bagged | Model 47a | Model 39 | Model 40 | Model 45 | Model 50 | Model 12 | Model 16 | Model 11 | Model 32 | Model 01 | Pterobat (%) |
|---|---|---|---|---|---|---|---|---|---|---|---|---|---|
| TW11 | AY502924.1 | Bat | Bat | Bat | Bat | Bat | Bat | Bat | Bat | Bat | Bat | Bat | 68.51 |
| HKU3-6 | GQ153541.1 | Bat | Bat | Bat | Bat | Bat | Bat | Bat | Bat | Bat | Bat | Bat | 67.94 |
| HKU3-12 | GQ153547.1 | Bat | Bat | Bat | Bat | Bat | Bat | Bat | Bat | Bat | Bat | Bat | 65.12 |
| Cp/Yunnan2011 | JX993988.1 | Bat | Bat | Bat | Bat | Bat | Bat | Bat | Bat | Bat | Bat | Bat | 68.40 |
| YNLF_31C | KP886808.1 | Bat | Bat | Bat | Bat | Bat | Bat | Bat | Bat | Bat | Bat | Bat | 63.70 |
| JTMC15 | KU182964.1 | Bat | Bat | Bat | Bat | Bat | Bat | Bat | Bat | Bat | Bat | Bat | 63.22 |
| HKU-SZ-005b | MN975262 | Bat | Bat | Bat | Bat | Bat | Bat | Bat | Bat | Bat | Bat | Bat | 65.34 |
| USA-CA2 | MN994468 | Bat | Bat | Bat | Bat | Bat | Bat | Bat | Bat | Bat | Bat | Bat | 62.89 |
| nCoV-FIN-29-Jan | MT020781 | Bat | Bat | Bat | Bat | Bat | Bat | Bat | Bat | Bat | Bat | Bat | 62.91 |
| INMI1 | MT066156 | Bat | Bat | Bat | Bat | Bat | Bat | Bat | Bat | Bat | Bat | Bat | 62.48 |
| SP02 | MT126808 | Bat | Bat | Bat | Bat | Bat | Bat | Bat | Bat | Bat | Bat | Bat | 62.93 |
| VH198152683 | MT359866 | Bat | Bat | Bat | Bat | Bat | Bat | Bat | Bat | Bat | Bat | Bat | 62.82 |
| VIC1178 | MT451786 | Bat | Bat | Bat | Bat | Bat | Bat | Bat | Bat | Bat | Bat | Bat | 62.48 |
| GBRC144 | MT560827 | Bat | Bat | Bat | Bat | Bat | Bat | Bat | Bat | Bat | Bat | Bat | 62.50 |
| NRW-01 | MT582499 | Bat | Bat | Bat | Bat | Bat | Bat | Bat | Bat | Bat | Bat | Bat | 62.48 |
| SCPM-O-cDNA-02 | MT635445 | Bat | Bat | Bat | Bat | Bat | Bat | Bat | Bat | Bat | Bat | Bat | 65.56 |
| Tor2 | NC_004718.3 | Bat | Bat | Bat | Bat | Bat | Bat | Bat | Bat | Bat | Bat | Bat | 62.48 |
The best ten individual GBMs of the 50 trained models are shown.
3.4 Pteropodiformes origin of SARS-CoV-2 by subgroup analysis
Whether the SARS-CoV-2 virus was of Pteropodiformes or Vespertilioniformes origin (Hutcheon and Kirsch, 2006) was investigated with a deep learning model. A Pteropodiformes bat origin was predicted for the Wuhan-Hu-1 isolate and the hCoV-19/bat/Yunnan/RaTG13/2013 SARS-CoV-2 related virus (isolated from a Pteropodiformes bat) with probabilities of 0.6231 and 0.6492, respectively. All SARS-related and SARS-CoV-2 test strains (as given in Supplementary Fig. S2) were predicted to be associated with the Pteropodiformes host group [Pterobat(%), Table 4].
4 Discussion
Convenient measures to rapidly identify the natural reservoir hosts of emerging human infectious viruses are needed as the current practice of field surveillance, laboratory experiments and phylogenetics is time consuming and often inconclusive (Viana et al., 2014). We have proposed a strategy to improve an existing in silico model (Babayan et al., 2018) for reservoir host prediction by capturing additional host associations based on sequence structural patterns, M-SP, derived from MLDSP (Randhawa et al., 2019, 2020a), that can be determined without requiring alignments. These were added as a consistent method for all sequences rather than the selection of the best 50 parameters from a variety of over 4000 compositional parameters, as in Babayan et al. (2018). This led to an improvement in the accuracy of predictions. Application of the trained models to a set of SARS-related viruses indicated that they are associated with Pteropodiformes bats, consistent with prior knowledge. While the overall performance of the proposed model was better than the one without M-SP in testing on a total of 437 viruses, there were still incorrect predictions. Other potentially informative host indicators at the molecular or habitat level are yet to be explored thoroughly (Brass et al., 2009; Roy et al., 2014; Woolhouse and Gowtage-Sequeria, 2005), and the overall approach discussed here has been extended to identify human-infecting viruses (Mollentze et al., 2020). These ideas could help improve the accuracy of machine learning models and future work will look to refining the taxonomic level at which these predictions can be made. We acknowledge the essential role of field surveillance, laboratory experimentation and phylogenetics in providing the knowledge base for this and similar works. We hope that our and related work will contribute to the response to outbreaks and be useful for further field surveillance and experimentation.
Financial Support: none declared.
Conflict of Interest: none declared.

