


Abstract
Mutations that alter protein–DNA interactions may be pathogenic and cause diseases. Therefore, it is extremely important to quantify the effect of mutations on protein–DNA binding free energy to reveal the molecular origin of diseases and to assist the development of treatments. Although several methods that predict the change of protein–DNA binding affinity upon mutations in the binding protein were developed, the effect of DNA mutations was not considered yet.
Here, we report a new version of SAMPDI, the SAMPDI-3D, which is a gradient boosting decision tree machine learning method to predict the change of the protein–DNA binding free energy caused by mutations in both the binding protein and the bases of the corresponding DNA. The method is shown to achieve Pearson correlation coefficient of 0.76 and 0.80 in a benchmarking test against experimentally determined change of the binding free energy caused by mutations in the binding protein or DNA, respectively. Furthermore, three datasets collected from literature were used to do blind benchmark for SAMPDI-3D and it is shown that it outperforms all existing state-of-the-art methods. The method is very fast allowing for genome-scale investigations.
It is available as a web server and a stand-code at http://compbio.clemson.edu/SAMPDI-3D/.
Supplementary data are available at Bioinformatics online.
1 Introduction
Protein–DNA interactions (PDIs) mediate many vital biological processes, such as transcription, replication and repair. Mutations in the binding protein or cognate DNA may affect PDIs and interaction networks by altering binding specificity and affinity. Such alterations of the wild-type PDI are frequently the causality of various diseases, including autism spectrum disorder, cancer and Alzheimer’s disease (Jiao et al., 2020; Wells et al., 2019). Furthermore, understanding the effect of mutations on PDIs is not only important for classifying mutations into pathogenic or benign (Livingstone et al., 2017; Williamson et al., 2020) but also vital for developing therapeutic solutions (Chan et al., 2008) and revealing the reasons of drug resistance (Stiewe and Haran, 2018). Quantifying these effects on PDIs requires evaluating the changes of binding free energy (ΔΔG) induced by mutations. While there are numerous reports of high-throughput experimental studies of effects of mutations on PDIs, they provide only the ranking of the affinity changes, but for ΔΔG, still rely on traditional experiments(Katsamba et al., 2002; Ryder et al., 2008; Stockley, 2009; Velazquez-Campoy et al., 2004; Vivian and Callis, 2001).
For protein mutations, there are several widely used experimental methods evaluating the effect of mutations on the PDIs. For example, electrophoretic mobility shift assay (EMSA) estimates the Kd value to examine the binding affinity between protein and DNA that based on the different electrophoretic mobility of protein–DNA complex and free DNA. Isothermal titration calorimetry (ITC) provides thermodynamic parameters related to the PDIs but requires a large amount of protein and DNA samples (Yang et al., 2016). Surface plasmon resonance (SPR) and fluorescence methods can obtain the kinetics of the PDI at high concentrations of samples (Liang et al., 2021). Besides the above methods, there are high-throughput methods for studying the effect of DNA mutations on PDIs. Protein binding microarrays (PBMs) and related methods utilize fluorescent antibodies against proteins to determine the binding to transcription factors (Berger et al., 2006). High-throughput systematic evolution of ligands by exponential enrichment (HT-SELEX) is a method of enriching small populations of bound DNAs from a random sequence pool through polymerase chain reaction amplification (Riley et al., 2014). Recently BEMSER method was reported that estimates transcription factors (TF) specificity by using the universal PBM data (Zhao et al., 2012). More recently, the relative affinity of TF was evaluated by combining EMSA and HT-SELEX methods (Dantas Machado et al., 2020). Both above mentioned works provide valuable insights for protein–DNA binding, but their predictions are still based on PBM or HT-SELEX data, and thus do not result in predicting ΔΔG. Because of that, one still uses the traditional experimental methods to measure binding affinity but they are time-consuming and costly for high-throughput studies.
Such a pressing needs for methods of predicting protein–DNA ΔΔG caused by protein mutations have resulted in development of several computational methods, including mCSM-NA (Pires and Ascher, 2017), SAMPDI (Peng et al., 2018) and PremPDI (Zhang et al., 2018). The mCSM-NA (Pires and Ascher, 2017) method is based on graph-based structural signatures to predict the ΔΔG caused by mutations in proteins bound to DNA/RNA. Our previous SAMPDI method is based on modified molecular mechanics Poisson-Boltzmann surface area (MM/PBSA) method enriched with knowledge-based terms to predict the ΔΔG of protein–DNA upon single-protein mutation. The PremPDI (Zhang et al., 2018), which was developed recently, is a method based on energy minimization and side-chain optimization algorithms to predict the ΔΔG upon single protein mutation. However, none of the abovementioned methods attempted to explore the effect of DNA nucleotide mutations on protein–DNA ΔΔG.
Broadly speaking, the computational methods for predicting protein–DNA ΔΔG can be grouped into three classes: first principle-based (including MM/PBSA), machine learning (ML) and empirical. In the recent years, ML approaches became very popular because of their advantage to utilize a variety of features (structural, sequential, energetical and other features) to predict ΔΔG, and thus allowing for more extensive ‘parametrization’, which in turn improves the predictions. However, the intrinsic data-driven nature of the ML method relies on a large and high-quality experimental dataset. The training set of the previous methods was derived from the ProNIT database (Kumar et al., 2006), which is no longer updated after 2013 and it only included hundreds available experimental data points. Thus, ML protocol applied on such small dataset, compared with ML protocol trained on thousands experimental data points, may not be able to find existing patterns, which result in a protocol that is overfitted. Perhaps this was the reason why ML approaches were not extensively applied to predict protein–DNA ΔΔG. However, with the progress on experimental works, the pool of data points increases and many new mutations with high-quality experimental ΔΔGs have been published in recent years (Afek et al., 2020; Wang et al., 2020; Yang et al., 2016).
The above mentioned methods for predicting protein–DNA ΔΔGs, mCSM-NA (Pires and Ascher, 2017), SAMPDI (Peng et al., 2018) and PremPDI (Zhang et al., 2018), suffer of three main deficiencies: (i) the training set used in the developments was too small; (ii) the benchmarking did not include a blind set to test model’s performance and overfitting; and (iii) the existing methods model only evaluate the effect of protein’s mutations on ΔΔG. The last one is particularly important in terms of understanding molecular effect of DNA mutations affecting protein–DNA affinity and resulting in serious diseases, such as genetic disorder (Yoshiura et al., 2006) and cancers (Guo et al., 2018).
Here, we report a new development of protein–DNA ΔΔG predictor, SAMPDI-3D. The SAMPDI-3D is ML approach and uses a gradient boosting decision tree ML algorithm with features as physicochemical (PC) properties, structural properties of mutation site and protein–DNA interactions to predict the change of binding free energy resulting from either single point protein’s mutation or DNA’s mutation. The method achieves a Pearson correlation coefficient (PCC) of 0.76 [and mean square error (MSE) = 0.53 kcal/mol] and 0.80 (MSE = 0.39 kcal/mol) for mutations in protein or DNA as benchmarked against 419 protein and 463 DNA experimental ΔΔGs taken from the ProNIT (Kumar et al., 2006) database and literature. The SAMPDI-3D uses a much larger training set than previously reported approaches to avoid the risk of overfitting and it is shown to outperform existing state-of-the-art methods on the blind datasets. In addition, the performance of SAMPDI-3D on distinguishing disruptive mutations is much better than other existing methods. The online web server and standalone code of SAMPDI-3D are freely available at http://compbio.clemson.edu/SAMPDI-3D/, which combined with the high computational speed makes the method excellent tool for genome-scale investigations.
2 Materials and methods
2.1 Dataset preparation
There are two databases: ProNIT (Kumar et al., 2006) and dbAMEPNI (Liu et al., 2018), which document experimentally determined values of changes of protein–DNA binding free energies (ΔΔG) upon mutations, derived from the published literature for protein-nucleic acid complexes with available experimental 3D structures. However, ProNIT is no longer updated and dbAMEPNI only focuses on single alanine-scanning mutations. In view of the above mentioned reasons, we respectively constructed two datasets containing cases of the single mutations in protein or DNA with available ΔΔGs and 3D structures. Meanwhile, three blind sets were compiled to test SAMPDI-3D performance and to compare it with other methods. The number of disruptive and non-disruptive mutations in each dataset could be found in Supplementary Table S2. Training and blind datasets are available at http://compbio.clemson.edu/SAMPDI-3D/.
2.1.1 Training set for predicting ΔΔGs caused by mutations in the binding protein
For the mutations in protein, we combined the training set constructed by Zhang et al. (2018) with the latest mutations collected from the literature as our training set. Zhang’s study used 219 single mutations (called S219) for training and testing, which were collected from ProNIT and dbAMEPNI. To prevent overfitting, we collected additional 200 single mutations (called S200) with experimental ΔΔGs and wild-type 3D structures from the literature published in recent years that are not included in the ProNIT database. Then, we merged S219 and S200 datasets resulting in 419 single mutations in 96 proteins for training and testing (S419 dataset). It should be mentioned that our training set is almost twice larger that dataset used for development and testing in mCSM-NA and PremPDI.
2.1.2 Training set for predicting ΔΔGs caused by mutations in DNA
For the mutations in DNA, our training set combined the ProNIT database and data from recent literature. It comprises 245 single mismatches and 218 single base-pair substitutions, a total of 463 mutations in 30 proteins with quantitatively characterized ΔΔGs, among them 123 were taken from ProNIT database. This dataset is termed D463.
2.1.3 ‘Blind’ set for comparing existing methods performance
As mentioned in the introduction, mCSM-NA used 222 single mutation cases (called S222) for training and testing. PremPDI used S219 dataset, which is taken from mCSM-NA training set and dbAMEPNI. To compare SAMPDI-3D with them, we also trained SAMPDI-3D of the same dataset (S219), and used the newly created S200 as a blind test. This is done to avoid dependence of the training set and set up SAMPDI-3D on the same footage as the other methods assuring fair comparison.
2.1.4 Blind set for benchmarking SAMPDI-3D prediction for DNA mutations
To test the performance of SAMPDI-3D model, a blind set of relative binding affinity changes upon single base pair substitution in the PDIs have been constructed by using recent experimental data (Jolma et al., 2013; Yang et al., 2017). The blind set includes 227 DNA single base pair substitution from 18 TFs, termed T227 dataset. The only software capable of modeling ΔΔGs in such cases is FoldX. Therefore, SAMPDI-3D and FoldX performance was compared on T227 dataset by using the PCC between relative binding affinity changes (ΔΔM) and predicted ΔΔG. Complete details of the dataset and ΔΔM could be found in Supplementary Material.
2.1.5 Blind set for distinguishing disruptive from non-disruptive protein mutations
We constructed a new blind dataset, which contains 101 single alanine mutations in 28 proteins obtained from dbAMEPNI (Liu et al., 2018). Since this dataset is without experimental ΔΔGs and only includes descriptions of the impact of mutations on affinity or activity, we classified these mutations into disruptive and non-disruptive based on the provided description (dataset is termed D101). The specific classification conditions could be found in Supplementary Material.
2.2 SAMPDI-3D feature design
2.2.1 SAMPDI-3D features for predicting ΔΔGs caused by protein’s mutation
(1) PC properties feature
We have used a set of nine amino acid properties, which have been previously compiled in our published works (Li et al., 2020; Pahari et al., 2020) to predict the changes in protein–DNA binding free energies upon point mutations.
(2) Protein secondary structure element (SSE) propensity
(3) Amino acid properties
We selected four structural features: secondary structure, solvent accessibility and IUPAC peptide backbone torsion angles (PSI, PHI). All of them were obtained by DSSP (Kabsch and Sander, 1983).
(4) Protein–DNA interactions
To reflect the interactions between protein and DNA, we use DSSR (Lu, 2020) to recognize and output contacts, hydrogen bonds and stacking interactions.
(5) Experimental condition
Due to different experimental conditions, we also used pH as a feature.
2.2.2 SAMPDI-3D features for predicting ΔΔGs caused by DNA’s mutations
In addition to protein SSE propensity and PDIs features described above, the following new features were considered:
(1) knowledge-based terms
We labeled each different type of DNA mutation. For example, AT to AA is labeled 1, AT to AC is labeled 2 and AT to GC is 3 and so on. We also used binary 0 and 1 to represent whether it is a mismatch and whether it is an AT base pair.
(2) Structural feature of mutation site
We used 18 base parameters to describe the structural characteristics of the mutation site, which includes base-pair parameters, base-pair step parameters and base-pair helical parameters. More detailed definition can be found in DSSR software (Lu, 2020).
2.3 Regression model development
The SAMPDI-3D model was built and trained using gradient boosted decision trees algorithm, which was implemented by the XGBoost python version (Chen and Guestrin, 2016). It is known to have the advantage to overcome the overfitting effect compared with many other ML methods (Lv et al., 2020) and also works better on unbalanced datasets (Friedman, 2001). For predicting ΔΔG upon a given mutation, we developed a regression model by using knowledge-based features, structural information and PDI as described above. We trained our model against 80% of the training set present in our compiled dataset and tested it against the remaining 20% data. We also analyzed the importance of each feature by using XGBoost. While we tested many different features, above we outline only features that were shown by XGBoost to have high impact on the performance. All other tested features were removed from the model.
3 Results
3.1 SAMPDI-3D training and testing
Overfitting is one of our chief concerns while getting more training data is the best option to avoid it. Here, we trained SAMPDI-3D on the two largest available datasets (S419 and D463, respectively and defined in Methods and Materials) containing experimental ΔΔGs for protein or DNA mutations in protein–DNA complex, which were taken from ProNIT (Kumar et al., 2006) and literature. Our models show the PCCs of predicted with expected/experimental values is 0.76 (with MSE 0.53 kcal/mol) and 0.80 (with MSE of 0.39 kcal/mol) for mutations in protein or DNA when tested on 20% of the dataset. Figure 1a and b depicts the regression plots between experimental and predicted ΔΔGs.
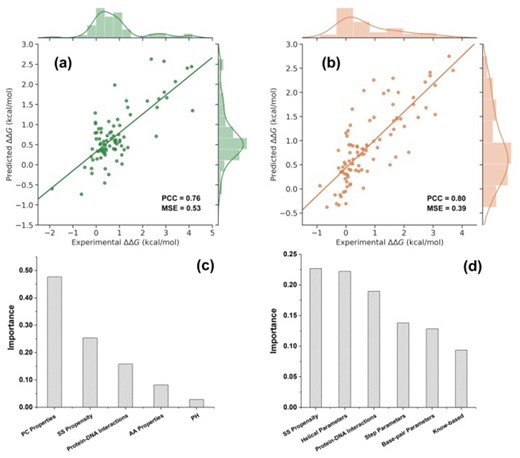
Plot of SAMPDI-3D predicted ΔΔGs against experimental ΔΔGs in case of 20% of cases in: (a) S419 dataset of ΔΔGs caused by mutations in the corresponding protein and (b) D463 dataset of ΔΔGs caused by mutations in DNA. The importance level of each feature selected for predicting ΔΔGs in case protein mutation (c) and DNA mutations (d). MSE are given in kcal/mol
3.2 Feature importance analysis
The SAMPDI-3D is based on descriptors extracted from the protein–DNA 3D structure and sequence. Although we tried numerous features, the goal was to minimize the number of features without compromising the accuracy, so to avoid overfitting. Finally, four types of features are used to develop the model to predict ΔΔGs caused by a single point mutation in the protein: (i) PC properties feature (Li et al., 2020; Pahari et al., 2020); (ii) protein secondary structure; (iii) interactions between protein and DNA; (iv) experimental pH. The numbers of features in each type are included in Supplementary Table S3. In the model of predicting ΔΔGs caused by a mutation in DNA, besides the above features, DNA structure at the mutations site is also considered. To get further insights into the relative contributions of features, we used the decision tree algorithm implemented in the XGBoost (Chen and Guestrin, 2016) to train our model, and gradient boosting to calculate the importance of the features(Chen and Guestrin, 2016). It can be seen in Figure 1c and d that PC properties is the most important feature to predict ΔΔGs caused by mutations in the protein. This finding reflects previous observations that the type of amino acid substitution is one of the most informative metrics identifying disease-causing SNPs (David and Sternberg, 2015; Vitkup et al., 2003). SSE propensity is the second highest and the highest important feature for predicting ΔΔGs caused by protein and DNA mutations, respectively. This finding is along the lines of previous investigations indicating that protein structure is an essential factor in protein–DNA recognition (Rohs et al., 2010). The third highest contributing feature is the interaction between protein and DNA, which means hydrogen bonds, contacts and base-pair stacking also play important roles in the process of protein -DNA binding (Kool, 2001; Rohs et al., 2009; Rutledge et al., 2007). It should be emphasized that in both models, the number of features were kept as few as possible and this was indeed achieved without compromising the accuracy.
3.3 Evaluating the performance on the blind datasets
3.3.1 Performance for the mutations in protein
To compare the SAMPDI-3D with other existing state-of-the-art methods, including SAMPDI, PremPDI, mCSM-NA and FoldX, we used S219 as a training set. Among the above mentioned methods, PremPDI and mCSM-NA are ML methods and were trained on S222 or S219. Thus, the new set S200 that we developed can serve as a blind test. To assure fair comparison, we re-trained SAMPDI-3D on the same dataset, the S219 set. Results are shown in Table 1. One can see (Table 1) that SAMPDI-3D PCC of five-fold cross-validations can still reach 0.73 with only a slight increase in MSE, comparing with training on the S419. It is noted that SAMPDI possesses the lowest MSE because only 105 interfacial mutations are included in its training set. Table 1 summarizes the results and shows that SAMPDI-3D outperforms other approaches, some by a large margin, especially on blind dataset. Furthermore, we evaluated the difference between SAMPDI-3D predictions and other methods prediction and obtained P-values indicate that SAMPDI-3D is quite different from the rest (Table 1). Also, our model keeps similar performance on interfacial and non-interfacial blind sets (Supplementary Table S4).
Comparison of different methods on S200 datasets
| Method | Cross-validation | Blind test(S200) | |||
|---|---|---|---|---|---|
| PCC | MSE | PCC | MSE | P-value | |
| FoldX | NA | NA | 0.07 | 7.12 | 1.00e-4 |
| mCSM-NA | 0.54 | NA | 0.28 | 2.13 | 4.36e-2 |
| PremPDI | 0.71 | 0.74 | 0.30 | 1.38 | 6.94e-2 |
| SAMPDI | 0.58 | 0.29 | 0.15 | 1.12 | 1.20e-3 |
| SAMPDI-3D | 0.73 | 0.72 | 0.43 | 0.90 | |
MSE of ΔΔG prediction in kcal/mol.
‘NA’ indicates data are unavailable.
P-value was obtained by using the Fisher r-to-z transformation to assess the significance of the difference between two correlation coefficients.
3.3.2 Performance for the mutations in DNA
Since we used all the collected data to train our SAMPDI-3D for predicting the DNA mutations, we further built a blind test set, which consisted of 227 DNA single base pair substitution from 17 TFs (T227 dataset). For this blind test set, the relative binding affinity (ΔΔM) was constructed by using the recent experimental data. Due to the lack of comparable ML methods, we compared our method with FoldX. The results are shown in Table 2 and it is shown that SAMPDI-3D performs much better that FoldX achieving a correlation coefficient of 0.42, compared with a correlation coefficient of 0.17 for FoldX (Table 2). It is also indicated that SAMPDI-3D predictions are distinctively different from FoldX resulting in low P-value (Table 2). The results on interfacial and non-interfacial blind sets also show that the performance of SAMPDI-3D is better than FoldX (Supplementary Table S5).
Comparative performance of SAMPDI-3D on T227 blind dataset
| Method | Blind test(T227) | |
|---|---|---|
| PCC | P-value | |
| SAMPDI-3D | 0.42 | |
| FoldX | 0.17 | 2.10e-3 |
| Method | Blind test(T227) | |
|---|---|---|
| PCC | P-value | |
| SAMPDI-3D | 0.42 | |
| FoldX | 0.17 | 2.10e-3 |
Comparative performance of SAMPDI-3D on T227 blind dataset
| Method | Blind test(T227) | |
|---|---|---|
| PCC | P-value | |
| SAMPDI-3D | 0.42 | |
| FoldX | 0.17 | 2.10e-3 |
| Method | Blind test(T227) | |
|---|---|---|
| PCC | P-value | |
| SAMPDI-3D | 0.42 | |
| FoldX | 0.17 | 2.10e-3 |
3.4 The ability of SAMPDI-3D to identify disruptive and non-disruptive mutations
3.4.1 SAMPDI-3D to identify disruptive and non-disruptive mutations in protein and DNA
It is almost certain that disruptive mutations are disease-causing, while non-disruptive may or may not be benign. Thus, mutations may not completely abolish the formation of complexes, and they will be classified as non-disruptive, but may change binding affinity or specificity to an extent to cause disease. To further evaluate the performance of our method, we performed Receiver Operating Characteristics (ROC) analysis to classify mutations into disruptive and non-disruptive based on binding free energy changes. Here, we classify the disruptive mutations as |ΔΔG|>1 kcal/mol and non-disruptive as |ΔΔG|<1 kcal/mol. This threshold is also successfully employed in SAMPDI (Peng et al., 2018) and PremPDI (Zhang et al., 2018). Figure 2a shows the ROC of SAMPDI-3D for 419 protein mutations (S419 dataset) and 463 DNA mutations (D463 dataset) which are classified into disruptive and non-disruptive based on above threshold. The resulting area under the curve (AUC) is 0.91 and 0.93, respectively, indicating the excellent capability of SAMPDI-3D to distinguish disruptive from non-disruptive mutations.
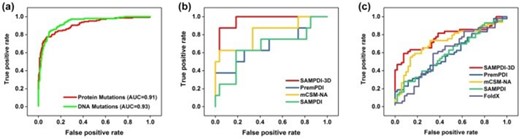
ROC Curves for (a) predicting mutations disrupting PDIs using SAMPDI-3D, (b) predicting protein mutations disrupting PDIs using different methods and (c) SAMPDI-3D with other methods applied on blind dataset
3.4.2 Comparison of SAMPDI-3D with other methods
We also compared the performance on several existing state-of-the-art ML methods, but none of their training sets were the same as ours. To fairly compare the performance of SAMPDI-3D with other methods in distinguishing disruptive and non-disruptive protein mutations, we chose the 35 overlapped protein mutations from the training set used for developing SAMPDI, mCSM-NA and PremPDI. Results are shown in Figure 2b.
Figure 2b indicates the excellent performance of SAMPDI-3D in predicting disruptive and non-disruptive protein mutations comparing with other methods. It achieves Matthews correlation coefficient (MCC) of 0.84 and AUC of 0.96 with an accuracy and precision of 0.94 and 0.88 respectively (Supplementary Table S1). All other methods perform much worse.
3.4.3 Comparison of SAMPDI-3D with other methods on the blind dataset
We also constructed a blind dataset to distinguish between disruptive and non-disruptive mutations. The blind dataset contains 101 single alanine mutations in 28 proteins obtained from dbAMEPNI (Liu et al., 2018) and is classified into disruptive and non-disruptive based on the impact over affinity (D101 dataset). ROC curves are shown in Figure 2c and AUC, accuracy and MCC values are presented in Table 3, it demonstrates that the performance of SAMPDI-3D is notable in estimating protein mutation effects (disruptive) for blind dataset and it is better than other methods.
Performance of SAMPDI-3D and other methods in predicting disruptive and non-disruptive protein mutations
| Method | Accuracy | Precision | MCC | AUC |
|---|---|---|---|---|
| SAMPDI-3D | 0.76 | 0.88 | 0.55 | 0.78 |
| SAMPDI | 0.62 | 0.62 | 0.26 | 0.60 |
| PremPDI | 0.60 | 0.70 | 0.22 | 0.59 |
| mCSM-NA | 0.71 | 0.69 | 0.42 | 0.72 |
| FoldX | 0.63 | 0.64 | 0.25 | 0.60 |
| Method | Accuracy | Precision | MCC | AUC |
|---|---|---|---|---|
| SAMPDI-3D | 0.76 | 0.88 | 0.55 | 0.78 |
| SAMPDI | 0.62 | 0.62 | 0.26 | 0.60 |
| PremPDI | 0.60 | 0.70 | 0.22 | 0.59 |
| mCSM-NA | 0.71 | 0.69 | 0.42 | 0.72 |
| FoldX | 0.63 | 0.64 | 0.25 | 0.60 |
3.5 Computational time
One of the important advantages of ML algorithms is that they are quite fast, and thus suitable for high-throughput predictions. Here, we compare the computational time of SAMPDI-3D with other existing methods to predict single mutations for a given protein–DNA complex (PDBID: 5E24). The results are averaged over 10 independent runs. Since the stand code is not provided in some methods, calculating time is affected by the computing resources and network. The actual time consuming is based on the statistics from submitting the task to obtaining the result. Table 4 shows a rough estimation of the execution time. One can see from Table 4 that SAMPDI-3D is the fastest method which only takes 1.5 s for ΔΔG prediction caused by a single mutation when tested on the one core of Intel 6148 CPU.
Comparison of time of calculation for a single prediction between different ΔΔG predictors
| Method | Time of calculation |
|---|---|
| FoldX | 1 min |
| mCSM-NA | 1 min |
| PremPDI | 80 min |
| SAMPDI | 24 min |
| SAMPDI-3D | 1.5 s |
| Method | Time of calculation |
|---|---|
| FoldX | 1 min |
| mCSM-NA | 1 min |
| PremPDI | 80 min |
| SAMPDI | 24 min |
| SAMPDI-3D | 1.5 s |
3.6 SAMPDI-3D webserver implementation
Our SAMPDI-3D provides a user-friendly web server, which consists of user interface, the local server and the job backend. The web server is freely accessible at http://compbio.clemson.edu/SAMPDI-3D/. It is hosted on a light-duty computer server. Three alternatives are available: (i) predict the effect of one single mutation in protein or DNA specified via the users in the given boxes. Users need to provide the structure of the protein–DNA complex by uploading the file in the PDB format. In this way, users can submit a single job. (ii) Predict the effect of single mutations in protein or DNA specified by a list file, user needs to upload the protein in PDB format and mutations list file as well. For the multiple job option, the predicted ΔΔGs are summarized in a downloadable text file with the same order as in the input ‘List_Mutations.txt’ file. (iii) Users can also directly download the SAMPDI-3D stand-alone code from our webpage. Detailed descriptions are included in the readme file that helps user to use the stand-alone code.
4 Discussion
In the last decades, the rapid development of whole-genome technology had significantly reduced the cost of gene sequencing, leading to the widely available genome data (Stefl et al., 2013). However, revealing the effect of genetic variants with experimental approaches is time-consuming and expensive. Hence, computational prediction tools and algorithms are being widely and increasingly utilized in biology and medical research (Li et al., 2020, 2021). Among them, predicting changes of protein–DNA affinity caused by the variants through ML is one of the most popular strategies. However, the existing ML methods are trained on limited datasets, not capable of dealing with DNA mutations, not tested on blind datasets and not fast enough to be applied on genome-scale investigations.
Here, we report a new ML approach, the SAMPDI-3D, which predicts the change of protein–DNA binding free energy caused by mutations utilizing PC properties, structure of mutation site and protein–DNA interactions. Important distinction of SAMPDI-3D and other methods is that SAMPDI-3D uses much larger training set and thus avoids overfitting. SAMPDI-3D outperforms all existing methods on various benchmarking tests, including test of discriminating disruptive versus non-disruptive mutations. In addition, SAMPDI is the only ML method that allows for predicting ΔΔGs caused by DNA mutations. Lastly, SAMPDI-3D is very fast making it applicable for genome-wide studies to assess the effect of amino acid and DNA mutations on protein–DNA binding.
Funding
This work was supported by the National Institutes of Health [R01GM125639]. E.A. was supported by grants from National Institutes of Health [R01GM093937 and P20GM121342].
Conflict of Interest: none declared.

