


Abstract
We are increasingly accumulating complex omics data that capture different aspects of cellular functioning. A key challenge is to untangle their complexity and effectively mine them for new biomedical information. To decipher this new information, we introduce algorithms based on network embeddings. Such algorithms represent biological macromolecules as vectors in d-dimensional space, in which topologically similar molecules are embedded close in space and knowledge is extracted directly by vector operations. Recently, it has been shown that neural networks used to obtain vectorial representations (embeddings) are implicitly factorizing a mutual information matrix, called Positive Pointwise Mutual Information (PPMI) matrix. Thus, we propose the use of the PPMI matrix to represent the human protein–protein interaction (PPI) network and also introduce the graphlet degree vector PPMI matrix of the PPI network to capture different topological (structural) similarities of the nodes in the molecular network.
We generate the embeddings by decomposing these matrices with Nonnegative Matrix Tri-Factorization. We demonstrate that genes that are embedded close in these spaces have similar biological functions, so we can extract new biomedical knowledge directly by doing linear operations on their embedding vector representations. We exploit this property to predict new genes participating in protein complexes and to identify new cancer-related genes based on the cosine similarities between the vector representations of the genes. We validate 80% of our novel cancer-related gene predictions in the literature and also by patient survival curves that demonstrating that 93.3% of them have a potential clinical relevance as biomarkers of cancer.
Code and data are available online at https://gitlab.bsc.es/axenos/embedded-omics-data-geometry/.
Supplementary data are available at Bioinformatics online.
1 Introduction
We are flooded with large-scale omics data. They include genomic, proteomic, interactomic, metabolomic and other omic data. These data capture different aspects of cellular functioning and are typically modeled and analyzed as networks, where the nodes represent the biological macromolecules and the edges the relations between them. Often, a network is represented with an adjacency matrix, a square matrix whose elements indicate whether the corresponding nodes are adjacent.
With the increasing availability of omics data, it is important to represent and interpret each molecular network in an informative way that uncovers new biomedical information hidden in its complexity. For instance, the omics networks have been the input into data fusion methods that integrate and analyze them collectively to uncover the functional information and the molecular mechanisms of complex diseases that cannot be uncovered from any omic data type in isolation from others (Malod-Dognin et al., 2019; Pržulj and Malod-Dognin, 2016).
1.1 Motivation
Molecular networks have complex wiring patterns (topology) that needs to be ‘untangled’ to extract new biological information. To analyze these patterns, we rely on various types of clustering methods followed by enrichment analysis, or on computationally intensive machine learning models. Due to the complexity of network topology, methods that map a network in a low-dimensional space are used as a preprocessing step. For instance, nonlinear dimensionality reduction techniques, such as Multidimensional Scaling (MDS) (Chen et al., 2008), Principal Component Analysis (PCA), minimum curvilinear embedding (MCE) (Cannistraci et al., 2013) and Coalescent Embedding (Muscoloni et al., 2017) have widely been used. These techniques are not designed to embed objects only in low-dimensional space. They are often called geometric embeddings because in practice, they are used to map a network in a low-dimensional space, usually two or three dimensions, with a specific underlying geometry: MDS maps a network in Cartesian space and Coalescent Embedding in hyperbolic space. However, since the geometry of the embedding space of biological networks is still an open question, there has been a significant recent interest in novel methods that are not making any assumptions about the underlying geometry, or the dimensionality of the space.
Some of these methods are inspired by the advances in the field of Natural Language Processing (NLP), where words are represented as vectors in a d-dimensional space (word embeddings) (Mikolov et al., 2013b) and new knowledge is extracted directly with linear operations on the vectors in the space. Recent works extended the word embeddings to generate network embeddings (Grover and Leskovec, 2016; Perozzi et al., 2014; Tang et al., 2015a). In network biology, these vector representations of biomedical networks have been used as input into machine learning models to predict protein functions, drug-disease associations, drug–drug interactions and protein–protein interactions (PPI) [see Su et al. (2020) for more details]. Our aim is to generate embeddings of molecular networks, in a Euclidean space, and to exploit directly the underlying geometry of the embedded data points to uncover biological functions and disease mechanisms that are hidden in their wiring patterns. Importantly, we aim to generate embeddings based on the Nonnegative Matrix Tri-Factorization (NMTF) method (Ding et al., 2006) that has successfully been used in the biological context to analyze large-scale omics data types both in isolation from each other and collectively (Gligorijević et al., 2016; Malod-Dognin et al., 2019; Vitali, 2018; Žitnik et al., 2013).
1.2 Molecular data analysis and integration with NMTF
NMTF is a matrix factorization technique that was originally proposed for dimensionality reduction and for coclustering due to its connection with k-means clustering (Wang et al., 2008). NMTF decomposes an data matrix, A (e.g. the adjacency matrix representation of a biological network), representing the relations between n and m elements, into a product of three nonnegative, low-dimensional matrices, and , as , where factor G is the cluster indicator matrix of n elements (grouping n elements into k clusters), factor P is the cluster indicator matrix of m elements (grouping m elements into k1 clusters) and factor S is a compressed representation of the data matrix, A (relates the clusters in G to the clusters in P).
NMTF is also an intermediate data integration method (Žitnik and Zupan, 2015) that directly integrates all datasets through the inference of a single joint model. For instance, Gligorijević et al. (2016) applied an NMTF framework to integrate heterogeneous data, including somatic mutation data, molecular networks and drug chemical data. This enabled them to stratify ovarian cancer patients based on all data collectively and to predict drugs for repurposing that could be used in treatment of the identified patient subgroups (Gligorijević et al., 2016). Subsequently, Vitali (2018) used NMTF to fuse patient data (i.e. clinical data and somatic mutations) with gene-pathway and disease-gene associations, gene–gene interactions and disease-pathway relations, to identify patient subgroups in acute myeloid leukemia. Finally, NMTF has been used to integrate tissue specific molecular interaction networks of PPI, gene coexpressions (COEX) and genetic interactions into an integrated model of a cell, iCell (Malod-Dognin et al., 2019). Comparison of iCells of cancer and control tissues revealed novel cancer-related genes that could not have been identified by analyzing any tissue specific network individually (Malod-Dognin et al., 2019).
We investigate if we can further extract additional biological knowledge by using NMTF methods and in particular from matrix factor, G, either of a single network, or of a joint model. Each row of cluster indicator matrix, G, can be interpreted as the vector representation of a gene (or equivalently a protein, as a gene product) in k-dimensional space; motivated by the recent NLP research described in Section 1.3, as well as by the recent research on network embeddings described in Sections 1.4 and 1.5, we examine if we can apply simple linear operations on these vector representations (also called embeddings) of genes to uncover new biomedical information. To the best of our knowledge, this is the first method that exploits directly the proximity in the embedding space by doing simple linear operations to identify cancer genes; recent studies (e.g. Gumpinger et al., 2020) trained a classifier with the vectorial representations of genes to identify cancer-related genes.
1.3 NLP embeddings
In NLP, it has long been known that two words in a similar context have similar meanings (distributional hypothesis) (Harris, 1954). Following this observation, Mikolov et al. (2013b) introduced the word2vec model, which generates continuous representations of words as vectors in d-dimensional space. Importantly, words that appear frequently in the same context are placed close in the space. This method is based on the Skip-Gram architecture, a one-layer neural network combined with a softmax function, which seeks to maximize the dot product, , of vectors and , corresponding to word pairs, (w, c), in d-dimensional embedding space that co-occur in the corpus. However, this architecture is computationally intractable for a large lexical corpus and therefore has been replaced by the Skip-Gram with negative sampling (SGNS, for more details see Mikolov et al. (2013a)).
Importantly, the Skip-Gram model trained on the Google News corpus enables semantic, context-based, word comparisons (so called, similarity task) in the embedding space solely by computing the cosine similarity of their vector representations (Mikolov et al., 2013b). For instance, Paris and Berlin, both being capital cities, have similar vector representations and consequently, high cosine similarity. Also, they demonstrate that word representations learned by the Skip-Gram model can be meaningfully combined using just simple vector addition (Mikolov et al., 2013a). This enabled Le and Mikolov (2014) to define the vector representation of a phrase (sentence) as the average of the vector representations of its constituent words; more recent works (e.g. Lin et al., 2017; Palangi et al., 2016) train deep learning models to learn phrase representations, that respect the order of the words in the sentence. The vector representations of sets of words can then be compared by using simple linear operations, which allows for analyzing texts beyond the level of words, revealing semantic similarities between sentences, paragraphs or even between documents.
1.4 NLP-based network embeddings
Following the success of the Skip-Gram model, various attempts have been made to generalize it and apply it to networks: DeepWalk (Perozzi et al., 2014), LINE (Tang et al., 2015a) and node2vec (Grover and Leskovec, 2016). These methods rely on random walks to generate sequences of nodes, the equivalent of the lexical corpus, on which the Skip-Gram architecture can be applied. A network is embedded in a low-dimensional space in which the similarities between the nodes are preserved; network nodes are similar either when they belong to the same neighborhood, or community of the network (homophily similarity), or when they have similar topological roles, for instance being hub, or bridge nodes [also called structural (topological) similarity].
In network biology, the best analogy to homophily similarity is functional modules of interacting molecules, for instance, protein complexes of physically interacting proteins. However, function is not only shared between the proteins that physically interact (Sharan et al., 2007), or participate in the same functional module, e.g. in a biological pathway, or in a complex (Chen et al., 2014), but also between the proteins that have similar local wiring patterns (structural similarity in an network, noted above) regardless of their adjacency in the interaction networks (Milenković and Pržulj, 2008). The local wiring patterns are usually quantified by measures that rely on graphlets (small, connected, nonisomorphic and induced subgraphs) (Pržulj et al., 2004). In particular, wiring patterns around nodes are represented by graphlet degree vectors (GDVs) and the structural (topological) similarity between two nodes by the similarity of their GDVs (Milenković and Pržulj, 2008) (see Sections 2 and 2.2.2). Thus, an important challenge is to generate embeddings that locate close in space nodes with similar wiring patterns.
1.5 Network embeddings as matrix factorization
Interestingly, Levy and Goldberg (2014) showed that the SGNS is implicitly factorizing a word-context matrix, called PPMI (Church and Hanks, 1990) (for details, see Section 2.2), whose cells quantify how frequently two words coappear in a lexical corpus, shifted by a global constant. Subsequently, Qiu et al. (2018) showed that the Skip-Gram-based network embeddings are also implicitly factorizing a random-walk-based mutual information matrix, M (a diffusion on the original network). They presented a closed formula to approximate matrix M and they generated the embedding space by applying Singular Value Decomposition (SVD) on this matrix M. Thus, in both cases (words and networks), the Skip-Gram-based embeddings are approximating the exact factorization of the mutual information matrix.
In the field of NLP, they use the neural networks-based embeddings rather than to explicitly factorize the PPMI matrix due to its size. For instance, the size of the widely used Google News corpus is 1 million words and thus the exact factorization of the corresponding 1 million times 1 million PPMI matrix is computational intractable [time complexity of SVD is ]. On the other hand, the size of the PPMI matrix of the Homo sapiens PPI network is roughly 17 000 rows times 17 000 columns, which makes its decompositions, either with SVD, or NMTF [time complexity of NMTF is ], still feasible.
This motivates us to investigate whether the equivalent properties of word embeddings (outlined in Section 1.3) also hold for molecular networks if we decompose either their PPMI matrix, or their adjacency matrix representation with our NMTF-based framework.
1.6 Contributions
We motivate the use of the PPMI matrix to represent the human PPI network and we introduce the GDV PPMI matrix (see Section 2.2.3) to capture the structural (topological) similarities of network nodes. We demonstrate that genes that are close in the embedding space, generated by the decompositions of the PPMI matrix, or the GDV PPMI matrix, with the NMTF framework, have similar biological functions. We do this by computing the percentage of enriched genes (see Section 2.4) in the clusterings that are obtained for each of the PPMI, GDV PPMI and the adjacency matrix factorizations of the human PPI network. In addition, we show that the PPMI decomposition captures more biological information in terms of enriched genes and clusters compared to the corresponding adjacency matrix decomposition.
Following the approach of Le and Mikolov (2014), we define the vector representation of biological entities (e.g. protein complexes, biological pathways) in the embedding space as the average of the vector representations of their constituent genes. To exploit the spatial closeness of functionally similar genes, we perform simple linear operations of their vector representations in the embedding space (e.g. cosine similarity between the vector representations of genes) to predict protein complex memberships and to identify new cancer genes. We demonstrate that in both cases, our simple functional prediction method that is based on proximity in the embedding space leads to higher prediction accuracy than the Support Vector Machine (SVM) classifier. Thus, the embedding space is functionally organized and we can extract biological knowledge directly with linear vector operations.
By doing simple linear operations, we identify cancer genes with prediction accuracy in the space generated by the NMTF-based decomposition of our newly defined GDV PPMI matrix. In addition, we further demonstrate the importance of our method by predicting novel cancer-related genes. We find literature evidence that 80% (12/15) of our top 15 predictions are cancer-related and that 93.3% (14/15) of our newly identified genes have a potential clinical relevance as biomarkers of cancer, supported by significant associations with patient survival (TCGA projects; The Cancer Genome Atlas, http://cancergenome.nih.gov/abouttcga).
2 Data and methods
2.1 Datasets
We collected the human experimentally validated PPI dataset, consisting of 16 781 genes (or equivalently, proteins), from BioGrid (version 3.5.179) (Oughtred et al., 2019). For each gene (or equivalently, protein, as a gene product) in the network, we collected the most specific (i.e. the annotations are not back-propagated to its ancestors in the Gene Ontology tree) experimentally validated Biological Process (BP) annotations present in the Gene Ontology (Ashburner et al., 2000), from the NCBI’s database (downloaded on October 8, 2019). Additionally, we downloaded human protein complexes from CORUM (version 3.0) (Giurgiu et al., 2019). Finally, we collected the set of all known cancer-driver genes, as well as the set of 283 high confidence cancer-driver genes of 12 tumors (Tamborero et al., 2013) from IntOGen (Release date November 12, 2019) (Gonzalez-Perez et al., 2013).
2.2 Representation of molecular networks
In this section, we present the representation of word relations by the PPMI matrix in NLP and its adoption to node relations in a network. Additionally, we present the GDV similarity matrix that captures the topological similarities of nodes in a network. Based on the GDV similarity matrix, we define our new GDV PPMI matrix.
2.2.1 PPMI
In a lexical corpus (e.g. a passage or a document), the association between words is encoded by the PPMI matrix, whose rows and columns represent words and the cells quantify if two words co-occur more frequently than expected at random assuming they are independent.
The Skip-Gram-based network embeddings that rely on random walks, such as DeepWalk (Perozzi et al., 2014), LINE (Tang et al., 2015a), PTE (Tang et al., 2015b) and node2vec (Grover and Leskovec, 2016), are implicitly factorizing the random-walk-based mutual information matrix, M (Qiu et al., 2018). This matrix is equivalent to the PPMI matrix on networks, as its cells quantify how frequently two nodes, i and j, of the network co-occur in a random walk. Formally, each entry, Mij, is the logarithm of the average probability that node i randomly walks to node j in a fixed number of steps.
2.2.2 GDV similarity
The most sensitive measures to capture topological similarities in networks are based on graphlets (Yaveroǧlu et al., 2014). Graphlets have extensively been used for measuring the topological similarities between nodes in biological networks (Milenković and Pržulj, 2008), as well as the building blocks for network alignments (GRAAL family, e.g. Malod-Dognin and Pržulj, 2015). They are defined as connected, nonisomorphic, induced subgraphs of large networks (Pržulj et al., 2004). Different topological positions within graphlets are characterized by different symmetry groups of nodes, called automorphism orbits (Pržulj, 2007). Orbits are used to generalize the notion of node degree: the graphlet degrees of a node are the numbers of times a node is found at each orbit position. Yaveroǧlu et al. (2014) showed that between the orbits, there exist redundancies, as well as dependencies, and proposed a set of 11 nonredundant orbits of 2- to 4-node graphlets (see Supplementary Fig. S1). Thus, each node in the network has its 11-dimensional vector called GDV, that captures the 11 nonredundant graphlet degrees of the node.
GDVDist values range from 0 to 1. When two nodes have identical GDVs, their distance is equal to 0. To transform distance to similarity, we apply a linear transformation: . The pairwise GDV similarities of all nodes in a network are represented in the GDV similarity matrix.
2.2.3 GDV PPMI
Structural similarities between nodes (proteins) in a PPI network, as quantified by graphlet-based measures, have been shown to be related to their biological functions (Davis et al., 2015). For instance, Milenković and Pržulj (2008) used the GDV similarity matrix to classify proteins into complexes based on their GDV vector similarities. We apply the same methodology to compute the GDV similarities of cancer-driver genes (collected from IntOGen) and we observe that they are statistically significantly different from the other ones (see Section 3.3). This motivates us to introduce the GDV PPMI-based embeddings, which preserve the structural similarities of nodes. In particular, we apply the PPMI closed formula (see equation 2) to the GDV similarity matrix and we obtain the GDV PPMI matrix. We generate embeddings by decomposing the GDV PPMI matrix with the NMTF framework, or with the SVD.
2.3 Matrix factorization techniques
In this section, we present the matrix factorization techniques that we use to decompose three different representations of molecular networks: adjacency matrix, PPMI matrix and GDV PPMI matrix. First, we present the SVD-based decomposition, which is used to generate network embeddings by explicitly factorizing the random-walk-based PPMI matrix of a network, and then our NMTF-based decomposition.
2.3.1 SVD
SVD is a matrix factorization technique from linear algebra that factorizes matrix, M, into the product of three matrices as: where U and V are orthonormal and Σ is a diagonal matrix with nonnegative real numbers in the diagonal. The diagonal entries of Σ are known as the singular values of M and are in descending order. Note that U and V can have negative entries, which is the main difference between the SVD and the NMTF framework.
Let Σd be the diagonal matrix formed by the top d singular values. Then matrix represents the vector embeddings in d-dimensional space. Levy and Goldberg (2014) empirically proved that a symmetric variant of the SVD-based embedding space, , is better for word similarity tasks and achieves solutions that are at least as good as the SGNS’s solutions. Subsequently, Qiu et al. (2018) used this variation to generate the embedding space from the factorization of the DeepWalk closed formula. Following these observations, we use this variation to generate the SVD-based embeddings and we compare the performance (results) of our NMTF-based embeddings with them in similarity tasks.
2.3.2 Orthonormal NMTF
Given an input matrix, X, our orthonormal NMTF (ONMTF) framework decomposes it into three nonnegative matrix factors, G, S and as , where G contains the vector representations of the entities of X in the embedding space, S is a compressed representation of network X and PT is the orthonormal basis of the embedding space. Importantly, the orthonormality constraint () leads to independent, nonambiguous directions in the embedding space.
This optimization problem is NP-hard, thus to solve it we use a fixed point method that starts from an initial solution and iteratively uses the multiplicative update rules (Ding et al., 2006), derived from the Karush–Kuhn–Tucker conditions, to converge toward a locally optimal solution (see Supplementary, NMTF multiplicative update rules).
2.4 Vector operations in the embedding space
Gu et al. (2017) showed that the embedding spaces generated by random-walk-based embedding algorithms are metric spaces with inner product; these spaces are generalizations of Euclidean spaces (in which the inner product is the dot product) to vector spaces of any (possibly infinite) dimension. Hence, in the embedding space we can compare two genes (proteins) by computing the cosine similarity of their vector representations.
2.5 Predictions based on vector linear operations
We demonstrate, based on the enrichment analysis (see Section 3.1), that the proximity of genes in the embedding space of the human PPI network, for all methods, is characterized by similarity in their function. However, since all the tested embedding methods are heuristics (i.e. the problems we are addressing here are mathematically provably impossible to solve exactly on large datasets, so our only way of solving them is by using approximate methods, called heuristics), they are bound to achieve varying performances depending on the task. Thus, we do not use the enrichment analysis result as a preprocessing step to prioritize, or select methods for the rest of our experiments. We exploit the functional organization of the embedded data points to assign proteins to complexes and to identify cancer-related genes by doing vector operations in the embedding space.
To assess the quality of the predictions for the protein complexes (collected from CORUM), we keep the complexes with minimum size of 4 to avoid having protein complexes with two elements after the creation of the training/test set. We create the test set (consisting of about 20% of the proteins) by randomly selecting one protein from each complex. The rest of the proteins from the complexes are used as the training set to generate the embedding of each protein complex as the average of the vector representations of its constituent proteins (see Section 2.4). Then, we compute the cosine similarity between the vectors corresponding to the proteins of the test set and the vectors corresponding to the complexes (obtained from the training set as described above) and we assign the proteins to the complex with the maximum cosine similarity.
For the cancer-driver genes, we separate the proteins of the PPI network into cancer drivers (283 high confidence cancer drivers) (Tamborero et al., 2013) and the background genes (those that have no evidence in the dataset of being drivers). To assess whether our method identifies correctly cancer-driver genes, we perform 5-fold cross-validation. We split the cancer-driver genes in training/test sets and we use the training set to generate the average embedding of the cancer-driver genes. Then we identify the genes as cancer-drivers, if their cosine distance from the embedding of cancer-driver genes is smaller than their cosine distance from the embedding of background genes.
To predict novel cancer-related genes, we use all the known driver genes to generate the embedding of the cancer-driver genes as described in Section 2.4 and we rank the background genes in the ascending order based on their cosine distance from the average embedding of cancer drivers. The one with the smallest cosine distance (the highest cosine similarity) is the most likely to be cancer related.
To systematically evaluate the predictive performance of our approach, we repeat the train/test process, for the protein complexes and the cancer-driver genes, 20 times and we compute the average percentage of correct predictions (accuracy). As a baseline for comparison with our function assignment strategy (membership in a protein complex, or being cancer-related) we use the SVM, a state-of-the-art binary classifier for vectorial data that has recently been used to predict cancer-related genes (Gumpinger et al., 2020), or protein function, which is a multiclass classification problem in the embedding space (Cho et al., 2016; Gligorijević et al., 2018). Similar to these approaches, in the case of the protein complexes, a multiclass classification problem, we are using the One-versus-One heuristic method to apply the SVM. Namely, for each class (protein complex) from the training set, an SVM classifier is trained (we used the standard Radial Basis Function kernel), and for each protein, a probability of belonging to each class (protein complex) is computed. Then, each protein is assigned to the class (protein complex) with the highest corresponding probability.
3 Results
In this section, we compare the NMTF-based embeddings obtained from factorizing the PPMI matrix (NMTF PPMI), the adjacency matrix (NMTF Adj) and the GDV PPMI matrix (NMTF GDV PPMI) with the SVD embeddings. Testing the behavior of the nonlinear dimensionality reduction techniques (e.g. PCA, IsoMap, MCE, etc.) in higher dimensions remains an open question for a future study. The number of dimensions, d, is the key parameter for the embeddings. In NLP, it is thought to be in the range between 100 and 300 (Pennington et al., 2014). In this paper, we use d in range 50–400 with step size of 50, to demonstrate that regardless of the dimension, the embedding space of the human PPI network is functionally organized. As an initial dimension, we select 50, which is already far below the number of about 100 that we obtained by the rule of thumb (, where n is the number of nodes in the network). Importantly, too few dimensions may lead to a severe loss of information, since in that case a highly-dimensional object would be compressed in too few dimensions that may not capture its main features (e.g. a three-dimensional cone projected in two-dimensional space could be a disk, or a triangle, or another kind of a two-dimensional object). Finally, our results indicate that the method works better at a high number of dimensions, as expected (250–300 dimensions, see Fig. 1).
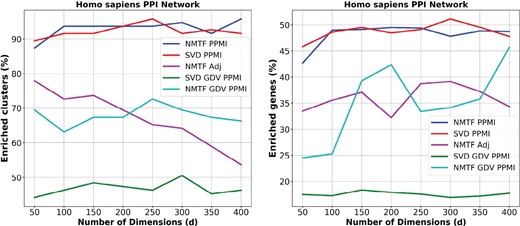
Functional coherence of the embedding spaces. For each dimension (x axis), the percentage of clusters (y axis, panel A) with at least one GO BP function enriched and the percentage of enriched genes (y axis, panel B) in the clusters that are obtained in the embedding space generated by each of the NMTF PPMI decomposition (blue), SVD PPMI decomposition (red), NMTF Adj decomposition (purple), SVD GDV PPMI decomposition (green) and NMTF GDV PPMI decomposition (cyan)
3.1 Enrichment analysis in the embedding space
We investigate if genes with similar functions are located close in the embedding space. We do this by clustering genes in the embedding space generated by the decompositions of three matrices representations (adjacency matrix, PPMI matrix and GDV PPMI matrix) of the PPI network and by computing the enrichment of these clusters in Gene Ontology Biological Process (GO BP) term annotations (see Supplementary, Enrichment Analysis).
For the human PPI network, the NMTF PPMI decomposition substantially outperforms the NMTF Adj decomposition and the NMTF GDV PPMI decomposition in both the percentage of the enriched clusters and the percentage of the enriched genes in the clusters, as presented in Figure 1A and B, respectively. The NMTF and SVD PPMI decompositions produce percentages of enriched clusters and enriched genes in the clusters that are consistently above 90% and 45%, respectively. This demonstrates that the embedding of the PPMI matrix can capture more biological information than the embedding of the GDV PPMI or the adjacency matrix representation of the human PPI network. This result can be attributed to the fact that PPMI matrix decompositions group close in the embedding space nodes from the same neighborhood of the network and neighborhood membership information has been widely used to predict protein function (Vazquez et al., 2003). On the other hand, GDV PPMI decompositions locate close in the embedding space nodes with similar wiring patterns (topological roles) in the networks. Interestingly, the percentages of the enriched genes and clusters in the embedding spaces generated by the NMTF-based decomposition of the adjacency and the GDV PPMI matrices are similar, but they capture different biological information in terms of enriched GO BP terms (on average 0.45 Overlap Coefficient, see Supplementary Table S1). This verify that topological similarity is complementary to network neighborhoods in uncovering functional information [first noticed by Milenković and Pržulj (2008)].
To further demonstrate the importance of the PPMI matrix representation of the human PPI network, we compare the percentage of the enriched genes and clusters in the embedding spaces generated by the NMTF-based decompositions of the GDV PPMI matrix and the GDV similarity matrix (NMTF GDV). As presented in Supplementary Figures S1 and S2, the NMTF GDV PPMI decompositions consistently outperform the NMTF GDV decompositions in both the percentage of the enriched genes and clusters, at least by 15%. Thus, in the rest of the analysis, we present only the results of the GDV PPMI matrix decompositions with the SVD and with the NMTF-based framework.
Comparing the NMTF PPMI with the SVD PPMI embedding, we observe that the percentages of the enriched clusters and genes are similar for the two methods and are high (above 90% and 45% for enriched clusters and genes, respectively). However, across the embedding dimensions they capture different biological information in terms of enriched GO BP terms; on average they share 3000 enriched GO BP terms and each of them has 1000 unique enriched GO BP terms (see Supplementary Table S2). This demonstrates that different geometries, as SVD allows for negative values and NMTF does not, lead to different functional organization of the embedding space. Finally, when we decompose the GDV PPMI matrix with our NMTF-based approach, we observe much higher percentages of enriched genes and clusters compared to the SVD-based GDV PPMI decomposition. This confirms the utility of our NMTF-based framework to uncover the functional information encoded in the topology of the PPI network data better than the competing methods.
To demonstrate that our methodology uncovers the functional relationships between the genes based on their wiring patterns in biological networks, we repeat 15 times the aforementioned enrichment analysis in perturbed networks: we randomly shuffle the nodes in the adjacency matrix, in the PPMI matrix and the GDV PPMI matrix. As illustrated in Supplementary Figure S6, the average percentage of clusters (panel A) with at least one GO BP function enriched and the average percentage of enriched genes (panel B) in the clusters in the perturbed networks are much lower than in the data networks. Thus, the observed functional organization in the embedding space cannot be observed in the perturbed networks.
In addition, the embeddings obtained by the NMTF-based decompositions of the PPMI matrix, as well as of the GDV PPMI matrix of the human PPI network, compared to the SVD-based decompositions, uncover more enriched clusters and more enriched genes in the obtained clusters. Also, the number and types of enriched GO-terms obtained by the two methods are different. Namely, more functional information and of a different kind (in GO BP terns) is obtained by our NMTF-based embeddings. Finally, NMTF also allows for designing advanced data fusion frameworks (e.g. see Gligorijević et al., 2016; Malod-Dognin et al., 2019) that cannot be designed by SVD. Utilizing such data fusions to introduce fused embedding spaces of molecular omics data is a subject of future work.
3.2 Protein complex membership predictions
In the previous section, we demonstrate that proximity in the embedding space means similarity in biological function. Based on that, we investigate whether we can make predictions in the embedding space for protein complex membership by using the cosine similarity of the embedding vectors of genes (see Section 2.5). As a baseline for comparison with our prediction strategy we use the SVM classifier to assign proteins to complexes.
Protein complexes are functional modules of proteins that physically interact and are represented by locally dense neighborhoods (subgraphs) in the PPI network. Thus, as presented in Figure 2A, the decompositions of the neighborhood-based representations of the human PPI network (adjacency and PPMI matrix) are resulting in higher prediction accuracies. In particular, the PPMI matrix decompositions, either with the SVD, or with the NMTF framework, lead to the highest prediction accuracies, varying from 70% to 78% and from 60% to 75%, respectively. Importantly, for all methods, our prediction strategy, that is based on proximity in the embedding space, is performing slightly better than the SVM on predicting protein complex membership. This demonstrates that we can extract directly and precisely the functional knowledge from the embedding space with simple vector operations.
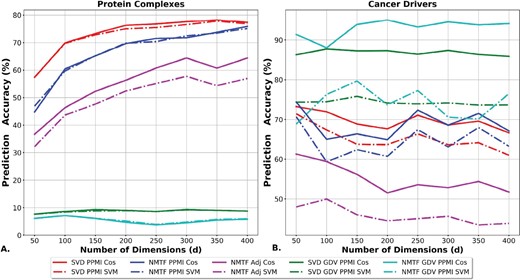
Evaluation of predictions in the embedding space based on linear operations. For each dimension (x axis), the accuracy (y axis) of the predictions that are obtained in the embedding space generated by the SVD PPMI decomposition (red), the NMTF PPMI decomposition (blue), the NMTF Adj decomposition (purple), the SVD GDV PPMI decomposition (green) and the NMTF GDV PPMI decomposition (cyan). The lines show the accuracy of the cosine assignment strategy and the dashed lines the accuracy of the SVM predictions. (A) The accuracy of protein complex membership predictions. (B) The accuracy of cancer-driver genes predictions
On the other hand, GDV PPMI decompositions are performing poorly on this task. Since protein complexes are dense regions of PPI networks, we hypothesize that these decompositions identify proteins that participate in complexes, but without determining the exact complex to which they belong. We verify this by transforming the problem into a binary classification task in which we assess the capability of the methods to separate proteins that participate in complexes from those that do not. In this setting, the GDV PPMI matrix decompositions outperform the other methods: the NMTF decomposition of the GDV PPMI matrix has the highest prediction accuracy (based on our prediction strategy) that varies between 92% and 98% across the embedding dimensions (see Supplementary Fig. S3). The decompositions of the other matrices lead to predictors with at most 79% accuracy.
To conclude, if the task is to identify proteins that participate in complexes, the decomposition of the GDV PPMI matrix with the NMTF framework outperforms all other methods. However, when we aim to identify the specific complex in which a protein participates, the PPMI matrix decompositions are resulting in higher prediction accuracies. To sum up, our simple function prediction strategy, based on proximity in the embedding space, is performing better than the SVM classifier with few exceptions when we formulate the protein complex membership prediction as a binary classification task (see Supplementary Fig. S4).
3.3 Cancer gene predictions
To exploit further the uncovered spatial closeness of functionally similar genes in the embedding space (see Section 3.1), we apply a proximity-based functional prediction strategy, measured by the cosine distance between the vector representations of genes, to identify new cancer genes (see Section 2.5). We assess the prediction accuracy of our method by comparing it with the accuracy of the SVM classifier.
As illustrated in Figure 2B, the GDV PPMI decompositions outperform the other methods. Namely, the NMTF-based decomposition of the GDV PPMI matrix, with the proximity-based prediction strategy, has the highest prediction accuracy that varies between 89% and 95% across the embedding dimensions. It is followed by the proximity-based prediction strategy applied in the SVD GDV PPMI space, with prediction accuracy that is between 87% and 89%. For the rest of the matrices, the best results are obtained when we apply the proximity-based prediction strategy in the embedding space generated by either the SVD, or the NMTF decomposition of the PPMI matrix with prediction accuracy of at most 70% (above 200 dimensions). Thus, the GDV PPMI decompositions with the proximity-based function prediction strategy result in higher prediction accuracies by at least 15% than the competitive methods.
To further investigate the reasons for graphlet-based methods outperforming others for identifying cancer-related genes, while direct neighborhood-based methods working better for uncovering precise protein complex membership, we compute the GDVs of the genes (feature vectors that capture the local wiring patterns around nodes in a network according to their participation in orbits of graphlets, for more details see Sections 2 and 2.2.2), the building blocks of the GDV PPMI matrix. As illustrated in Supplementary Figure S5, the average GDV counts for each of the 15 orbits are in log-scale, GDVs distinguish the cancer-driver genes (all known drivers from IntOGen) from the background genes. Note that when we compare the GDVs of different gene sets what is important is not the difference in the shape of the curves in Supplementary Figure S5 (which are in log-scale), but in the magnitude of each orbit count. We further verify this difference by computing the Mann–Whitney U test (with significance level of 0.01) for each pair of orbits and for all of these the differences are statistically significant (P-values , see Supplementary Table S3).
Thus, graphlet-based methods work better than competitive methods for identifying cancer-related genes. This is because in cancer, the PPI network is rewired in a very intricate way that only graphlets, as the most precise measures of network wiring patterns, can detect. On the other hand, direct neighborhood-based methods work better for protein complex memberships prediction, possibly because of the human biases present in the PPI network data: protein complexes are represented by using spoke, or matrix models (Hakes et al., 2007) and hence are just densely connected regions of PPI networks.
3.4 Novel cancer gene predictions
As presented above, our proximity-based cancer gene predictions, measured by the cosine distance between the vectors corresponding to genes in the NMTF GDV PPMI embedding space, outperform the other methods with accuracy for d = 200 and d = 300 (see Fig. 2B). To further demonstrate the utility of our approach, we predict novel cancer-related genes and we validate them in the literature. We select d = 200 as the optimal dimension to make novel predictions, because in this dimension we have a higher percentage of enriched genes than for d = 300 (see Fig. 1B).
For this dimension, we compute the average embedding of the cancer-driver genes (see Section 2.5) and we rank the genes that are currently not known to be drivers, in the ascending order based on their cosine distance from the average embedding of cancer drivers. The one with the smallest cosine distance (the highest cosine similarity) is the most likely to be cancer related. The top 15 of our predicted cancer-related genes are presented in Table 1. For 12 of our top 15 predictions (80%) there exist a relevant publication for their potential role in cancer (Table 1, ‘literature evidence’ column). Interestingly, DHX37, which is not verified in the literature, has recently been characterized as a potential target of immunotherapy in mice (Alfei et al., 2019). To further assess the relevance of our predictions, we use the patient survival curves (collected from The Cancer Genome Atlas project). We find that 14 of our 15 predicted genes (93.3%) have significant association with patient survival and thus potential clinical relevance as biomarkers of cancer (Table 1, the last column). To verify that this high number of predicted genes (14 out of 15) has associations with patient survival curves, we randomly sample 15 genes 1000 times. Our predictions are statistically significant with P-value = 0.001, since only one of these 1000 randomized experiments achieved an equal or higher number of genes associated with survival curves. We conclude that our predicted genes may be related to cancer, potentially being biomarkers.
The top 15 of our cancer-related gene predictions (column genes), based on their cosine closeness (column cos distance) from the average embedding vector of cancer-driver genes
| Genes | Cos distance | Literature evidence | Survival curves (P-value) | |
|---|---|---|---|---|
| 1 | FAM110B | 0.1427 | dbSNP | Pancreatic cancer (0.00014) |
| 2 | PLEKHA7 | 0.1447 | doi: 10.1186/s13046-018-0796-1 | Renal cancer (1.9e−15) |
| 3 | FGB | 0.1447 | PMID: 11460495 | Renal cancer (0.000057) |
| 4 | UTP20 | 0.1457 | COSMIC DB | Renal cancer (0.00089) |
| 5 | ZDHHC17 | 0.1461 | PMID: 30232163 | Renal cancer (0.000071) |
| 6 | PEX19 | 0.1462 | Renal cancer (0.000029) | |
| 7 | PTBP3 | 0.1465 | doi: 10.1186/s13046-019-1312-y | Renal cancer (0.00025) |
| 8 | LGALS8 | 0.1470 | PMID: 14758080 | Lung cancer (0.00094) |
| 9 | PRMT6 | 0.1477 | PMID: 29262320 | Endometrial cancer (0.00031) |
| 10 | MED18 | 0.1478 | Cancer Cell Metabolism Gene DB | Endometrial cancer (0.00039) |
| 11 | VIPR2 | 0.1479 | PMID: 21769421 | — |
| 12 | VAC14 | 0.1486 | Cervical cancer (0.000083) | |
| 13 | DHX37 | 0.1488 | Liver cancer (9.5e−10) | |
| 14 | MED25 | 0.1489 | doi: 10.1007/s12253-016-0092-3 | Head and neck cancer (0.00099) |
| 15 | TUFT1 | 0.1491 | PMID: 29088838 | Endometrial cancer (0.00048) |
Note: Genes in bold either have literature support for their role in cancer (column literature evidence) or show statistically significantly different patient survival curves [column survival curves (P-value)].
The high-validation rates that we obtained further demonstrate the suitability of the GDV PPMI decomposition to capture functional information and predict disease-related genes and biomarkers. Biological validations and explanations of the underlying functional mechanisms are subjects of future research.
4 Conclusion
We introduce the GDV PPMI matrix and the PPMI matrix representation of the human PPI network. We demonstrate that the embeddings obtained by decompositions of the PPMI matrix of the human PPI network capture more functional information, in terms of enriched genes and clusters, compared to embeddings obtained by adjacency matrix decompositions. Importantly, we show that the embeddings of the human PPI network obtained by the decompositions of the PPMI and the GDV PPMI matrices locate close in the embedding space the genes that have similar biological functions. These spaces are functionally organized and hence we can extract new functional knowledge directly by comparing the vector representations of genes and doing linear operations on these vectors.
By exploiting this property, we assign proteins to complexes and we identify cancer genes based on the cosine similarities between the vector representations of the constituent genes. For the first task, we show that the decompositions of the PPMI matrix have the highest prediction accuracy among all tested methods. For the cancer gene predictions, the decompositions of our newly defined GDV PPMI matrix lead to the highest prediction accuracies (at least 89%). Finally, we further demonstrate the importance of the GDV PPMI embeddings by predicting 15 novel cancer-related genes, validating 80% of our predictions in the literature and 93.3% having association with patient survival and hence potentially a clinical relevance as biomarkers of cancer.
In our analysis, we show the importance of molecular network embeddings that preserve either the structural, or the homophily similarities of genes. A key question for future research is how to benefit from both types of similarities simultaneously, which may reveal new functional knowledge. Finally, the proposed methodology can be generalized and applied to any discipline that uses network representations, including physics, social sciences and economy.
Funding
This work was supported by the European Research Council (ERC) Consolidator Grant 770827 and the Spanish State Research Agency AEI 10.13039/501100011033 grant number PID2019-105500GB-I00.
Conflict of Interest: none declared.

