


Abstract
Alternative splicing creates the considerable proteomic diversity and complexity on relatively limited genome. Proteoforms translated from alternatively spliced isoforms of a gene actually execute the biological functions of this gene, which reflect the functional knowledge of genes at a finer granular level. Recently, some computational approaches have been proposed to differentiate isoform functions using sequence and expression data. However, their performance is far from being desirable, mainly due to the imbalance and lack of annotations at isoform-level, and the difficulty of modeling gene–isoform relations.
We propose a deep multi-instance learning-based framework (DMIL-IsoFun) to differentiate the functions of isoforms. DMIL-IsoFun firstly introduces a multi-instance learning convolution neural network trained with isoform sequences and gene-level annotations to extract the feature vectors and initialize the annotations of isoforms, and then uses a class-imbalance Graph Convolution Network to refine the annotations of individual isoforms based on the isoform co-expression network and extracted features. Extensive experimental results show that DMIL-IsoFun improves the Smin and Fmax of state-of-the-art solutions by at least 29.6% and 40.8%. The effectiveness of DMIL-IsoFun is further confirmed on a testbed of human multiple-isoform genes, and maize isoforms related with photosynthesis.
The code and data are available at http://www.sdu-idea.cn/codes.php?name=DMIL-Isofun.
Supplementary data are available at Bioinformatics online.
1 Introduction
Alternative splicing is an essential biological process (BP) that creates considerable proteomics diversity and complexity from the relatively limited genome (Graveley, 2001). It enables a gene spliced into different isoforms by exon skipping, intron retention, alternative 5′ donor site and so on. Over 90% multi-exon human genes undergo alternative splicing, which gives rise to different proteoforms that can vary with respect to protein–protein interactions, subcellular localizations and stimulatory or inhibitory activities (Smith and Kelleher, 2018; Yang et al., 2016). Many studies have found that alternative splicing can greatly affect normal cellular functions and cause many diseases. In addition, it is widely reported that the proteoforms (or protein variants) translated from different isoforms of the same gene have distinct or even opposite functions (Melamud and Moult, 2009; Mittendorf et al., 2012). For example, CaMKII can be alternatively spliced into four major forms of CaMKIIα, CaMKIIβ, CaMKIIγ and CaMKIIδ (Westenbrink et al., 2015), CaMKIIδ plays a key role in heart disease conditions (Gray et al., 2017), while the other isoforms have no effect on heart disease. Unfortunately, the changes in isoform sequences of the same gene are often very small, but may have a distinct impact on protein structure and function. For example, two isoforms (SERCA2a and SERCA2b) are differentially expressed during muscle differentiation via a splice process at the 3′ end of the primary SERCA2 transcript. Replacement of SERCA2 with SERCA2a in a mouse model results in mild hypertrophy and impaired contraction–relaxation in the heart (Ver Heyen et al., 2001). In contrast, over-expressed SERCA2b shows an increased cardiac SERCA activity and contractility (Greene et al., 2000). Therefore, the individual functional annotations of isoforms are crucial to decipher the functional complexity of genomes.
Gene Ontology (GO) is a major bioinformatics initiative that unifies the representation of gene and gene products functional attributes of multiple species (Dessimoz and Škunca, 2017). GO has been extensively used as a golden standard to encode the function of gene products; it includes plenty of GO terms and each GO term describes a distinct biological concept. GO includes three subontologies: Molecular Function (MF), BP and Cellular Component (CC). Each subontology structurally organizes GO terms as a direct acyclic graph (DAG). In the DAG, each node corresponds to a GO term and the edge describes the relationship between terms. The prediction of GO annotations of genes has been studied for many years and diverse computational methods have been developed (Zhao et al., 2020; Zhou et al., 2019). Existing solutions mainly focus on the gene-level and collectively assign all functions of gene products to the same gene, thus typical gene function prediction methods cannot be directly adopted to differentiate functions of isoforms.
Some pioneers model the isoform function prediction as a multi-instance learning (MIL) problem (Zhou et al., 2012), where each bag (gene) is composed of a set of instances (isoforms), and the labels of a bag are induced from the label of its instances. This setting aligns with the convention of GO annotations of genes, in which a gene is positive for a GO term if at least one of its isoforms is positively annotated with that GO term; on the other hand, a gene is negative for a GO term if all its isoforms are not annotated with that GO term. Several MIL-based solutions have been developed to predict isoform functions using GO and RNA-seq data. Eksi et al. (2013) applied an isoform-level maximum margin classifier (miSVM) using GO annotations of genes, gene-isoform relation and isoform expression data to predict isoform functions. However, miSVM is seriously affected by the initial annotations of isoforms from positive genes and the preset threshold. iMILP (Li et al., 2014b) , a multiple instance-based label propagation method, predicts annotations of isoforms by constructing the isoform functional association network and by uniformly initializing the annotations of isoforms using GO annotations of genes. Then, it iteratively normalizes and propagates annotations in the association network to associate isoforms with GO terms. WLRM (Luo et al., 2017) differentiates the functions of isoforms by integrating sparse simplex projection into a non-convex sparsity-induced regularizer within the MIL framework, and efficiently solves the highly non-trivial non-convex and non-smooth optimization problem in miSVM.
The aforementioned methods implicitly assume GO annotations of genes are complete. Yu et al. (2020) introduced an approach (IsoFun) that performs bi-random walks on a heterogeneous network composed with genes, isoforms and GO terms to replenish the missing GO annotations of genes and dispatch them to individual isoforms. Wang et al. (2020) assumed that the annotations of genes are aggregated from key isoforms and proposed DisoFun, which collaboratively factorizes the isoform expression data matrix and gene-term association matrix into low-rank matrices to discover the latent key isoforms and identify their functions. All the above methods can be regarded as shallow solutions, as they cannot mine non-linear relationships between isoforms and GO terms. DeepIsoFun (Shaw et al., 2019) uses auto-encoders to extract features from expression data, and combines MIL with domain adaption to provide extra annotated data, and thus to more credibly transfer the annotations to isoforms. DIFFUSE (Chen et al., 2019) uses a convolutional neural network to predict the functions of isoforms from the genomic sequence, and then applies a conditional random field (CRF) to refine the prediction based on the isoform co-expression network. However, these two deep methods do not take into account the important relationship between a gene (bag) and its isoforms (instances) during training, and thus suffer from inconsistent predictions for genes and corresponding isoforms.
In this article, we propose a deep multi-instance learning-based solution called DMIL-IsoFun to predict isoform functions by leveraging RNA-seq datasets, isoform sequences and GO annotations. The main idea of DMIL-IsoFun and its workflow are illustrated in Figure 1. DMIL-IsoFun introduces a Multi-Instance Learning Convolution Neural Network (MILCNN) to transfer the gene-level annotations to isoforms by max-pooling, and then proposes a class-imbalance Graph Convolution Network (GCN) (Kipf and Welling, 2017) to refine the transferred annotations of individual isoforms. Particularly, MILCNN takes the gene bag composed with isoform sequences as input and uses the 1D convolution kernel to scan isoforms of a gene bag, along with two maximum pooling layers, one to get the isoform-level initial annotations, and the other to aggregate the initial annotations to the hosting gene bag, and thus learns the representational features of isoforms and initializes the annotations of isoforms by gene-level annotations in a concordant way. The class-imbalance GCN takes the focal loss (Lin et al., 2020), instead of cross-entropy loss to handle imbalance annotations, and fuses the representational features and the isoform co-expression network induced from multiple RNA-Seq datasets to further differentiate the annotations of individual isoforms. We conducted experiments on Maize and Human datasets from public repositories, and found that DMIL-IsoFun can more credibly differentiate GO annotations of isoforms than other related and competitive approaches (Chen et al., 2019; Eksi et al., 2013; Li et al., 2014b; Shaw et al., 2019; Wang et al., 2020; Yu et al., 2020). Further experiments confirm that DMIL-IsoFun can accurately identify the functions of isoforms spliced from multiple-isoform genes (MIGs) of human and maize isoforms related with photosynthesis.
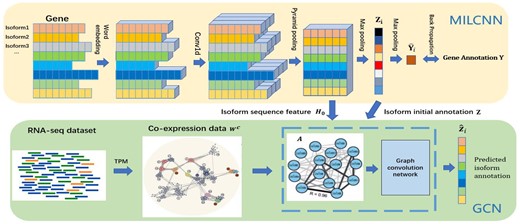
A schema of DMIL-Isofun. The upper subnetwork is the MILCNN. It takes all isoforms of a gene as input to extract isoform feature vectors via different 1D convolution kernels and the instance pyramid pooling. It then uses a maximum pooling layer that takes the top-ranked isoform in the gene bag as the responsible actor for a GO term annotated to the hosting gene, and thus initializes the annotations of individual isoforms by gene–isoform relation and GO annotations of genes in a coherent manner. The bottom subnet is the GCN. It takes the composite isoform functional association network () derived from multiple RNA-seq datasets and isoform sequence data, and the isoform representation vectors as the input to further differentiate the annotations of individual isoforms
2 Materials and methods
2.1 Overview and formulation
DMIL-IsoFun predicts isoform functions by deep MIL and GCN to integrate isoform sequence and expression data, and gene-level annotations. Figure 1 shows the basic workflow of our model. First, the spliced isoform sequences of a gene form the feature vectors of a gene bag. In the MILCNN stage, the 1D convolution kernel is used to extract the features for each isoform instance in the bag, and then two maximum pooling layers are used to aggregate the predicted functions of isoforms to the hosting gene and to reversely back propagate known annotations of this gene to its isoforms, respectively. The aggregation and back propagation strategy is motivated by the observation that the collected GO annotations of a gene are the union of annotations of individual isoforms spliced from this gene (Dessimoz and Škunca, 2017). These predicted annotations are taken as the initial annotations of isoforms for the follow-up fine-tuning. In the GCN stage, GCN fuses the isoform sequences and co-expression network to further refine the GO annotations of individual isoforms.
We formulate the isoform function prediction as a MIL task. Let n represent the number of isoforms, m denote the number of genes and denote the set of studied GO terms. A gene and its annotations are given as pairs , where , τ is the maximum number of isoforms in a gene, which is set to 20 in our experiments based on statistics of isoforms spliced from the same gene, as reported in the Supplementary Section 5. A gene with more than τ isoforms keeps the first τ isoforms, and a gene with fewer than τ isoforms is zero-padded to generate the gene bag feature matrix. is the representation feature vector of the j-th isoform of the i-th gene. stores the GO annotations of this gene, () stores the GO annotations of the j-th isoform spliced from the i-th gene, but is typically unknown.
2.2 Datasets
Amino acid sequences have been used extensively for predicting protein functions (Zhou et al., 2019), and have recently been used for isoform function prediction as well (Chen et al., 2019). Unlike the canonically studied mammal genomes (i.e. human and mouse), which have very scarce direct GO annotations of isoforms, the Maize B73 v5 genome assembly data provides a number of isoform-level GO annotations, and can serve as a natural testbed for isoform function prediction. As such, we perform our experiments using primarily the maize data. We downloaded the B73 v5 genome assembly data generated by the NAM project from MaizeGDB (https://download.maizegdb.org/) . Coding DNA Sequence (CDS) is extracted for each isoform through the RefSeq CDS annotation file. The combination of different CDSs of a gene produces a variety of isoforms. The codon table is used to convert the nucleotide sequence into a protein sequence. Isoform expression data of maize genome were downloaded from NCBI Sequence Read Archive, which includes 10 RNA-seq datasets from 6 tissues. The details of these RNA-seq datasets are given in the Supplementary Table S1. As in previous studies (Chen et al., 2019; Li et al., 2014b; Wang et al., 2020), we also collected human data to comprehensively evaluate our model.
We apply the True Path Rule (Dessimoz and Škunca, 2017; Zhao et al., 2020) and direct annotations in the corresponding GO file to expand GO annotations of genes, namely if a GO term is annotated to a gene, then its ancestor GO terms are annotated to the gene too. We then select terms annotated with at least 50 genes for the experiments. As a result, 387 GO terms are chosen. We considered and created a binary label vector for each gene bag. If a gene bag is annotated with a GO term from the selected terms, we assign 1 to the term position in the binary vector and use it as a positive sample for this GO term. Otherwise, we assign 0 and use it as a negative sample. Similarly, isoforms annotated with the selected terms are kept for the experiments. In the end, we obtained 31 040 isoforms spliced from 14 605 maize genes, among which 7587 are MIGs and 7018 are single isoform genes.
2.3 Extracting isoform features and initializing annotations
Gene-isoform relation is the bridge that transfers gene-level annotations to isoforms. Most isoform function prediction approaches use this relation to initialize the annotations of isoforms, but neglect it during the training process (Chen et al., 2019; Li et al., 2014b; Shaw et al., 2019), and thus result in inconsistent predictions at the gene- and isoform-levels. Some other approaches make use of such relations during the training process (Eksi et al., 2013; Wang et al., 2020; Yu et al., 2020), but they mainly focus on the RNA-seq data, or fuze multi-type data at a coarse level, which prohibit them from obtaining a prominent performance. Here, we introduce a MILCNN trained on gene-level annotations to extract isoform features in a gene bag, and to initialize the individual annotations of isoforms in a coherent manner.
Here is the one-hot label vector for the i-th gene, Yiq = 1 indicate q is annotated to the i-th gene, Yiq = 0 otherwise. is the Sigmoid activation function. Minimizing the above loss can induce consistent annotations of a gene and its isoforms. In addition, it unifies the learning of isoform representational features and initial annotations, the last two are given in input to the GCN subnet for further differentiating the annotations of individual isoforms.
2.4 Predicting isoform functions using a GCN
The functions of an isoform depend on its sequence and interaction partners (Yang et al., 2016; Yu et al., 2021). Like genes, isoforms with similar functions are usually co-expressed (Li et al., 2014a; Park et al., 2013). The advent of RNA-seq techniques provides an unprecedented amount of isoform-level expression data, and enables the detection of alternative splicing events at a deeper level. The initial annotations Z are still learned at a coarse level using the isoform sequence and gene-isoform relations. In this work, a GCN (Kipf and Welling, 2017) is adopted to further refine annotations of individual isoforms based on the functional associations between isoforms. Diverse isoform expression measurements have been developed (Teng et al., 2016), such as Reads Per Kilobase of exon model per Million mapped reads, Fragments Per Kilobase of exon model per Million mapped fragments, Transcripts Per Kilobase of exon model per Million mapped reads (TPM), and so on. Here, we use TPM to quantify the expression value of isoforms from collected RNA-seq datasets. TPM can reduce the impact of sequencing depth and gene length by first standardizing the gene length, and then standardizing the sequencing depth. Based on the quantified expression profiles of isoforms across multiple RNA-seq datasets, we construct a co-expression network using weighted correlation network analysis (WGCNA) (Langfelder and Horvath, 2008). Particularly, the edge weights between two isoforms are determined by the Pearson correlation coefficient with the soft threshold method of WGCNA. For each isoform, we retain the k (k = 10 for our experiments) neighbors with the highest co-expression values to avoid a too dense co-expression network and to omit trivial co-expressions.
Here encodes the functional association strength between the i-th and j-th isoforms. Since the two networks are relatively sparse, the summation in the fusion process causes similar isoforms to have a disproportionately high association in the composite network. To avoid this, we adopt the maximum function to integrate the two networks into a composite one .
In our experiments, the value of α is set to 0.25 and the value of γ is set to 2. By minimizing the above loss and back propagating the loss to the network to learn , we can differentiate the annotations of individual isoforms at the isoform-level. The pseudo-code of DMIL-IsoFun is summarized in Algorithm 1.
DMIL-IsoFun: Deep Multi-Instance Learning for Isoform Function prediction
| Input: Isoform sequences X, isoform co-expression network , gene annotations Y, Max epochs Mep, , γ = 2 |
| Output: Network parameters fm for MILCNN and fg for GCN; |
| 1: for do |
| 2: for each gene do |
| 3: ; |
| 4: ; Representation of isoforms |
| 5: ; Initial annotations of isoforms |
| 6: ; Gene annotations from isoforms |
| 7: = CELoss(Y, ); Compute the cross-entropy loss |
| 8: end for |
| 9: Update fm based on by gradient descent. |
| 10: ; Construct the composite network |
| 11: for each each term t do |
| 12: = GCN(A, H, Z); Predict isoform annotations |
| 13: = FocalLoss(Z,); Compute focal loss |
| 14: end for |
| 15: Update fg based on by gradient descent. |
| 16: end for |
3 Results and validation
In this section, we first compare the performance of DMIL-IsoFun against six state-of-the-art methods on the prediction of the functions of maize isoforms. We then analyze the respective contributions of each subnet of DMIL-IsoFun, of the sequence similarity and the co-expressed network and of differentiating isoforms associated with photosynthesis. We further test DMIL-IsoFun on the human genome.
3.1 Performance comparison with the existing methods
The 2020 B73 v5 genome assembly project provides annotations, which enable direct performance evaluation and comparison at the isoform-level, instead of the typical approximate gene-level evaluation done by aggregating isoform-level predictions. We randomly partition the isoforms into a training set (80%) and a validation set (20%) for 10 independent rounds, and ensure that the isoforms of the same gene are partitioned into the same set in each round. We compare DMIL-IsoFun against miSVM (Eksi et al., 2013), iMILP (Li et al., 2014b), DeepIsoFun (Shaw et al., 2019), DIFFUSE (Chen et al., 2019), IsoFun (Yu et al., 2020) and Disofun (Wang et al., 2020). All the input parameters are set as suggested by the authors, or optimized in the suggested ranges. The values of the parameters for DMIL-IsoFun are given in the Supplementary Table S4.
For a comprehensive evaluation, we use four widely used evaluation metrics: AUROC, AUPRC, Fmax and Smin (Jiang et al., 2016). AUPRC and AUROC are widely adopted for binary classification; we compute them for each GO term and report the average of all terms. AUROC is the area under the receiver operator characteristics curve. AUPRC is the area under the precision-recall curve that is more sensitive to class-imbalance than AUROC. Fmax is the overall maximum harmonic mean of precision and recall across all possible thresholds on the predicted isoform-term association matrix (Jiang et al., 2016). Smin uses the information theoretic analogs of precision and recall based on the GO hierarchy to measure the minimum semantic distance between the predictions and ground truths across all possible thresholds (Jiang et al., 2016; Zhou et al., 2019). The first two evaluation metrics are term-centric and the last two are gene(isoform)-centric. These metrics quantify the performance of isoform function prediction from different perspectives; as such, it is difficult for an approach to consistently outperform the other ones across all the metrics. It is worth mentioning that unlike other evaluation metrics, the smaller the value of Smin, the better the performance is.
From the average results in Table 1, we can see that DMIL-IsoFun almost always achieves a performance superior to the other compared methods across the four evaluation metrics. More specifically, DMIL-IsoFun improves the AUROC, Smin and of the second-best method (DIFFUSE) by at least 63.3%, 29.6% and 40.8%, which proves the effectiveness of DMIL-IsoFun on leveraging isoform sequences, RNA-seq datasets and gene–isoform relations to differentiate the functions of individual isoforms. Like DMIL-IsoFun and DIFFUSE, DeepIsofun also builds on deep neural networks, but it is outperformed by the former two. This is because DeepIsoFun solely uses isoform expression data and equally initializes all annotations of a gene to its isoforms, without accounting for the important gene-isoform relation. For similar reasons, iMILP also loses to DIFFUSE and DMIL-IsoFun. miSVM takes into account the gene–isoform relations, but it is still outperformed by the other methods due to the sole utilization of isoform expression data. DIFFUSE also leverages the sequence and co-expression information, but it does not model well the gene–isoform relation. As a result, it loses to DMIL-IsoFun by a large margin. Another possible cause of this is that DMIL-IsoFun combines more effectively sequence and co-expression network data by using a GCN than DIFFUSE. The performance margin between DMIL-IsoFun and DIFFUSE suggests that our choice of GCN for refining isoform-level annotations is more effective than the CRF approach adopted by DIFFUSE. Both Disofun and IsoFun integrate the gene-level interactions and the co-expression network; they neglect the important isoform sequence data, which encode important functional sites and domains that help differentiate the functions of individual isoforms. As such, they often lose to DIFFUSE and DMIL-IsoFun. We observe that the AUPRC value of MF and BP is significantly lower than that of CC. That is because among 387 GO terms and 31 040 isoforms retained for experiment, 32 CC terms have an average of 1054 annotations for each term, and 128 MF terms have an average of 1023 annotations for each term and 227 BP terms have an average of 919 annotations for each term. Each CC term has more annotated isoforms than others, 14.7% larger than BP and 3% higher than MF. The number of CC terms used for experiments is also the smallest. So the prediction of CC terms is relatively easier than BP and MF. We further used a signed rank test to check the difference between DMIL-IsoFun and each compared method; all the P-values are smaller than 0.01. In summary, these results and comparisons demonstrate the effectiveness of leveraging deep MIL and GCNs for isoform function prediction.
Experimental results of predicting GO annotations of individual isoforms of maize
| Methods | CC | MF | BP | |||||||||
|---|---|---|---|---|---|---|---|---|---|---|---|---|
| AUROC | AUPRC | Fmax | AUROC | AUPRC | Fmax | AUROC | AUPRC | Fmax | ||||
| miSVM | 0.470 | 0.492 | 2.218 | 0.417 | 0.505 | 0.074 | 1.259 | 0.063 | 0.528 | 0.033 | 1.007 | 0.107 |
| iMILP | 0.628 | 0.494 | 2.265 | 0.554 | 0.530 | 0.119 | 3.351 | 0.089 | 0.579 | 0.044 | 3.351 | 0.106 |
| IsoFun | 0.557 | 0.467 | 2.030 | 0.674 | 0.561 | 0.149 | 3.445 | 0.250 | 0.529 | 0.099 | 3.445 | 0.347 |
| Disofun | 0.595 | 0.510 | 2.112 | 0.381 | 0.526 | 0.123 | 3.451 | 0.177 | 0.579 | 0.055 | 4.615 | 0.180 |
| DeepIsoFun | 0.604 | 0.554 | 0.869 | 0.408 | 0.576 | 0.202 | 2.275 | 0.303 | 0.552 | 0.178 | 2.501 | 0.420 |
| DIFFUSE | 0.516 | 0.553 | 0.801 | 0.512 | 0.502 | 0.179 | 2.307 | 0.289 | 0.505 | 0.177 | 2.561 | 0.396 |
| DMIL-IsoFun | 0.854 | 0.789 | 0.564 | 0.721 | 0.846 | 0.265 | 1.259 | 0.705 | 0.825 | 0.093 | 1.576 | 0.724 |
Note: The data in boldface are the statistically best result per column by pairwise t-test.
Besides the isoform-level evaluation, we report the gene-level evaluation results of DMIL-IsoFun and other compared methods in the Supplementary Table S3. Moreover, we applied DMIL-IsoFun and the other methods on the Human dataset and report the results (approximate evaluation at the gene-level) in the Supplementary Table S4. We observe that DMIL-IsoFun again achieves significantly better results than the competitive methods on different genomes and evaluation measures.
3.2 Further analysis
3.2.1 Analyzing the effects of model components
To investigate which component of DMIL-IsoFun contributes to the improved performance of DMIL-IsoFun, we perform an ablation study by removing the components from our model and measuring how the performance of the model is affected. We introduced two variants: (i) DMIL-IsoFun-GCN only uses one-hot encoding to encode the isoform sequence and the GCN to fuze sequence and expression data, along with the known isoform-level annotations; (ii) DMIL-IsoFun-CNN directly uses the initialized annotations of isoforms from MILCNN, without using the RNA-seq data and GCN. Following the same experimental configuration, we list the prediction results of these variants in Table 2. We observe that the results of DMIL-IsoFun-CNN are the lowest. This proves the necessity of utilizing GCN and RAN-seq datasets to further differentiate the annotations of individual isoforms initialized by MILCNN subnet. DMIL-IsoFun-GCN ranks second, which again confirms the power of the GCN on merging sequence and expression data to explore the non-linear relationship between isoforms and GO terms. In practice, the AUROC of DMIL-IsoFun-GCN reduces by at least 12.2%, and the AUPRC drops by at least 25.1% when not using the sequence data, which is consistent with previous study that sequence data contain important functional sites and domains that help differentiate the function of individual isoforms (Chen et al., 2019). From the ablation study, we can conclude that both the MILCNN and the GCN subnets contribute to the improved performance of isoform function prediction.
Prediction results of DMIL-IsoFun and its variants
| AUC | AUPRC | Fmax | |||
|---|---|---|---|---|---|
| CC | DMIL-IsoFun | 0.854 | 0.789 | 0.564 | 0.721 |
| DMIL-IsoFun-GCN | 0.693 | 0.693 | 0.898 | 0.540 | |
| DMIL-IsoFun-CNN | 0.508 | 0.508 | 0.953 | 0.307 | |
| MF | DMIL-IsoFun | 0.846 | 0.265 | 1.259 | 0.705 |
| DMIL-IsoFun-GCN | 0.711 | 0.193 | 1.817 | 0.361 | |
| DMIL-IsoFun-CNN | 0.499 | 0.105 | 2.562 | 0.086 | |
| BP | DMIL-IsoFun | 0.825 | 0.093 | 1.576 | 0.635 |
| DMIL-IsoFun-GCN | 0.684 | 0.071 | 2.833 | 0.436 | |
| DMIL-IsoFun-CNN | 0.486 | 0.041 | 3.692 | 0.109 |
Note: DMIL-IsoFun-GCN only uses the GCN, i.e. the features of isoform nodes use one-hot encoding; DMIL-IsoFun-CNN directly uses the MILCNN, i.e. this variant does not use co-expression data.
3.2.2 Validation of predicted isoform functions
We further take ‘DNA binding’ (GO: 0003677), ‘zinc ion binding’ (GO: 0008270) and ‘phosphatidylinositol phosphate kinase activity’ (GO: 0016307) as the testbed, which contains annotated isoforms spliced from the same gene (Breuza et al., 2016). Table 3 lists the known annotations of 10 isoforms of 4 genes. DMIL-IsoFun correctly differentiates 9 out of 10, which results in higher accuracy than the other methods. We observe that the two deep neural network-based models (DeepIsoFun and DIFFUSE) are inclined to assign the same GO term to all isoforms of a multi-isoform gene, since they initialize all annotations of a gene without differentiation, and do not capture well the gene–isoform relation. In contrast, our DMIL-IsoFun takes into account this important relation and differentiates the initial annotations by MILCNN. We also see that the other four methods (Disofun, IsoFun, iMILP and miSVM) are biased toward negative predictions. This is because the positive annotations of isoforms are much fewer than the negative ones, and these methods do not take into account the intrinsic class imbalance issue of isoform function prediction. For a similar reason, DIFFUSE and DeepIsoFun also make more negative predictions than DMIL-IsoFun, which instead accounts for the class imbalance issue. We also observe that DMIL-IsoFun has a higher recall than the other methods, owing to the consideration of class-imbalance. Overall, these case studies confirm that DMIL-IsoFun can differentiate the GO annotations of individual isoforms spliced from the same gene.
Known and predicted positive/negative(✓/×) annotations of individual isoforms of each compared method
| GO term | Gene | Isoform | Known Annotations | DMIL-IsoFun | DIFFUSE | DeepIsoFun | Disofun | IsoFun | iMILP | miSVM |
|---|---|---|---|---|---|---|---|---|---|---|
| DNA binding | Zm00001e036212 | Zm00001e036212-T001 | × | × | × | × | ✓ | × | × | × |
| (GO: 0003677) | Zm00001e036212-T002 | ✓ | ✓ | × | × | ✓ | × | × | × | |
| Zm00001e026664 | Zm00001e026664-T001 | × | × | × | × | × | × | × | × | |
| Zinc ion binding | Zm00001e026664-T002 | ✓ | ✓ | × | × | × | × | × | × | |
| (GO: 0008270) | Zm00001e012033 | Zm00001e012033-T001 | × | × | × | × | × | × | × | × |
| Zm00001e012033-T002 | ✓ | ✓ | × | ✓ | × | × | × | × | ||
| Phosphatidylinositol | Zm00001e012593 | Zm00001e012593-T001 | ✓ | ✓ | ✓ | × | × | ✓ | × | ✓ |
| Phosphate | Zm00001e012593-T002 | ✓ | ✓ | ✓ | × | × | × | × | × | |
| Kinase activity | Zm00001e012593-T003 | × | ✓ | × | × | × | × | × | × | |
| (GO: 0016307) | Zm00001e012593-T004 | × | × | × | × | × | × | × | × | |
| Accuracy | — | — | — | 9/10 | 7/10 | 6/10 | 5/10 | 6/10 | 5/10 | 6/10 |
| Recall | — | — | — | 5/6 | 2/6 | 1/6 | 1/6 | 1/6 | 0/6 | 1/6 |
In B73 v5 genome assembly data, the protein produced by ‘Zm00001e042100-T001’ is a component of psaA/psaB protein engaged in the Photosystem (Jiao et al., 2005). This isoform is unique to plants (i.e. maize and Arabidopsis) and participates in the photosynthesis. GO: 0015979 corresponds to ‘photosynthesis’. Among the nine terms positively annotated to ‘Zm00001e042100-T001’, our DMIL-IsoFun correctly identifies six (see Table 4), which is more than any of the compared methods. This study confirms that DMIL-IsoFun can more effectively integrate multi-type data to differentiate GO annotations of isoforms at a finer granular level.
Prediction of the compared methods on maize isoform (Zm00001e042100-T001) with respect to nine positive annotations
| GO terms | Ours | DIFFUSE | DeepIsoFun | Disofun | IsoFun | iMILP | miSVM |
|---|---|---|---|---|---|---|---|
| GO: 0015979 | ✓ | × | × | × | × | × | × |
| GO: 0009579 | ✓ | × | × | × | ✓ | × | × |
| GO: 0016021 | × | × | × | ✓ | × | × | × |
| GO: 0031224 | × | ✓ | × | × | ✓ | × | × |
| GO: 0044425 | × | × | × | ✓ | × | × | × |
| GO: 0009987 | ✓ | ✓ | ✓ | ✓ | ✓ | ✓ | × |
| GO: 0044237 | ✓ | ✓ | ✓ | ✓ | ✓ | ✓ | ✓ |
| GO: 0008152 | ✓ | ✓ | ✓ | ✓ | ✓ | ✓ | ✓ |
| GO: 0016020 | ✓ | × | × | × | × | × | × |
| Recall | 6/9 | 4/9 | 3/9 | 5/9 | 5/9 | 3/9 | 2/9 |
4 Discussion
The differentiation of functions of alternatively spliced isoforms helps explaining the proteome complexity and various complex diseases at a higher resolution than the canonical gene-level analysis. In this article, we introduced DMIL-IsoFun, a method that merges genomics and transcriptomics data to identify the functions of individual isoforms spliced from the same gene. DMIL-IsoFun builds on the principle that the functions of a gene are aggregated from its isoforms, and isoforms with similar sequences and co-expression share similar functions. DMIL-IsoFun firstly introduces a MIL CNN to extract the feature vectors of isoform sequences and to initialize the annotations of individual isoforms using gene–isoform relations; then, it alters the GCN to account for the class-imbalance data to further differentiate annotations of individual isoforms. DMIL-IsoFun significantly outperforms state-of-the-art methods for predictions at both the gene and isoform-levels. In the future, we will study how to reliably combine multiple gene-level, transcript-level and phenotype heterogeneous data sources to further improve the performance of DMIL-IsoFun, and to explore isoform–disease associations.
Funding
This work was supported by the National Natural Science Foundation of China [61872300, 62031003].
Conflict of interest: none declared.

