


Abstract
With recent advances in the field of epigenetics, the focus is widening from large and frequent disease- or phenotype-related methylation signatures to rare alterations transmitted mitotically or transgenerationally (constitutional epimutations). Merging evidence indicate that such constitutional alterations, albeit occurring at a low mosaic level, may confer risk of disease later in life. Given their inherently low incidence rate and mosaic nature, there is a need for bioinformatic tools specifically designed to analyze such events.
We have developed a method (ramr) to identify aberrantly methylated DNA regions (AMRs). ramr can be applied to methylation data obtained by array or next-generation sequencing techniques to discover AMRs being associated with elevated risk of cancer as well as other diseases. We assessed accuracy and performance metrics of ramr and confirmed its applicability for analysis of large public datasets. Using ramr we identified aberrantly methylated regions that are known or may potentially be associated with development of colorectal cancer and provided functional annotation of AMRs that arise at early developmental stages.
The R package is freely available at https://github.com/BBCG/ramr and https://bioconductor.org/packages/ramr.
Supplementary data are available at Bioinformatics online.
1. Introduction
Epigenetics, normally assessed as gene promoter CpG methylations, plays a pivotal role to many physiological processes throughout life (Fraga et al., 2005). In addition, disturbances in epigenetic function are involved in many pathophysiological processes. Somatic epimutations are frequently seen in cancers (Peltomäki, 2012), and constitutional epimutations (Sloane et al., 2016) have been associated with elevated risk of cancer (Dobrovic and Kristensen, 2009; Evans et al., 2018; Hitchins et al., 2007; Lynch et al., 2015; Prajzendanc et al., 2020) as well as other diseases (Evans et al., 2007; Sloane et al., 2016). Notably, recent findings (Lønning et al., 2018, 2019) show that even epimutations occurring at a low mosaic level (affecting only a few percent of normal cells) are associated with an elevated cancer risk. While to this end such low-level mosaic methylation has been confirmed for a few genes only (Lønning et al., 2019), the findings are suggestive that similar epimutations occur for several other tumour suppressor genes in respect to different tumour forms as well. Thus, these preliminary results point towards a new and important field of research that may change our understanding of carcinogenesis as well as the origin of several other diseases profoundly.
Low-level mosaic methylation typically affects <10% of the alleles in samples of pooled normal cells (i.e. tissue biopsy or blood sample) and may easily be overlooked by contemporary screening methods. To overcome such problems, it is crucial to develop new, unbiased, exploratory approaches suitable for identification of rare long-range changes in methylation levels, i.e. aberrantly methylated regions (AMRs). Importantly, the application of such approaches is not restricted to detection of high-level hemiallelic epimutations in tumour suppressor genes and their role for cancer development but can also include discovery of moderate mosaic methylation events underlying any disease or condition. Unsupervised tools for AMR identification could be also useful to assess epimutation burden in individuals.
A number of software tools for the analysis of differentially and variably methylated regions have been developed [please see Yu and Sun (2016) and Mallik et al. (2019) for the in-depth comparison]. While some of these tools, like the DMRcate (Peters et al., 2015), Bumphunter (Jaffe et al., 2012) or iEVORA (Teschendorff et al., 2016a), can process data from any source, others, like DiffVar (Phipson and Oshlack, 2014), DMRcaller (Catoni et al., 2018), DSS (Park and Wu, 2016), Bsmooth/bsseq (Hansen et al., 2012), BiSeq (Hebestreit et al., 2013), MethCP (Gong and Purdom, 2020) or DMCHMM (Shokoohi et al., 2019), are limited to processing of bisulfite massive parallel sequencing data (e.g. Bismark output) or BeadChip data only. Importantly, all these tools are meant to compare two sets of samples and some of them proved to be less sensitive (more robust) to outlier values (Teschendorff et al., 2016b). Thus, there is a need for new tools specifically designed to identify the outliers with respect to AMRs in single/few individual samples in a dataset.
We here propose and describe a novel unsupervised method, ramr, for search of ‘rare aberrantly methylated regions’ in large datasets. By its design, ramr is sensitive to biologically relevant (extended over prolonged genomic regions) outliers and is able to find epigenetic aberrations in one or several samples within the dataset, making it suitable for discovery of low-frequency and/or mosaic epimutations. The implementation of ramr also includes methods for experimental data-based generation of test datasets and thus establishes a framework for performance evaluation of existing and future AMR/DMR analysis tools. Using simulated data, we compared ramr’s performance with some existing methods for search of differentially methylated regions (DMR). We also applied ramr and other methods to identify and characterize AMRs in public GEO (GSE51032, GSE105018) and TCGA-COAD datasets.
2 Materials and methods
2.1 Datasets and data preprocessing
GSE51032: this dataset was used to simulate test data, characterize AMRs and find common aberrations with colorectal cancer patients from the TCGA-COAD dataset. The public GSE51032 dataset contains whole blood cells DNA methylation data generated by the Infinium Human Methylation 450 Bead Chip array (Polidoro et al., 2013; Cordero et al., 2015) from 845 participants in the EPIC-Italy cohort (total n = 47 746). EPIC is a prospective cohort study designed to investigate the relationship between genetic and environmental factors and the incidence of cancer and other diseases (Riboli et al., 2002). At the time of the most recent follow-up in 2010, 235 of GSE51032 participants had developed incidental breast cancer, 166 incidental colorectal cancer, while n = 20 had developed other primary cancers. Blood samples from these 421 patients collected prior to their cancer diagnosis were analyzed together with samples from 424 control participants remaining cancer-free. The raw Illumina Infinium HumanMethylation450 BeadChip data files for this dataset were obtained from Gene Expression Omnibus (GEO, https://www.ncbi.nlm.nih.gov/geo) and processed (normalized and annotated) with the minfi Bioconductor package (Aryee et al., 2014) using the preprocessQuantile method with outlier thresholding enabled.
The full dataset (485 512 CpGs×845 samples) was first used as a template to create a test dataset (see Preparation of test datasets below). For further analyses (other than generation of test dataset), all probes mapping to chromosomes X and Y (using hg19 genome assembly) together with non-specific or polymorphic probes (Chen et al., 2013) were removed prior to identification of aberrantly methylated regions, resulting in a smaller dataset with 383 788 CpGs (i.e. 383 788×845).
TCGA-COAD: this dataset was used to identify AMRs presumably undergoing positive selection during carcinogenesis. The Cancer Genome Atlas (TCGA, https://cancergenome.nih.gov/) processed Illumina Infinium HumanMethylation450 data files for 38 adjacent mucosa and 40 corresponding colon adenocarcinoma samples were obtained from The Genomic Data Commons data sharing platform (https://portal.gdc.cancer.gov/). Probes with beta values missing in more than the half of the samples, non-specific or polymorphic probes or probes mapping to chromosomes X and Y (as described above) were filtered out resulting in a dataset with 394 360 CpGs×78 samples.
GSE105018: this dataset was used to gain insight on the potential mechanisms of AMR formation. The Environmental Risk (E-Risk) Longitudinal Twin Study dataset contains DNA methylation data obtained by analysing blood samples of 732 complete twin pairs at the age of 18 years [426 monozygotic (MZ) and 306 same-sex dizygotic (DZ) twin pairs] and 194 participants whose co-twin did not have complete data using Infinium Human Methylation 450 Bead Chip array (Hannon et al., 2018a,b). Preprocessed files with normalized beta values for this dataset were obtained from GEO (https://www.ncbi.nlm.nih.gov/geo/) and filtered as described above, resulting in a dataset with 367 522 CpGs ×1658 samples.
2.2 Preparation of test datasets
The template-based test data generation employed in the present study is a part of the ramr package, and thus can be easily reused to evaluate the performance of various tools for AMR/DMR discovery.
For the purpose of serving as a test set, a methylation array data was simulated using the full, unfiltered GSE51032 dataset as a template. For each CpG in the GSE51032 dataset the parameters of beta distribution were estimated using the ebeta function of the EnvStats R module (Millard, 2013). Using the obtained parameters, 100 random beta values distributed similarly to the experimental values were produced by means of stats::rbeta function. The resulting dataset contained 485 512 rows (CpGs) and 100 columns (samples).
To make a list of all potentially methylated regions, CpGs were merged within a window of 1000 bp and resulting regions containing at least 10 CpGs per region were kept.
In order to simulate rare methylation events, 2000 regions were randomly selected. Of those, 1000 were uniquely assigned to samples (each of these 1000 regions was assigned to a single sample, 10 regions per sample), while the other 1000 were assigned in a non-unique manner (each of these 1000 regions was assigned to three samples, 10 regions per sample). Thus, every sample in a dataset possessed 10 unique and 10 non-unique regions with aberrant methylation. The unique regions recapitulate sporadic epimutations, while non-unique—allele-specific methylation events that can be triggered by cis-factors with low to moderate variant allele frequencies, such as rs16906252 or rs1800734 (Rapkins et al., 2015; Thomas et al., 2019). The relatively high number of AMRs per sample (as compared with our findings using experimental datasets) was selected to improve the reported performance metrics of methods that, in this particular setting, are characterized by an elevated type I error rate (DMRcate, comb-p).
Next, all CpG beta values corresponding to particular region/sample pair were increased or decreased (depending on overall methylation level of this region) by particular deltas (0.025, 0.050, 0.100, 0.250, 0.500) to simulate a wide range of epimutations (from low-frequency mosaic to hemiallelic). Finally, all beta values below 0.001 were set to 0.001, and all values above 0.999 were set to 0.999. The modified regions effectively are ground true positive unique (uGTP) or non-unique (nGTP) regions and were used to assess performance of different methods. The mean-variance plots (Supplementary Fig. S1) indicate overall similarity of simulated test datasets to the template GSE51032 dataset, further confirmed by the adjusted RV matrix correlation coefficient of at least 0.9994 (calculated using R package MatrixCorrelation v0.9.5 for the template versus each of simulated datasets) (Mayer et al., 2011). Examples of original and modified uGTP/nGTP regions are given in Supplementary Figure S2.
Spontaneous deamination effects at CpG dinucleotides account for more than 20% of de novo single nucleotide polymorphisms and affect up to 26% of CpGs depending on genomic context (Youk et al., 2020). This, together with the a significant fraction (6–11%) of variation-dependent and cross-reactive probes present on Illumina methylation beadchip arrays (Hop et al., 2020; Pidsley et al., 2016; Zhou et al., 2017), may introduce the additional single-base variation to the experimental datasets. To simulate such spontaneous mutations, cross-hybridization events and potential technical artefacts better, we additionally introduced single-base methylation aberrations. For this, the total of 1000 random single genomic positions outside of uGTP and nGTP regions were chosen, assigned to samples (10 positions per sample), and their methylation beta values were changed by a delta of 0.250.
To compare the stability of the main performance metrics of ramr and DMRcate over a range of random number generator (RNG) seed values, smaller test sets of 25 samples were simulated using GSE51032 dataset as a template. True positive AMRs were defined as described above (merge window of 1000 bp, containing at least 10 CpGs). Each sample possessed 1, 2, 4, 8 and 16 AMRs with beta values increased or decreased by 0.500, 0.250, 0.100, 0.050 and 0.025, respectively. In addition to these 31 AMRs, 10 single-base methylation aberrations with delta beta of 0.250 were added to each sample. 10 such simulations and subsequent performance measurements were conducted for 10 different RNG seeds.
2.3 ramr implementation
Three independent filtering methods for identification of AMRs were implemented (Fig. 1).
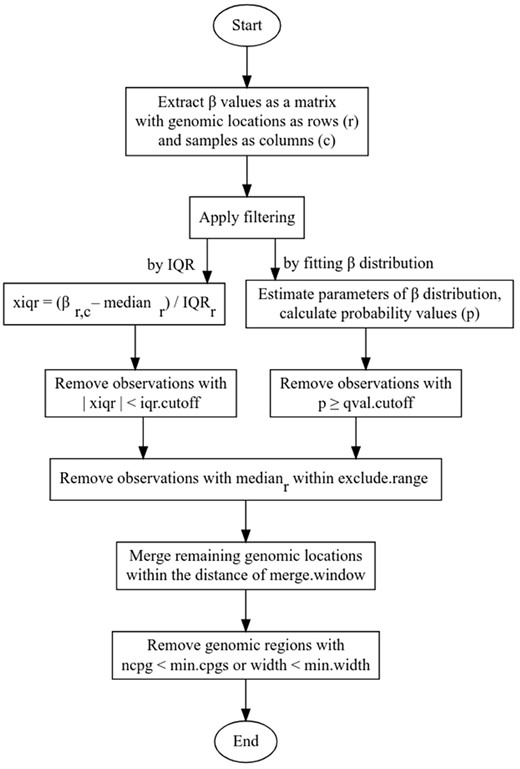
Flowchart illustrating the AMR identification method implemented in ramr
‘IQR’: for every genomic position, median beta value and interquartile range across the sample set were calculated. Then, all data points differing from median by less than a certain (user-defined) number of interquartile ranges were considered non-significant and filtered out. ‘beta’ or ‘wbeta’: non-weighted or weighted beta distribution, respectively, was fit to data for every genomic position, and probability value was calculated for every data point. For weighted parameter estimation, individual values were split in bins, and their assigned weights directly correlated with the number of values in the same bin, and inversely—with the absolute difference from the median value, resulting in lower P-values for outliers. Then, data points with probability values above a certain threshold were considered non-significant and filtered out.
After filtering, significant per-sample data points obtained by selected filtering method were merged by genomic position within a particular window, and aggregate P-value was calculated as geometric mean of P-values for individual significant data points comprising genomic region. Additional filtering was then applied to the list of aberrantly methylated genomic regions (by minimum number of merged CpGs, minimum average difference from median beta value, etc.).
2.4 Method comparison
The test data was analyzed by ramr with the following parameters: filtering by IQR (method = ‘IQR’) or non-weighted (method = ‘beta’) or weighted (method = ‘wbeta’) beta distribution fitting, IQR cutoff or q-value cutoff as specified (range of 1.3–10, or 5e-02 to 1e-10, respectively), merging CpGs within 1000 bp (merge.window = 1000), selecting AMRs with at least 5 significantly different beta values (min.cpgs = 5), using 5 parallel threads (cores = 5).
We compared ramr to the following methods widely employed for differential methylation analysis: dmpFinder [R package minfi v1.38.0 with qCutoff as specified and other default parameters(Fortin et al., 2017)], champ.DMP [R package ChAMP v2.22.0 with adjPVal as specified and other default parameters (Morris et al., 2014)], ProbeLasso [R package ChAMP v2.22.0, champ.DMR function with the following parameters: adjPvalProbe as specified, method = ‘ProbeLasso’ minDmrSep = 1000, meanLassoRadius = 1000 (Butcher and Beck, 2015)], DMRcate [R package DMRcate v2.6.0, with the following parameters: lambda = 1000, min.cpgs = 5, pcutoff as specified (Peters et al., 2015)], Bumphunter [R packages ChAMP v2.22.0 and bumphunter v1.34.0, champ.DMR function with the following parameters: minProbes = 5, cores = 1, method = ‘Bumphunter’, maxGap = 1000, nullMethod = ‘bootstrap’, B = 100, adjPvalProbe as specified (Jaffe et al., 2012)], lmFit [R package limma v3.48.0 with the default parameters (Ritchie et al., 2015)] followed by comb-p [python module v0.50.3, with the following parameters: seed as specified, dist = 1000 (Pedersen et al., 2012)]. As these methods require two classes/categories for comparison, every sample from the test dataset was tested against all the other samples. For dmpFinder and champ.DMP, differentially methylated CpGs detected were merged and filtered as described for ramr above. Probability cutoff value for all of the existing methods was in range of 5e-02 to 1e-10.
True positive unique (uTP) or non-unique (nTP) region is defined as region which overlaps by at least 1 bp with any of ground true positive unique (uGTP) or non-unique (nGTP) regions correspondingly. False positive (tFP) region is defined as region not overlapping with any of uGTP or nGTP regions.
The following metrics were calculated:
- Precision (Positive Predictive Value):
- Recall (True Positive Rate):where uFN and nFN are the number of unique or non-unique false negative regions, respectively.
- FPR (False Positive Rate):where tTN is the total number of true negative regions.
- Matthews correlation coefficient (MCC):
- F1 score
AuPR (Area under Precision-Recall curve) uAuPR (for unique regions) and nAuPR (for non-unique regions) values were evaluated using linear interpolation between the supporting points of the precision–recall curve calculated as specified above for the entire range of cutoff values.
AuROC (Area under Receiver Operating Characteristic curve) uAuROC (for unique regions) and nAuROC (for non-unique regions) values were evaluated using linear interpolation between the supporting points of the recall–FPR curve calculated as specified above for the entire range of cutoff values.
utpCorr, ntpCorr, ufnCorr, nfnCorr Average Pearson correlation coefficients were precomputed for all samples across all CpGs within each ground true positive unique (uGTP) or non-unique (nGTP) region, and an average correlation coefficient was calculated for all unique/non-unique true positive (utpCorr and ntpCorr, respectively) and all unique/non-unique false negative (ufnCorr and nfnCorr, respectively) regions for every method across the entire range of cutoff values.
Time The elapsed time measured in seconds for AMR search using every algorithm was recorded on a HP OptiPlex 7050 PC with 64 GB 2400 MHz, DDR4 RAM, 8-core Intel® Core® i7-7700 (3.60 GHz) CPU and the Ubuntu 18.04.4 LTS Operating System. Due to low performance of some methods and multiple test scenarios, parallel computing on five cores was used when comparing computing times for different algorithms. As comb-p uses maximum of four threads by default, single threading was forced to obtain results comparable to DMRcate, ChAMP, Bumphunter and minfi. Then, multiprocessing of all methods except ramr was achieved by running 5 independent processes at a time. Method performance in a single-process mode was also assessed for several test scenarios and was found to be consistent with multi-process estimates.
2.5 Identification and characterization of aberrantly methylated regions
Pre-filtered datasets (see above) GSE51032 (383 788 CpGs, 845 samples), TCGA-COAD (394 360 CpGs, 38 adjacent mucosa samples) and GSE105018 (367 522 CpGs, 1658 samples) were analyzed using ramr with the following parameters: method = ‘beta’, qval.cutoff = 1e-03, min.cpgs = 7, merge.window = 1000.
2.6 Region annotation and enrichment analysis
Genomic regions were annotated using the R package annotatr v1.10.0 (Cavalcante and Sartor, 2017). Chromatin marks overrepresented in aberrantly methylated regions were assessed by locus overlap analysis for enrichment of genomic ranges [R package LOLA v1.14.0 (Sheffield and Bock, 2016)] using a provided extended dataset containing 1110 BED files from the Roadmap Epigenomics Project. Briefly, every given set of AMRs was tested for enrichment in chromatin marks using function runLOLA with redefineUserSets parameter set to TRUE. Significant hits (qValue < 1e-03) were grouped by chromatin mark-specific antibody and counted. A set of genomic regions which was used as a reference set for annotation and enrichment analysis (‘universe’) was obtained by merging genomic positions of GSE51032 dataset probes with the following parameters: min.cpgs = 7, merge.window = 1000.
To evaluate the specificity of the enrichment analysis, we performed repeated tests with randomly selected genomic regions from the ‘universe’ set. Subsets of 30, 100, 300, 1000 or 3000 regions over 100 iterations (total of 500 tests) did not result in significant (<1e-03) q-values, confirming non-randomness of the analysis.
For enrichment analysis using chromatin marks in developing mouse embryo, both the specified AMRs and the ‘universe’ set were lifted over to mm9 mouse assembly using R package liftOver v1.8.0 (https://www.bioconductor.org/help/workflows/liftOver/). A dataset containing mouse genomic regions carrying H3K4me3, H3K9me3 or H3K27me3 marks for various developmental stages was obtained from GEO (accession number GSE98149; https://www.ncbi.nlm.nih.gov/geo).
3. Results and discussion
Merging evidence indicates that constitutional mosaic epimutations arising in early embryonic life may be a risk factor for certain cancer forms (Lønning et al., 2019) as well as other diseases (Evans et al., 2007) later in life. However, such epimutations are rare, and may be difficult to identify comparing pooled subsets of cases and controls. In order to detect the genomic regions aberrantly methylated in a small subset of samples, we developed a fast method for within-the-class differential methylation analysis, omitting the need of splitting samples in subsets for comparison.
3.1 Implementation and evaluation of the method
The main processing steps of the ramr algorithm are depicted in the Figure 1. Assuming beta distribution of methylation values, for every sample at every given genomic position, the method estimates distribution parameters and calculates either P-value, or deviation (xiqr) from the median value normalized by interquartile range (IQR). Filtering by P-values or xiqr is applied, and significant genomic positions that remain after filtering are merged into regions using floating window of a provided length. Thereafter, post-filtering is performed to select for regions bearing no less than a specified number of significant genomic positions, followed by a calculation of per-region P-values (see Section 2 for details). The implemented method (‘rare aberrantly methylated regions’; ramr) accepts GRanges object, containing beta values as metadata columns (samples), and returns GRanges object with all the AMRs identified in any of the samples. By its design, the method is not constrained by the source of input data and is suitable for analysis of data obtained by methylation profiling using both array and next-generation sequencing of non-methylation-enriched samples. As precision of parameter estimation as well as correctness of calculated median and IQR values depend on the number of observations, ‘dense’ rather than ‘sparse’ datasets are expected to result in more credible findings.
In order to evaluate sensitivity and specificity of our approach versus existing methods, we simulated 450k array data using GSE51032 as a template (see Section 2 for details). All three ramr filtering methods (‘IQR’, ‘beta’ and ‘wbeta’) were applied to find artificially introduced AMRs in the simulated dataset. The performance was compared to six other available methods (champ.DMP, ProbeLasso, lmFit + comb.p, DMRcate, Bumphunter and dmpFinder). Accuracy metrics and computing times were also compared using the simulated dataset. To select the best performing method we used Matthews correlation coefficient (MCC) as the most reliable metric for classifications of imbalanced sets (Chicco and Jurman, 2020; Chicco et al., 2021).
The top results from the test runs are summarized in Table 1 with further detail in Supplementary Table S1, Precision-Recall (PR) and Receiver Operating Characteristic (ROC) curves are given in the Supplementary Figure S3. The results indicate that all three ramr filtering methods performed consistently better than the other methods for differential methylation analysis across almost all simulation scenarios (with the single exception for delta = 0.050, where DMRcate had second best MCC value for non-unique AMRs). DMRcate and comb-p performed similarly well [as previously revealed by (Mallik et al., 2019) and (Peters et al., 2015)], especially for low-magnitude aberrations (delta ≤ 0.050), demonstrating high recall but rather moderate precision rates. In contrast, methods for differentially methylated position discovery (champ.DMP and dmpFinder) showed high precision at a cost of low recall, while two other methods for DMR search—Bumphunter and ProbeLasso—were often characterized by the worst MCC values in the current testing context. Computing times for ramr were 12x–40x or 70x–220x lower than for DMRcate or comb-p, respectively (Fig. 2, Table 1), making it more suitable for analysis of large datasets.
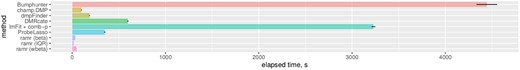
Performance of different methods. Computational time was measured as described in Section 2
Matthews correlation coefficient (MCC) values for unique (uMCC) and non-unique (nMCC) AMR identification for the most optimal cutoffs. Top values are given in bold, corresponding cutoff values—in parentheses
| Delta | ||||||||||
|---|---|---|---|---|---|---|---|---|---|---|
| 0.025 | 0.050 | 0.100 | 0.250 | 0.500 | ||||||
| Method | uMCC | nMCC | uMCC | nMCC | uMCC | nMCC | uMCC | nMCC | uMCC | nMCC |
| Bumphunter | 0.0006 | 0.0011 | 0.0851 | 0.1172 | 0.4391 | 0.6059 | 0.5379 | 0.7165 | 0.5380 | 0.7169 |
| champ.DMP | NA | NA | 0.1378 | 0.0182 | 0.8276 | 0.6474 | 0.9823 | 0.9788 | 0.9894 | 0.9908 |
| dmpFinder | NA | NA | 0.1643 | 0.0316 | 0.8252 | 0.6401 | 0.9818 | 0.9772 | 0.9894 | 0.9901 |
| DMRcate | 0.1483 | 0.1411 | 0.6993 | 0.7319 | 0.8870 | 0.9234 | 0.9339 | 0.9699 | 0.9403 | 0.9788 |
| lmFit + comb-p | 0.1133 | 0.1339 | 0.6509 | 0.6789 | 0.8692 | 0.9093 | 0.9089 | 0.9609 | 0.9163 | 0.9694 |
| ProbeLasso | NA | NA | 0.0316 | NA | 0.4785 | 0.3275 | 0.7176 | 0.7027 | 0.7375 | 0.7466 |
| ramr (beta) | 0.1793 (1e-02) | 0.1615 | 0.7609 (1e-02) | 0.7007 | 0.9482 | 0.9529 | 0.9874 | 0.9893 | 0.9995 (1e-03) | 0.9997 |
| ramr (IQR) | 0.1710 | 0.1695 | 0.7483 | 0.7156 | 0.9633 (2) | 0.9570 (2) | 0.9884 | 0.9916 | 0.9960 | 0.9983 |
| ramr (wbeta) | 0.1706 | 0.1778 (1e-03) | 0.7310 | 0.7597 (1e-03) | 0.9513 | 0.9460 | 0.9894 (1e-04) | 0.9920 (1e-04) | 0.9995 (1e-04) | 0.9998 (1e-04) |
The three different filtering techniques in ramr vary in their precision/recall metrics and were implemented in parallel in order to provide high degree of analysis flexibility. As confirmed by performance evaluation using the simulated dataset, IQR filtering is the fastest and the most stringent but, at the same time, the least sensitive (lower number of TP and FP) among the ramr filtering methods. In contrast, fitting weighted beta distribution increases computational time as well as the number of true positive and false negatives, while fitting non-weighted beta distribution provide a balance between speed and accuracy. In addition, performance metrics vary for unique and non-unique AMRs, thus the best parameters are to be estimated for any particular analysis case.
To further validate performance metrics by randomization, we compared ramr and DMRcate on smaller test datasets with 25 samples, each containing 31 AMRs of varying deviations, over 10 random number generator (RNG) seed values. Analysis revealed that ramr has comparable though slightly superior performance to DMRcate, and that the main performance metrics are weakly affected by the RNG state (Supplementary Table S2; mean ± SD uMCC of 0.6015 ± 0.0152, 0.5960 ± 0.0123, 0.5880 ± 0.0097 and 0.5450 ± 0.0129 for ramr-IQR, ramr-wbeta, ramr-beta and DMRcate with the most optimal cutoffs, respectively).
The template-based data generation approach utilized in this study can be an advantageous alternative to other currently employed techniques. In order to facilitate its use, ramr implementation includes convenient methods for such data generation, thus establishing a quick and easy way to evaluate the state-of-the-art and future algorithms for discovery of aberrant or differential methylation events.
3.2 Characterization of aberrant methylation events in the EPIC-Italy sample set
Aiming to characterize real AMRs, we applied ramr to several publicly available methylation datasets. As methylation variation of individual probes may be a result of technical errors or nucleotide polymorphism, we decreased P-value threshold to 1e-03 and limited our analysis to genomic regions containing at least seven aberrantly methylated CpGs, which is also thought to enhance the biological relevance of search hits.
The search for AMR in the EPIC-Italy GSE51032 dataset resulted in 3582 AMRs across the 845 samples, 2888 of them being hypermethylation- and 694 hypomethylation events. The AMRs were unevenly distributed across chromosomes, occurring at high frequencies on chromosomes 6 and 11 versus particularly low frequency on chromosome 9 (Fig. 3A).
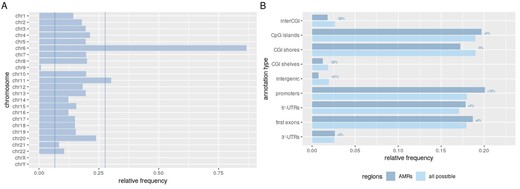
(A) Distribution of AMRs across chromosomes. Number of identified AMRs was normalized by the possible number of regions per each chromosome. Vertical lines mark frequency values equal to Q1 – 1.5*IQR and Q3+1.5*IQR; (B) AMR distribution across various genomic regions. Structural annotations of AMRs or all possible regions were summarized and normalized to their total number. Labels represent percent change per each annotation category
To further characterize the identified AMRs, we annotated them by their positions relative to known genomic elements. Compared to all possible genomic regions, represented within the GSE51032 dataset, AMRs were detected more frequently at core CpG islands and 5′-UTRs (in general associated with gene promoter regions) compared to distant CpG island elements (shores and shelves) or other intergenic regions (Fig. 3B). Per-sample number of AMRs was in a wide range from 0 to 602 with a mean value of 4 and median value of 1 AMR per sample (Fig. 4). Assuming normal distribution of a number of per-sample aberrant methylation events, we classified samples into low-AMR and high-AMR groups using a simple outlier detection rule (threshold=Q3 + 1.5*IQR). High-AMR samples (n = 44) carried most of the AMRs identified (n = 2328).
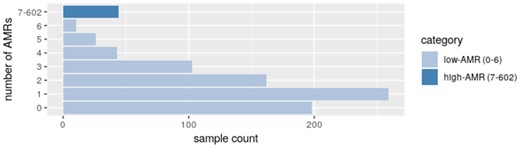
Sample count distribution in low- and high-AMR sample groups
Using information on age of participants (patients and controls together), we confirmed an age-related increase in the number of AMRs [previously established in (Fraga et al., 2005)], but only in the subset of low-AMR individuals (P = 0.000762, versus P = 0.336 for all participants), indicating that very high number of AMRs in some of the samples may not relate to aging, but could result from deregulation of the epigenetic machinery in hematopoietic cells. Of note, none of the participants from the GSE51032 dataset had developed malignant neoplasms of lymphoid, hematopoietic or related tissue, known to be often associated with methylation alterations (Vosberg et al., 2019), at the time of the most recent follow-up. Further subdividing AMRs from low-AMR individuals according to their genomic annotations revealed that the long-range age-related changes accumulate mostly within CpG island shores (Bonferroni-corrected P = 0.00246), while other genomic elements did not show significant correlation between age and number of AMRs [similar correlation was previously reported in (Slieker et al., 2018), reviewed in (Unnikrishnan et al., 2019)].
We further assessed enrichment of AMRs in epigenetic marks using histone modification patterns of 111 reference human epigenomes from Roadmap Epigenomics Human Epigenome Atlas (Roadmap Epigenomics Consortium et al., 2015). In contrast to the random subsets of genomic regions, the full set of AMRs, as well as AMRs subsets belonging to high- or low-AMR samples, showed enrichment in various chromatin modifications which mark active or repressed chromatin (Fig. 5). To assess variability between individual samples we performed similar analysis for the 10 most AMR-rich samples from the high-AMR subset. Differences in their enrichment patterns confirm the existence of multiple aberration types that may cause AMR accumulation in individuals—such as overexpression of DNMT enzymes (Zhang et al., 2018) or mutations in their DNA-recognizing domain (Sendžikaitė et al., 2019).
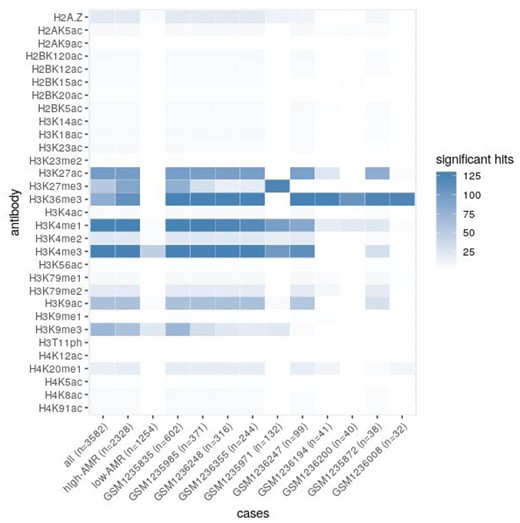
Heatmap plot of AMR enrichment in chromatin modifications. AMRs belonging to particular sample groups or individual high-AMR samples were checked for enrichment in known chromatin modifications. Heat map shows summarized number of significant hits per sample or sample group, numbers of AMRs per sample/group are given in parentheses
3.3 Potential cancer-inducing AMRs
Local epigenetic alterations are known to accumulate and clonally expand in normal mitotic tissues (Bian et al., 2002; Graham et al., 2011; Li et al., 2016). Together with genetic alterations they underlie field cancerization phenomenon best described in gastrointestinal cancers (Baba et al., 2016). Numerous frequent events were already reported to be associated with carcinogenesis or risk of cancer (Sakai et al., 2014; Takeshima and Ushijima, 2019). In order to predict yet unknown, potential cancer-inducing aberrant methylation events, we performed a search of AMRs in methylation profiles of a subset of the TCGA-COAD dataset containing adjacent normal mucosa samples from patients with colon cancer (n = 38). As cancer-inducing aberrant methylation events are expected to be positively selected during carcinogenesis, we post-filtered the set of AMRs using the following criteria: (i) AMR methylation levels of corresponding tumour and adjacent mucosa samples must deviate in the same direction, and (ii) absolute difference between AMR methylation levels of corresponding tumour sample and adjacent mucosa sample must be greater than 0.2. To find out which of the selected regions may exist as cancer-predisposing epimutations, we checked if aberrant methylation in those genomic regions was detected in a subset of low-AMR individuals from GSE51032 dataset that have developed colorectal cancer. Four such regions have been found (none of them coappeared in the same sample): chr3:37033791-37035399 (EPM2AIP1, MLH1), chr12:133463694-133464933 (RP11-46H11.12, CHFR), chr6:31783029-31783545 (HSPA1L, HSPA1A), chr19:28284491-28285308 (LINC00662, CTC-459F4.3, LLNLF-65H9.1). Interestingly, constitutional epimutation in one of these regions which belong to MLH1 gene has been established as rare cause of Lynch syndrome (Lynch et al., 2015), the CHFR genomic region has been found to be hypermethylated in colorectal cancer tissue (Sun et al., 2017), HSPA1A—in ovarian and bladder cancers (Ban et al., 2019; De Andrade et al., 2020), while LINC00662 has been shown to promote tumourigenesis in colorectal cancer (Wang et al., 2019). To the best of our knowledge, potential risk for colorectal cancer related to constitutional mosaic epimutations in any of these genes have not been formally assessed. Of note, we did not identify normal tissue aberrations in other known genes in which methylation is known to be frequent in development of colorectal cancer, such as MGMT (Menigatti et al., 2009) and MSH2 (Kang et al., 2015), likely due to the limited number of samples analyzed (n = 38). Further studies are needed in order to detect other rare events or investigate their potential effect on cancer risk.
3.4 Aberrant methylation events in twins
The emergence of aberrant methylation events may be a result of genetic and/or environmental factors and may potentially occur during various stages of development. Therefore, methylation outlier regions may be present throughout all normal tissues (germline epimutations), in some specific organs, or show mosaic distribution (later developmental or clonal expansion events) (Fraga et al., 2005; Takeshima and Ushijima, 2019). In order to gain more insight into the potential mechanisms of formation of AMRs, we assessed methylation aberrations in a large set of twins from the Environmental Risk (E-Risk) Longitudinal Twin Study (GSE105018). Of all the twin pairs in the dataset (426 monozygotic (MZ) and 306 dizygotic (DZ) pairs), 238 MZ and 142 DZ twin pairs consisted of individuals both having at least one AMR each (the mean number of AMRs per individual was 1.60 and 1.76 for MZ and DZ twins, respectively). One hundred and seventy-six MZ and 46 DZ pairs had at least one AMR overlapping between the two individuals in the pair (the mean number of overlapping AMRs between twins were 1.11 and 0.35 for MZ and DZ twin pairs, respectively). Nearly two-fold difference between the relative frequencies of pairs with overlapping AMRs (176/238 = 0.74 and 46/142 = 0.32, for MZ and DZ twins, respectively) suggests that the emergence of many overlapping AMRs is possibly triggered by genetic components. At the same time, there is also a substantial number of non-overlapping AMRs in both MZ and DZ twins, implying frequent stochastic events.
For all twin pairs having at least one AMR in common, the mean number of common AMRs was 2.54 and 2.51 for MZ and DZ individuals, respectively. In comparison, the mean number of AMRs overlapping between individuals from different twin pairs was 0.044 and 0.039 for MZ and DZ subjects, respectively. Interestingly, methylation profiles in AMRs were similar within twin pairs sharing the AMRs: using only the AMRs genomic coordinates and their methylation profiles we were able to correctly identify corresponding twins for 234 individuals from 123 MZ and 16 DZ twin pairs. There were no gender-specific differences with respect to the above mentioned AMR frequencies or overlap between individuals.
Additionally, according to enrichment analysis, overlapping AMRs—which are thought to emerge during early development—showed significant and exclusive enrichment in H3K9me3 marks in human fetal tissues (adjusted P = 1.29e-05 or higher). The same overlapping AMRs being lifted over to mouse assembly showed even stronger enrichment in H3K9me3 marks in 7.5-days mouse embryo (Bonferroni-adjusted P = 4.60e-25). Interestingly, di- and trimethylation of H3K9 is known to protect maternal 5-methylcytosine from oxidation and subsequent demethylation in the zygotes (Wang et al., 2018; Zeng et al., 2019), hinting towards potential involvement of aberrant H3K9 methylation in AMR emergence after fertilization. Taken together, these findings indicate that genetic and/or early environmental influence is dominating the generation of AMRs in individuals, and that aberrantly methylated genomic regions often bear specific epigenetic patterns.
3.5 Conclusion
Involvement of epigenetic alterations in the development of various diseases have been previously demonstrated and is being confirmed in increasingly larger-scale epigenetic studies (Wong et al., 2020). It is also predicted that epigenetic alterations in a higher than currently anticipated number of cancer-predisposing genes might affect cancer risk (Widschwendter et al., 2018). Given the rapid evolution and cost reduction of next-generation sequencing (NGS), including its widespread use in epigenetics, an increasing number and scale of studies in this area are expected. Consequently, bioinformatic tools allowing versatile analysis of resulting datasets will be of critical importance. We believe that our unbiased approach for rare AMR discovery, which is applicable to both array and NGS data, will help with generation of hypotheses and aid in discovery of more disease risk-related epigenetic aberrations.
Acknowledgement
The authors thank Professor Jan Bulla for valuable early discussions on the topic and computing efficiency of the algorithm.
Funding
The present work was performed in the Mohn Cancer Research Laboratory and was supported by funding from the K.G. Jebsen foundation (Stiftelsen Kristian Gerhard Jebsen), the Norwegian Research Council (Norges forskningsråd), The Norwegian Cancer Society (Kreftforeningen) and the Norwegian Health Region West (Helse Vest).
Conflict of Interest: none declared.
Data availability
The data and R code underlying this article are freely available at DataverseNO research data repository, https://doi.org/10.18710/ED8HSD.
References
The Cancer Genome Atlas Research Network. (

