


Abstract
PERMANOVA (permutational multivariate analysis of variance based on distances) has been widely used for testing the association between the microbiome and a covariate of interest. Statistical significance is established by permutation, which is computationally intensive for large sample sizes. As large-scale microbiome studies, such as American Gut Project (AGP), become increasingly popular, a computationally efficient version of PERMANOVA is much needed. To achieve this end, we derive the asymptotic distribution of the PERMANOVA pseudo-F statistic and provide analytical P-value calculation based on chi-square approximation. We show that the asymptotic P-value is close to the PERMANOVA P-value even under a moderate sample size. Moreover, it is more accurate and an order-of-magnitude faster than the permutation-free method MDMR. We demonstrated the use of our procedure D-MANOVA on the AGP dataset.
D-MANOVA is implemented by the dmanova function in the CRAN package GUniFrac.
Supplementary data are available at Bioinformatics online.
1 Introduction
Over the past decade, numerous microbiome studies have been conducted to elucidate the role of the human microbiome in health and disease, generating an enormous amount of microbiome sequencing data (Kashyap et al., 2017). Microbiome data have complex structures including zero-inflation, skewed abundance distribution and phylogenetic relatedness among features. To address these statistical challenges, one popular approach summarizes the microbiome data in the form of pairwise distances and statistical analyses are then performed based on the distance matrices (Chen et al., 2012). One widely used distance-based method is PERMANOVA (permutational multivariate analysis of variance based on distances), which aims to identify covariates that could significantly explain the inter-subject variability captured by the pairwise distances (McArdle and Anderson, 2001). As a key component in microbiome data analysis, PERMANOVA has been routinely used in establishing an overall association between the microbiome and a covariate of interest. PERMANOVA uses permutation to assess the statistical significance and could be extremely slow at a large sample size. For example, running a single-threaded instance with 1000 permutations on a sample size of 5000 takes ∼1 h on a desktop computer. In practice, many hypotheses may be tested and more permutations are needed to assess a lower Type I error level, further exacerbating the computational burden. Although methods exist for estimating the tail probability of permutation tests (Knijnenburg et al., 2009), an analytical method, an analytical method, which accurately approximates the PERMANOVA P-value without permutation, is highly desirable. Recently, McArtor et al. (2017) proposed the MDMR method for analytical P-value calculation based on the asymptotic distribution of the PERMANOVA pseudo-F statistic. However, no rigorous proof was given. In addition, we found that MDMR could be conservative under many settings. Here, we rigorously derive the asymptotic distribution of the pseudo-F statistic, which is different from the one used in MDMR, and provide an accurate chi-square approximation. We show that our approach, D-MANOVA, provides more accurate approximation than MDMR and is also an order-of-magnitude faster.
2 Materials and methods
We implemented D-MANOVA by the dmanova function inour GUniFrac package (Chen et al., 2012). To facilitate its use, the interface and the output are similar to those of the adonis function in the CRAN vegan package.
3 Results
We conduct simulations (Supplementary Note S3) to study the performance of D-MANOVA, comparing to PERMANOVA and MDMR. Figure 1a compares the P-values of D-MANOVA and PERMANOVA on the log scale [n = 100, Bray–Curtis (BC) distance, Scenario 3 in Supplementary Note S3] based on 1000 simulation runs under the null (H0, left) and the alternative (H1, right). We can see that D-MANOVA and PERMANOVA, P-values are highly correlated under both H0 and H1. Since the lowest P-value is 0.001 for PERMANOVA with 999 permutations, we see a large number of 0.001 under H1 while D-MANOVA has no such restriction. Figure 1b compares the performance of the three competing methods under sample sizes of 100, 200 and 500 based on the BC distance. Under H0 (first point of the power curve), all the methods control the Type I error under the nominal level with MDMR being more conservative. In terms of statistical power, D-MANOVA almost achieves the same power as PERMANOVA, while MDMR is less powerful under n = 100 and 200. The conservativeness has also been noted by the MDMR authors, and they do not recommend to run MDMR on sample sizes <200. However, even under n = 500, we still observe some power loss, indicating the approximation of D-MANOVA is more accurate. It is interesting to study the performance of D-MANOVA under small sample sizes. We thus repeat the simulations at n = 25 and 50. Supplementary Figure S1 shows that the Type I error of D-MANOVA is well controlled at different α levels and the size is closer to the nominal level as the sample size increases. Supplementary Figure S2 shows that the power of D-MANOVA is close to that of PERMANOVA even at n = 25. MDMR, on the other hand, is substantially less powerful under small sample sizes. We also compare the average computation time of the three methods at different sample sizes (Fig. 1c). At n = 12 800, PERMANOVA could not complete the analysis in hours while MDMR takes around 20 min. In contrast, D-MANOVA uses less than one minute. Therefore, D-MANOVA significantly improves over MDMR in terms of both accuracy and computational efficiency.
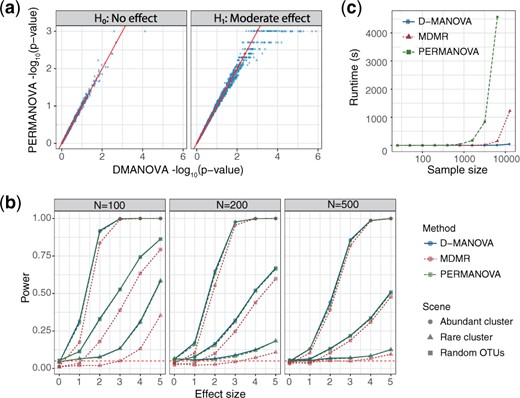
Performance comparison of D-MANOVA, MDMR and PERMANOVA (999 permutations) based on simulations. Bray-Curtis distance was used. (a) Scatter plots comparing the P-values of D-MANOVA and PERMANOVA on the log scale under the null (H0) and alternative (H1). (b) Power comparison at sample sizes 100, 200 and 500. Simulation was averaged over 1000 runs. (c) Runtime comparison at varying sample sizes (). Runtimes were averaged over three repetitions. The computation was performed under R v3.3.2 on an iMAC (3.2 GHz Intel Core i5, 32 GB 1600 MHz DDR3, EI Capitan v10.11.5)
We finally demonstrate the use of D-MANOVA using the publicly available dataset (figshare doi:10.6084/m9.figshare.6137198) from the American Gut Project (AGP) (McDonald et al., 2018). We aim to test the association of the demographic and lifestyle variables with the gut microbiome composition based on the BC distance. We focus the analysis on the American and European populations with an age range between 18 and 80. A total of 7730 subjects were included in the analysis. The country residence was adjusted when testing the associations. Supplementary Table S1 shows the D-MANOVA, MDMR and PERMANOVA association P-values for these demographic/lifestyle variables ordered by effect sizes as measured by the distance-based R2. Due to the large sample size, all the variables except the ‘handness’ are found to be significantly associated with the gut microbiome composition. For those significant variables, PERMANOVA P-values are all <0.001, so more permutations are needed to produce accurate p-values. For the ‘handness’ variable, D-MANOVA achieves a similar P-value as PERMANOVA. In contrast, MDMR tends to produce larger P-values, consistent with the conservativeness noted in the simulations. In terms of computational speed, D-MANOVA is about 13 times faster than MDMR and 567 times faster than PERMANOVA.
Simulations demonstrated that D-MANOVA had good type I error control at the 0.005 level, which should suffice for most community-level analyses since the number of tests is usually limited. However, when an extremely small type I error rate is needed to account for testing thousands or even millions of hypotheses, we recommend using our procedure to filter out most insignificant hypotheses and those hypotheses with extremely small P-values can be further validated by permutation. As the sample size increases, the detectable effect sizes become much smaller and statistical significance from community-level analyses may have limited practical utility. In such case, lower-level analyses (e.g. species- or genus-level) may be more meaningful. D-MANOVA could be possibly applied to those lower-level analyses by defining a relevant distance metric on the lower-level units.
Funding
This work was supported by the Center for Individualized Medicine at Mayo Clinic (J.C.), National Science Foundation [DMS-1830392 and DMS-1811747, X.Z.] and National Institutes of Health [R21 HG011662, J.C. and X.Z.].
Conflict of Interest: none decalred.

