


Abstract
The peptide-centric identification methodologies of data-independent acquisition (DIA) data mainly rely on scores for the mass spectrometric signals of targeted peptides. Among these scores, the coelution scores of peak groups constructed by the chromatograms of peptide fragment ions have a significant influence on the identification. Most of the existing coelution scores are achieved by artificially designing some functions in terms of the shape similarity, retention time shift of peak groups. However, these scores cannot characterize the coelution robustly when the peak group is in the circumstance of interference.
On the basis that the neural network is more powerful to learn the implicit features of data robustly from a large number of samples, and thus minimizing the influence of data noise, in this work, we propose Alpha-XIC, a neural network-based model to score the coelution. By learning the characteristics of the coelution of peak groups derived from the being analyzed DIA data, Alpha-XIC is capable of yielding robust coelution scores even for peak groups with interference. With this score appending to initial scores generated by the accompanying identification engine DIA-NN, the ensuing statistical validation can report the identification result and recover the misidentified peptides. In our evaluation of the HeLa dataset with gradient lengths ranging from 0.5 to 2 h, Alpha-XIC delivered 9.4–16.2% improvements in the number of identified precursors at 1% false discovery rate. Furthermore, Alpha-XIC was tested on LFQbench, a mixed-species dataset with known ratios, and increased the number of peptides and proteins fell within valid ratios by up to 16.4% and 17.8%, respectively, compared to the initial identification by DIA-NN.
Source code is available at https://github.com/YuAirLab/Alpha-XIC.
1 Introduction
Data-independent acquisition (DIA) mass spectrometry (MS) has been widely used in proteomics due to its unbiased and systematic measurement of precursors and fragment ions compared to data dependent acquisition, which improves peptide detection and quantification in the analyses of complex biological samples (Ludwig et al., 2018). The prevalent strategy of peptide identification for DIA data is currently the peptide-centric matching approach (Duncan et al., 2010; Zhang et al., 2020). For each targeted peptide, this approach extracts chromatograms (also referred to as traces which are continuous in retention time and intensity) of a certain number of most intensive fragment ions and assembles them into a peak group followed by scoring, and finally performs statistical validation based on the scores using target-decoy methods (Röst et al., 2014). In general, it is necessary to score the peak group in terms of the mass accuracy, the intensity similarity between the experimental relative intensities and the relative intensities stored in the spectral library, the deviation between the expected and measured retention time, and the coelution of the traces (Reiter et al., 2011). Since the coelution score is a quantification of the consistency of traces in the two dimensions of retention time and intensity and involves more raw mass spectrometry data than other scores, how to score the coelution of peak group traces has a great impact on DIA identification.
Different DIA identification engines have different strategies to score the coelution. Skyline (MacLean et al., 2010) used dot product to represent the coelution of peak groups, which is over-simplistic, especially when the peak group is disturbed. To score coelution comprehensively and robustly, OpenSWATH (Röst et al., 2014) calculated five scores to evaluate the coelution including the dot product, the cross-correlation and the global retention time shift both weighted or non-weighted by the relative intensities of fragment ions. Alternatively, DIA-NN (Demichev et al., 2020) determined a ‘best’ fragment trace that was considered the one least likely to be affected by interference and scored the coelution using Pearson correlation between each trace with the ‘best’ fragment trace. Instead of combining these Pearson correlation scores into a single coelution score, DIA-NN fed them into an ensemble of neural networks together with other scores (i.e. retention time scores, intensity scores) to separate the target and decoy peptides. In order to make sure that the coelution score was not dominated by a single highly scored trace, Avant-garde tool (Jacome et al., 2020) designed peak shape similarity (PSS) score which removed the highest dot product trace with the average profile and calculated a second mean of the remaining dot products. Although the above coelution scores have attempted to reduce the effects of interference as much as possible, the complex and varied forms of interference, such as signal loss, jagging or convolution, still make them susceptible and far from robust.
Deep learning, or deep neural network (LeCun et al., 2015), as a method to learn data inherent characteristics powerfully from a large amount of samples, and thus minimizing the influence of data noise, is suitable for the robust coelution scoring problem. In this paper, we present Alpha-XIC, a neural network-based model to score the coelution of peak groups. This model is trained as a classifier on peak groups determined by an accompanying DIA engine and then used to score coelution for all candidate peak groups. After appending the output of the model as an additional score to initial scores, the statistical validation algorithm of the engine can report the identification result. Our preliminary experiments indicate that Alpha-XIC can score the coelution of peak groups robustly and thus significantly improving the identification of DIA data.
2 Materials and methods
2.1 Workflow
There are a few factors that affect the appearance of peak groups, such as liquid chromatography (LC) gradient lengths, cycle strategies of DIA experiments and noise baselines of mass spectrometers (Ludwig et al., 2018). In order to make Alpha-XIC more specific to the peak groups that need to be scored, it is not designed to be a model that is trained once and used for each DIA file. Instead, Alpha-XIC is trained on the peak groups derived from the being analyzed DIA data. From this point of view, Alpha-XIC depends on a DIA engine to perform an initial identification to offer training samples. In other words, Alpha-XIC can be considered as a plug-in of the DIA engine. As DIA-NN has been proved to be superior to other DIA engines (Demichev et al., 2020), it is adopted as the matching engine for Alpha-XIC in this study. The workflow of Alpha-XIC was plotted in Figure 1 and described in phases as follows.
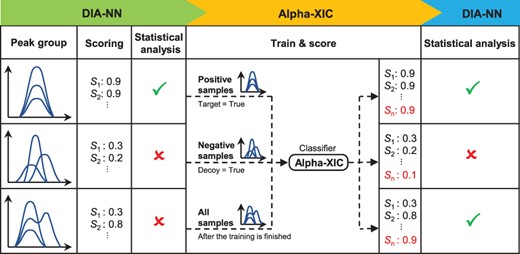
The workflow of Alpha-XIC. From left to right, the workflow of Alpha-XIC includes the initial identification by DIA-NN, the train and score phase of Alpha-XIC and the phase of the statistical analysis. In this figure, the peptide corresponding to the third peak group which is subject to interference is recovered after adding the coelution score by Alpha-XIC
1. Initial identification by DIA-NN. With the help of the spectral library and the automatic determination of search parameters (such as mass correction and mass accuracy), DIA-NN extracted the fragment ion traces, identified and scored the most likely peak group for each target or decoy peptide. Then, a linear classifier was used to separate the target peptides from decoy peptides preliminarily. At the end of this phase, candidate peak groups, corresponding to target and decoy peptides, were obtained as well as their assigned diverse scores.
2. Training and utilization of Alpha-XIC. Like DIA-NN does not restrict the set of peak groups used to train the statistical validation model, Alpha-XIC was also trained as a binary classifier on all these candidate peak groups. The peak groups extracted from target peptides were regarded as positive samples, while those of decoy peptides were taken as negative samples. After the training was completed, all the candidate peak groups were scored by Alpha-XIC. The resulting positive classification probabilities were used as the additional scores and appended to scores generated by DIA-NN in phase 1.
3. Statistical validation by DIA-NN. DIA-NN used an ensemble of deep feed-forward, fully connected neural networks to distinguish between target and decoy peptides by learning from these scores. At the end, DIA-NN reported the q-values of target peptides as well as their quantities.
2.2 Model
Under different LC-MS conditions and DIA configurations, the widths of peak groups and the number of data points over the elution profile are different (Ludwig et al., 2018). In order to process these different peak groups, it is necessary to perform preprocessing to uniform the format of peak groups. The top panel of Figure 2 plotted the details of preprocessing. For each peak group, Alpha-XIC extracted the traces within the boundaries which were determined by DIA-NN. As peak groups were used in both training and scoring phases, we shuffled the order of traces randomly before fed into the network in the training phase to avoid the possible overfitting. Next, each trace was normalized in intensity and interpolated to a fixed dimension 32. Then, the peak group was smoothed using a Savitzky-Golay algorithm (11 wide and third order) commonly used for spectrometric data suggested by Sturm et al. (2008) to filter noise.
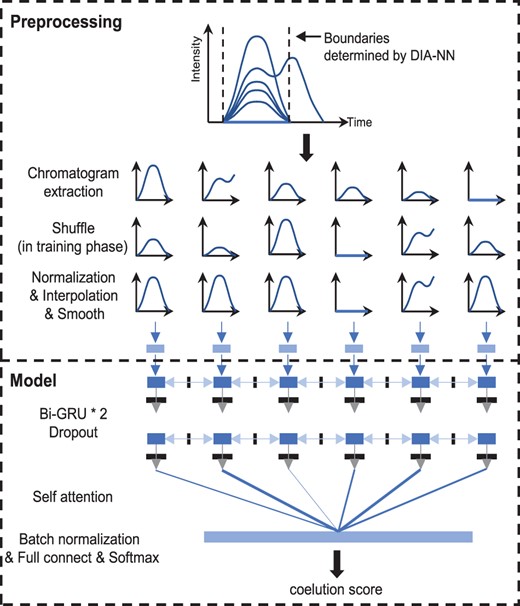
The preprocessing of input peak groups and the model construction of Alpha-XIC
The bottom panel of Figure 2 displayed the model components of Alpha-XIC. In order to adapt Alpha-XIC to peak groups with different numbers of traces, RNN (recurrent neural network) was used to analyze the peak group by the means of trace series. Specifically, two layers of bi-directional gated recurrent memory units (Bi-GRU, a type of RNN, Chung et al., 2014) with hidden size 64 and dropout (Srivastava et al., 2014) 0.5 were selected to process the input of traces. To concatenate the output of each unit of Bi-GRU, a self-attention layer (Lin et al., 2017) was used. In this way, the peak group was converted to a vector of dimension 128. Then, this vector was converted to dimension 2 by a batch normalization layer (Ioffe et al., 2015), a fully connected layer and a softmax layer in order. At last, the value represented the positive class probability was output as the score of coelution of the peak group. Note that we experimented with different interpolation dimension and output size of Bi-GRU, however, this did not deliver improvements in performance.
PyTorch (v.1.1.0, https://pytorch.org) was used to implement and train Alpha-XIC. We used the Adam optimizer with an initial learning rate of 0.001 and 512 samples per batch. The loss function in training phase was cross entropy loss.
2.3 Datasets
The purpose of Alpha-XIC is to score coelution of peak groups robustly and improve DIA identification. In this study, the following public datasets that have been specifically created for testing DIA software were used to evaluate and benchmark Alpha-XIC.
HeLa dataset. This DIA dataset is a HeLa whole-proteome tryptic digestion and acquired on a nanoflow liquid chromatography coupled to a QExactive HF mass spectrometer with different gradient lengths (Bruderer et al., 2017). Here, four RAW files with gradient 0.5, 1, 1.5, 2 h (referred as HeLa-0.5 h, HeLa-1 h, HeLa-1.5 h, HeLa-2 h) were selected to cover common experimental setups of gradients. All these four files were collected with collision energy 27.5 and with DIA configuration comprising one MS1 survey scan (using a resolution of 120 000, AGC target of 3e6, maximum fill time of 60 ms and m/z range of 350–1650) followed by a few consecutive isolated MS2 windows of variable width (using a resolution of 30 000, AGC target of 3e6, injection time of auto and minimum m/z of 200). The number of variable isolation windows for HeLa-0.5, HeLa-1h, HeLa-1.5h and HeLa-2h were set to 21, 26, 37, 30, respectively.
LFQbench dataset. This dataset contained six SWATH (Gillet et al., 2012) files and was acquired on a TripleTOF 6600 with 64 variable isolation windows (Navarro et al., 2016). Six files were divided into sample A and sample B, each of sample had three replicates. Sample A consisted of mixed tryptic digestion of human, yeast and Escherichia coli proteins in 65%, 15% and 20%, respectively. Sample B consisted of proteins same as sample A but mixed in 65% (human), 30% (yeast) and 5% (E.coli). As a result, the expected peptide and protein ratios (A/B) are: 1:1 for human, 1:2 for yeast and 4:1 for E.coli. Both .raw files of HeLa dataset and .wiff files of LFQbench dataset were converted to mzML format by msconvert.exe from the ProteoWizard package (version 3.0.19133) with 32-bit precision and zlib compression.
For HeLa dataset, the pan-human mass spectrometry library (PHL, Rosenberger et al., 2014) was selected as the spectral library. For LFQbench dataset, as the original library provided by LFQbench project was not complete (Navarro et al., 2016), we replaced the human peptides in the original library with PHL library. The generation method of decoy peptides for the library was mutated approach (Bruderer et al., 2017; Demichev et al., 2020). DIA-NN (v.1.7.16) was adopted and performed with the default parameters for each experimental run. The mass tolerance for chromatograms extraction used in Alpha-XIC was inherited from DIA-NN which determined search parameters automatically.
3 Results
3.1 Overfitting evaluation on HeLa dataset
Although Alpha-XIC has adopted dropout, shuffling the input trace series in training phase to prevent potential overfitting, it is necessary to evaluate the overfitting as it directly affects the generalization performance of the classifier. A direct way to judge whether overfitting has occurred is to examine whether the loss and prediction accuracy of the model on the training set and the test set are consistent. Following this way, we carried out DIA-NN coupled with Alpha-XIC to each file of HeLa dataset. To calculate the metric accurately, the positive training samples were restricted to 1% false discovery rate (FDR), and the decoy peak groups with an equal number by randomly sampling were taken as the negative samples. The training samples were divided into a training set and a test set randomly by a ratio of 4:1, and the training epoch was set to 10. We recorded the loss value (cross entropy loss) and classification accuracy for both the training set and test set. The results were plotted in Figure 3.
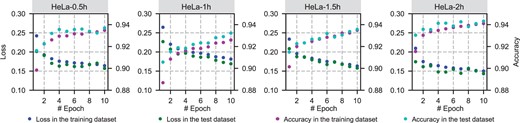
Overfitting evaluation on HeLa dataset
It could be noticed that the classification accuracy of Alpha-XIC was as high as ∼90% after only one round of training for test set. We speculated that, on the one hand, tens of thousands of training samples in each training were sufficient for Alpha-XIC, on the other hand, it may be relatively effortless for the model to learn coelution characteristics from peak groups. As the epoch increased to 10, the loss slightly decreased and the accuracy slightly increased. More importantly, there is no significant difference between the training set and test set in terms of the loss and accuracy, which means the overfitting was either non-existent or negligible even the training epoch reached 10. Therefore, we concluded that Alpha-XIC has not been subjected to overfitting at least in HeLa dataset. Moreover, we conservatively fixed the epoch to one for Alpha-XIC, minimizing the effects of potential overfitting.
3.2 Case comparisons for different interference
Since DIA-NN does not calculate a single coelution score for peak groups, here, we compared the robustness of the coelution score by Alpha-XIC with the scores by OpenSWATH using examples of peak groups with interference. As mentioned in above, multiple scores in two dimensions of the retention time shift and shape similarity are calculated to characterize the coelution of peak groups by OpenSWATH. In detail, the coelution scores by OpenSWATH include (Reiter et al., 2011; Röst et al., 2014):
dotprod: It is computed by averaging the dot product values of pair-wise traces of peak groups.
xcorr: To achieve more global characteristics of coelution than a simple comparison of apex time shift, OpenSWATH constructs an upper triangular matrix containing the delay which maximizes the cross-correlation of pair-wise traces. Xcorr score is the mean plus the standard deviation of the delays in the matrix.
xcorr_weight: Similar to xcorr, but using the intensity weights to aggregate the delays rather than the mean.
shape: Similar to xcorr, OpenSWATH constructs an upper triangular matrix containing the maximum cross-correlation value of pair-wise traces. Shape score is the mean of the cross-correlation values in this matrix.
shape_weight: Similar to shape, but using the intensity weights to assemble the cross-correlation values.
For a given peptide with a set of fragment ions, n represents the number of fragment ions, ui is the intensity vector of ith trace from the ith fragment ion, v is the mean intensity vector of the n traces, k denotes the index of trace for which the dot product between v and uk is the highest.
The scores of dotpord, xcorr, xcorr_weight, shape, shape_weight and PSS are 1,0,0,1,1 and 1, respectively, on peak groups with ideal coelution. When coelution is not perfect due to interference, such as signal loss, jagging or convolution, starting point shift, apex point shift and end point shift, the above six scores will deviate more or less from the ideal values. Unlike these scores, Alpha-XIC quantifies coelution by learning from the peak group itself, rather than by manually designing functions, which makes it possible to minimize the impact of interference for coelution scoring.
In order to compare the robustness of Alpha-XIC score with the above scores under different interference, four peak groups in HeLa-1h were picked out to represent different coelution interference. Figure 4 plotted the peak groups as well as precursor ion chromatograms and their corresponding coelution scores by OpenSWATH, PSS score and Alpha-XIC. As can be observed that, a trace (y9+, red color) in precursor ‘ITELFAVALPQLLAK_2’ was disturbed which led to the incoordination of its start and apex points against to the global start and apex points of the peak group. As a result, the dotprod was low to 0.34. For the precursor ‘ALLNHLDVGVGR_3’, a trace (y5+, green color) had interference and a trace (y10++, blue color) was missing such that all the coelution scores by OpenSWATH (dotprod: 0.35, xcorr: 6.95, xcorr_weight: 5.97, shape: 0.65, shape_weight: 0.33) and PSS score (PSS: 0.52) had remarkable deviations compared to idea values. Similarly, two traces (y12+, blue color; y11+, brown color) were disturbed in precursor ‘PVAPSGTALSTTSSK_2’ and thus, particularly, the dotprod score was as low as 0.29. The peak group signal of ‘GIVGVENVAELKK_3’ was the most complex and resulted in dramatic deviations for all the coelution scores by OpenSWATH (dotprod: 0.36, xcorr: 8.29, xcorr_weight: 6.68, shape: 0.40, shape_weight: 0.15) and PSS score (PSS: 0.66). Nevertheless, Alpha-XIC scored consistently these four peak groups with high values (1.00, 0.99, 1.00, 0.95, respectively) which made the corresponding peptides recovered at a cutoff of 1% FDR. In the circumstance that the coelution of the peak group was really far from the ideal as exemplified by the last case, Alpha-XIC still reported a high score 0.95, we speculated that this may be this peak group conformed to the latent characteristics of coelution learned by the network in the training phase or just was similar to one certain positive sample.
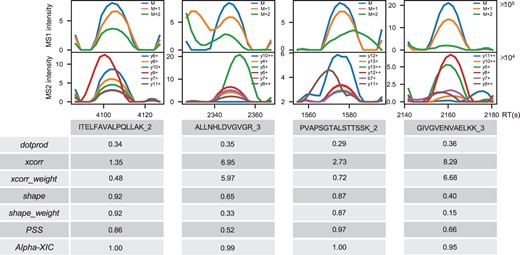
Comparisons of different coelution scores under different interference. The detailed calculation of the coelution scores ‘dotprod’, ‘xcorr’, ‘xcorr_weight’, ‘shape’ and ‘shape_weight’ by OpenSWATH is described in Results part. ‘PSS’ means the PSS score proposed by Avant-garde and ‘Alpha-XIC’ means the coelution score by Alpha-XIC
From these case comparisons, it was implied that Alpha-XIC was capable of generating coelution scores robustly.
3.3 Performance evaluation on HeLa dataset
As shown in Figure 1 of Demichev et al. (2020) and Figure 4 of Jacome et al. (2020), DIA-NN is superior to other search engines (including Skyline) in terms of peptide identification and Avant-garde is used to polish and curate the results of Skyline, our performance evaluation did not test other software but only DIA-NN. To evaluate the performance of DIA identification by Alpha-XIC, DIA-NN, DIA-NN coupled with PSS or Alpha-XIC were performed to HeLa dataset whose gradient lengths range from 0.5 to 2 h in steps of 0.5 h. The number of identified precursors was plotted against the FDR in Figure 5a. As can be seen, PSS score had little effect on identification compared to the raw identification by DIA-NN, while Alpha-XIC delivered significant identification improvements. At 1% FDR, 9.4%, 16.2%, 13.8% and 15.3% improvements were achieved by Alpha-XIC for HeLa-0.5 h, HeLa-1 h, HeLa-1.5 h and HeLa-2 h, respectively, compared to DIA-NN.
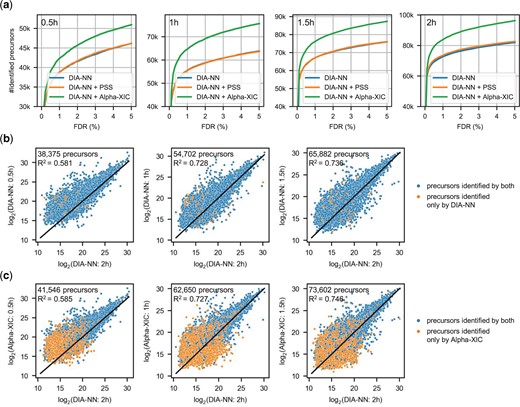
Performance evaluation of Alpha-XIC on HeLa dataset. The gradient lengths of HeLa dataset cover 0.5, 1, 1 and 2 h. (a) The number of identified precursors against the FDR by DIA-NN, DIA-NN coupled with PSS score or Alpha-XIC. (b) Scatter plot of log2-quantities of identified precursors at 1% FDR by DIA-NN. (c) Scatter plot of log2-quantities of identified precursors at 1% FDR by Alpha-XIC
To validate the identifications, we checked that whether the quantitative ratios between the analysis of HeLa-0.5 h, HeLa-1 h and HeLa-1.5 h to that of HeLa-2 h met the ratio of 1:1 since each run in HeLa dataset contains equivalent proteolysis. Figure 5b and c showed the number of identified peptides at 1% FDR (excluding those that cannot be quantified by HeLa-2 h), the log2-quantities distribution of identified peptides, and the goodness of fit (using linear regression with unity slope) of DIA-NN and Alpha-XIC, respectively. Compared to DIA-NN, it can be seen that Alpha-XIC improved the identification (38 375 versus 41 546 in HeLa-0.5 h, 54 702 versus 62 650 in HeLa-1 h and 65 882 versus 73 602 in HeLa-1.5 h) while maintaining the quantitative accuracy (R2 value: 0.581 versus 0.585 in HeLa-0.5 h, 0.728 versus 0.727 in HeLa-1 h and 0.736 versus 0.746 in HeLa-1.5 h). This proved that the gains by Alpha-XIC was reliable on HeLa dataset.
Last but not least, Alpha-XIC, in our device of CPU Intel i7-7700K 4 cores, Win10, 64 bit, 64 GB memory and GPU Nvidia GTX 1060, spent 3.5 min in the case of HeLa-1 h where DIA-NN generated 97 867 candidate target peptides and 199 752 decoy peptides.
3.4 Performance evaluation on LFQbench dataset
To further assess whether the increase in identification resulting from Alpha-XIC was genuine peptides, we performed the test of Alpha-XIC on LFQbench dataset which had known ratios of mixed species. The LFQbench dataset was identified by DIA-NN with or without Alpha-XIC, and the quantitative information of the identified peptides under 1% FDR of six files (two types of samples and both with triplicates) was obtained. The R package attached to LFQbench project merged the six identification results, visualized the distribution of the relative quantitative and the experimental ratios (Fig. 6a) and reported the number of peptides and proteins fell within the valid ratios (which were defined as a range of five standard deviations from the average ratio by LFQbench, Fig. 6b). As we can see, on the one hand, Alpha-XIC significantly increased the number of peptides and proteins fell within valid ratios compared to DIA-NN (16.4% and 17.8% improvements for human peptides and proteins; 3.4% and 2.6% for yeast peptides and proteins; 12.9% and 8.0% improvements for E.coli peptides and proteins), on the other hand, the results of Alpha-XIC slightly enlarged the median deviations between the experimental ratios and the expected ratios (Alpha-XIC introduced the median deviations: 0.000 and 0.000 for human peptides and proteins, respectively, -0.051 and -0.043 for yeast peptides and proteins, respectively, 0.235 and 0.168 for E.coli peptides and proteins, respectively, compared to the median deviations by DIA-NN: 0.000 and 0.000 for human peptides and proteins, respectively, -0.049 and -0.035 for yeast peptides and proteins, respectively, 0.230 and 0.170 for E.coli peptides and proteins, respectively). In other words, unlike Avant-garde tool (Jacome et al., 2020) which achieved fewer identification but more accurate global quantification, we believed Alpha-XIC delivered more identification at the expense of the reduction of integral quantitative accuracy slightly on LFQbench dataset. This may be due to the fact that Alpha-XIC recovered some of the interfered peptides, but DIA-NN quantitative algorithm cannot eliminate the influence of the interference thoroughly. A better quantification algorithm for peptides with interference correction needs to be developed in the future.
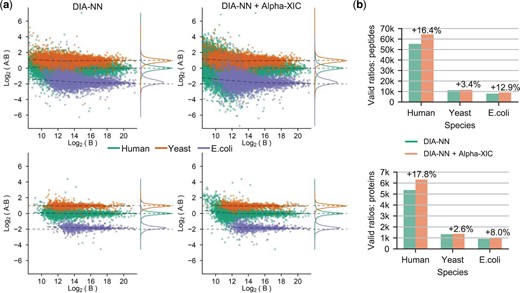
Performance evaluation of Alpha-XIC on LFQbench dataset. (a) Visualization of the distribution of the relative quantitative and the experimental ratios using the LFQbench R package. (b) Comparisons of the numbers of valid ratios. Both the distribution and the valid ratios are plotted on the peptide and protein levels
4 Conclusion
In this study, we propose a neural network, Alpha-XIC, to score the coelution of peak groups. Instead of manually designing functions, Alpha-XIC characterizes the coelution by learning the peak group itself, which makes it possible to eliminate the influence of interference and achieve the robust coelution score. We found that Alpha-XIC could give a high coelution score to a peak group even in the circumstance of severe interference. By appending the coelution scores from Alpha-XIC to the initial scores from DIA-NN, Alpha-XIC obtained improvements by 9.4–16.2% in terms of the number of identified precursors at 1% FDR for HeLa dataset. Besides, on the LFQbench dataset, Alpha-XIC increased the number of peptides and proteins fell within the valid ratios range by up to 16.4% and 17.8%, respectively, compared to the identification by DIA-NN solely.
As models like Alpha-Frag (Song et al., 2021) have implemented the presence prediction of fragment ions of a peptide, in the future, Alpha-XIC can extend the ions involved in the construction of peak groups to precursor ions, unfragmented precursor ions and the predicted present fragment ions as well as their isotopic ions, rather than just the few fragment ions provided in the spectral library. In this way, Alpha-XIC takes into account the coelution of all ions derived from one targeted peptide, thus making full use of the coelution information and improving the identification of DIA data further.
Funding
This study was funded by National Natural Science Foundation of China [82003766, 31970636], Academic Promotion Project of Shandong First Medical University.
Conflict of Interest: none declared.

