


Abstract
The solvent accessible surface is an essential structural property measure related to the protein structure and protein function. Relative solvent accessible area (RSA) is a standard measure to describe the degree of residue exposure in the protein surface or inside of protein. However, this computation will fail when the residues information is missing.
In this article, we proposed a novel method for estimation RSA using the Cα atom distance matrix with the deep learning method (EAGERER). The new method, EAGERER, achieves Pearson correlation coefficients of 0.921–0.928 on two independent test datasets. We empirically demonstrate that EAGERER can yield better Pearson correlation coefficients than existing RSA estimators, such as coordination number, half sphere exposure and SphereCon. To the best of our knowledge, EAGERER represents the first method to estimate the solvent accessible area using limited information with a deep learning model. It could be useful to the protein structure and protein function prediction.
The method is free available at https://github.com/cliffgao/EAGERER.
Supplementary data are available at Bioinformatics online.
1 Introduction
The location of the residues in the protein is very important to the protein structure and protein function (Aloy et al., 2001). For example, the stability of protein could be influenced by the mutations of residues in the protein core (Brockwell et al., 2002), and may cause protein misfolding and aggregation (van der Kamp and Daggett, 2010; Xu et al., 2011). The protein stability and specificity of the protein interaction may be influenced by the residues on the protein surface (Yi et al., 2017).
Solvent accessible area (SA) is an important structure parameter to measure the exposed or buried status of residues in a protein. For a given protein 3D structure, the SA was typically computed by rolling a probe sphere over the van der Waals surface of the protein (Sanner et al., 1996). To get the accessible surface or residues, the SA of the entire protein was divided by the number of residues. Since the residue is of different types and different sizes, the relative accessible area (RSA) was proposed (Rost and Sander, 1994), which is defined as the residue SA divided by the maximal SA of this type of residue. Predicted RSA values have been used as useful features in many protein function predictions (Gao et al., 2010, 2012, 2016a,b, 2018, 2019, 2020; Zhang et al., 2019; Zheng et al., 2014).
In practice, the structure may not be well resolved. In cases where the residues have missing coordinates or the structure with low resolution, the computation of the residue accessible surface will fail because the coordinates of all the heavy atoms must be known a priori to compute the accessible surface area of a residue. Another limitation of SA is that it cannot be used to describe the completely buried residues.
To address this issue, several methods have been proposed to estimate the solvent surface. For example, the coordination number (CN) (Simons et al., 1997) was proposed by counting the number of Cα atoms within a sphere around the Cα atom of the residue. CN is a useful index to distinguish the completely exposed residue from buried residue. But it cannot determine the degree of solvent exposure among the piratically exposed residues.
The half sphere exposure (HSE) (Hamelryck, 2005) was proposed by cutting the sphere determining the CN into two half spheres by a plane orthogonal to the Cα–Cβ vector of the residue. RSA is correlated to CN values corresponding to the upper half-sphere. HSE is the CN number in the upper half-sphere. HSE can be used as an RSA. However, in order to calculate this index, we need to know both coordinates of Cα-Cβ atoms.
Recently, SphereCon (Gress and Kalinina, 2020) was proposed to estimate the RSA from the structure, or the structural data are missing. SphereCon can output an estimation of RSA if the coordinates of Cα atoms are available and protein sequence is known; if the only coordinates of Cα atoms are available; if the only prediction of a distance matrix or contact matrix is available. The intersections between the search space and the spheres corresponding to the neighboring residues were used to calculate SphereCon.
SphereCon contains two parameters, r and α, where r is the search sphere radius, α is the cosine of the apex angle. That means SphereCon needs cutoffs to find the optimized parameters. It is a simple rule to provide a measure using the cutoff. Could we estimate the residue RSA values using a more complex model? To address this issue, we proposed a novel method for estimation RSA using the Cα atom distance matrix with the deep learning method (EAGERER). The new method was evaluated on different test datasets and compared with other RSA estimators. Results reveal that EAGERER obtains higher Pearson correlation coefficients and lower mean absolute errors.
2 Materials and methods
2.1 Datasets
The model was trained and tested using datasets from SPIDER2 (Yang et al., 2017). The training dataset of SPIDER2 contains 4590 proteins, whereas the test dataset of SPIDER2 has 1199 proteins. The sequence identity of the proteins is less than 25% and the resolutions of their X-ray resolutions are better than 2 Å. We further separated the 4590 proteins in the training dataset, using 80% as the training dataset and 20% as the validation dataset. Finally, there are 3672 proteins used as training dataset and 918 proteins used as the validation dataset, and 1199 proteins as the test dataset, (denoted by TR3672, Val918, TS1199). The validation dataset was used to optimized the parameters.
To further evaluate the performances of our method, we downloaded the CASP14 (Critical Assessment of Techniques for Protein Structure Prediction) at https://www.predictioncenter.org/download_area/CASP14/targets/. This dataset contains 34 proteins (denoted by CASP34). To evaluate the influence of the protein secondary structure, we got a subset of the SphereCon (Gress and Kalinina, 2020) training dataset using the first chain of each protein. These proteins were downloaded from SCOP (Murzin et al., 1995). We chose the representative structures from the alpha, beta, alpha/beta, alpha+beta families. This dataset contains 499 proteins (denoted by SCOP499). These datasets are available at http://github.com/cliffgao/EAGERER.
2.2 Features
The input features include both 1D structural features and 2D distance maps. For the 1D structural features, the residue was encoded as a 21-dimension vector (20 amino acid types and one for non-standard amino acids). The 2D distance was calculated by the distance of the Cα atom coordinates in the protein structures.
2.3 Method
Motivated by the Chen et al. SPORF (Chen et al., 2020), the 2D residue–residue distance map was viewed as an image. Recurrent neural network (RNN) and convolutional neural network (CNN) were designed to extract features from 1D features and 2D features. A self-attentional ultra-deep residual convolutional neural network was first used to encode the 2D distance map into a vector representation. And then the vector representation was concatenated with 1D one-hot vector and fed into an RNN module to generate a protein RSA prediction. The neural network of this method is shown in Figure 1.
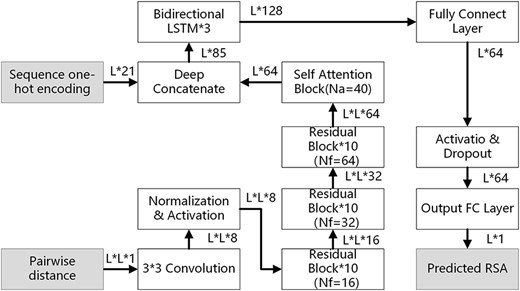
The neural network layout of the proposed method EAGERER. L is the length of the protein sequence. Nf is the number of kernels in each convolution layer; Na is the number of parallel attention layers. FC, fully connect
For the residual block, batch normalization was used to regulate the network. The exponential linear unit (ELU) was used as an activation layer. There are 30 (10 + 10 + 10) residual blocks used in the model. The self-attention block converts the feature with L*L*64 into the feature with L*64. The bidirectional long short-term memory (LSTM) contains 3 layers. For each layer, there are two independent LSTM. Each LSTM contains 64 one-cell memory blocks and 128 hidden states for each bidirectional LSTM layer. The fully connected layer consists of 64 nodes with a bias node with an ELU activation function. The output layer has 1 output neuron to output the predicted RSA value for each residue. More details could be found in Chen et al. (2020).
The current model is different from SPROF (Chen et al., 2020). The current model integrates the SPORF model into one module for representing the input protein sequence. The current model used the mean squared error (MSE) loss to predict the continuous RSA values, instead of the cross-entropy loss in the SPROF model for discrete states prediction.
The model was implemented using the PyTorch library (https://github.com/pytorch) and trained with mean squared error loss function and ADAM algorithm for optimization. We optimized the parameters on the validation dataset. The learning rate of 0.0005 was used and 50% dropout rate was used in the fully connected layer. Epoch = 50 was used in the final model.
2.4 Measure the performance
The actual SA value was calculated by DSSP software (Kabsch and Sander, 1983), and then the SA was changed into the RSA by divided the maximum of the SA of the residue (See supplementary Table S1). Pearson correlation coefficient (PCC) was used to evaluate the relationship between the predicted RSA and actual RSA value. Mean absolute value (MAE) between the predicted RSA and actual RSA was also used to evaluate the performances. We compute the PCC/MAE for each protein on the dataset and compute the average PCC/MAE.
We notice that the proposed method was designed for structures with missing atoms, where DSSP software cannot work. DSSP software has to compute the SA or RSA of residue with all atom coordinates, while PDB files often contain missing side-chain atoms, especially for low-resolution experimental structures. Additionally, the predicted protein structures usually have main-chain or Cα atoms only, which cannot be processed by DSSP as well.
3 Results
3.1 Results on the training dataset
The results on training, validation and test datasets are shown in Table 1. The average PCCs between the predicted RSA and actual RSA were 0.942, 0.927 and 0.921 on the training, validation and test datasets, respectively. The average MAE values are 0.080, 0.089 and 0.091 on the training, validation and test dataset, respectively. It offers a similar quality of the model on both the training dataset and test dataset. It indicates that the model is not overfitting. The proposed method achieved the same performance on the validation dataset and the test dataset. It shows that the proposed method is robust.
The performance of EAGERER on different datasets
| Dataset | Average PCCa | Average MAEa |
|---|---|---|
| Training dataset (TR3672) | 0.942 | 0.080 |
| Validation dataset (Val918) | 0.927 | 0.089 |
| Test dataset (TS1199) | 0.921 | 0.091 |
| Dataset | Average PCCa | Average MAEa |
|---|---|---|
| Training dataset (TR3672) | 0.942 | 0.080 |
| Validation dataset (Val918) | 0.927 | 0.089 |
| Test dataset (TS1199) | 0.921 | 0.091 |
PCC, Pearson correlation coefficient; MAE, mean absolute error.
3.2 Comparison with other machine learning methods
To assess the performance of our method, we compared our method with other machine learning methods, fully connected network (NN), ridge regression (RR) and random forest (RF). We also tried to use the support vector machine with a linear kernel or non-linear kernels to implement the method. However, it took too long to generate the results. The number of features needs to be fixed to run the traditional machine learning method. We used both 1D features, and encoded amino acids in a 21D vector and 2D features, in which the 2D distances were divided into 32 bins [0, 0.5,1.0, …,16]. The total feature numbers were 53 (21 + 32).
We optimized the parameters on the validation dataset and predicted with the optimized parameters on the test dataset. The results (Table 2) show that the performance of the proposed method was the best in terms of the average PCC and average MAE. The proposed method, EAGERER, achieved an average PCC of 0.921, average MAE of 0.091. It indicates that the proposed method can learn more information from the training dataset and achieved better performance than the traditional machine learning method.
Compared with other methods on the test dataset TS1199. The best result is marked with the bold font.
| Method | Average PCCb | Average MAEb |
|---|---|---|
| Fully connected network (NN) | 0.845 | 0.109 |
| Ridge regression (RR)a | 0.766 | 0.179 |
| Random Forest (RF)a | 0.827 | 0.118 |
| EAGERER (this work) | 0.921 | 0.091 |
| Method | Average PCCb | Average MAEb |
|---|---|---|
| Fully connected network (NN) | 0.845 | 0.109 |
| Ridge regression (RR)a | 0.766 | 0.179 |
| Random Forest (RF)a | 0.827 | 0.118 |
| EAGERER (this work) | 0.921 | 0.091 |
RR with optimized parameter: alpha = 0.1; RF with optimized parameter: n-estimator = 150.
PCC: Pearson correlation coefficient; MAE: mean absolute error.
3.3 Comparison with other indexes to estimate the RSA
We further compared our method EAGERER with Contact number (CN), Half Sphere Exposed (HSE) and SphereCon with two different versions using only Cα atom or Cα atom and amino acids type. The values of CN and HSE were computed using a cutoff of 13 Å. SphereCon was run with parameter ‘-bb’, which means SphereCon used the only Cα atom coordinates to estimate RSA, and with parameter ‘-Ca’, which means SphereCon used the Cα atom coordinates and amino acid type to estimate RSA. From Table 3, we could find that the proposed method achieved the highest average PCC than other indexes on both test datasets TS1199, and CASP34. It shows the advantage of our method for estimating the relative accessible area values.
Average PCC values of different indexes on the two different test datasets. The best result is marked with the bold font.
| Dataset | CNa | HSEb | SphereConc | SphereCond | EAGERER |
|---|---|---|---|---|---|
| TS1199 | −0.748e | −0.766 | 0.882 | 0.903 | 0.921 |
| CASP34 | −0.768 | −0.806 | 0.901 | 0.919 | 0.928 |
| Dataset | CNa | HSEb | SphereConc | SphereCond | EAGERER |
|---|---|---|---|---|---|
| TS1199 | −0.748e | −0.766 | 0.882 | 0.903 | 0.921 |
| CASP34 | −0.768 | −0.806 | 0.901 | 0.919 | 0.928 |
Contact number (CN) was calculated with the radius cutoff of 13 Å.
Half sphere exposed (HSE) was calculated with cutoff of 13 Å.
SphereCon: using only the Cα atom coordinates with parameter ‘-bb’.
SphereCon using the Cα atom coordinates and amino acids type with the parameter ‘-Ca’.
The average PCC was calculated on the test dataset, except two proteins (PDBIDs : 1t79B, 1t7fB), for which CN values of residues in the protein were the same value. As a result, it resulted in NA in the computation of the PCCs for the two proteins.
3.4 Performance on proteins with different lengths and residues with different secondary structures
To show the predicted RSA influenced by the protein length, we plot the Pearson correlation coefficient (PCC) between predicted RSA and actual RSA with different protein lengths (Fig. 2). All proteins are from TS1199. It shows that our method gets lower PCC on the short proteins. The average length of proteins with PCC values below 0.80 is only 45. It indicates that if the protein is too short, the model cannot obtain useful information, using the 1D sequence encoding and 2D residue–residue distances.
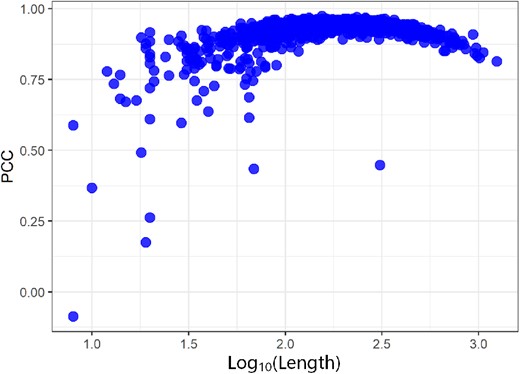
Pearson correlation coefficient (PCC) between predicted RSA and actual RSA on proteins with different lengths in the TS1199. x-axis: log10(Length), y-axis: PCC
We also want to know the performance with different secondary structure types. Figure 3 shows the results. The helical residues achieved the highest PCC value of 0.901, followed by the coiled residues, which achieved the PCC value of 0.891. In contrast, the hardest estimation RSA of the strand residues had the PCC of 0.845.
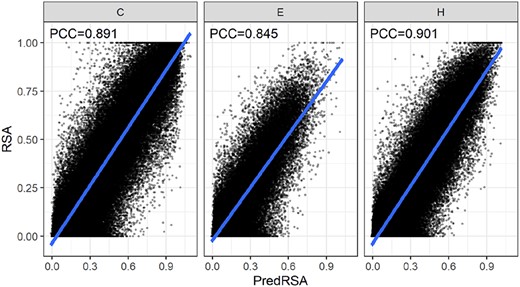
Different performances on residues with different secondary structures. C means Coil, E means strands, H means Helices
To analyze the different performances on the different SCOP families, average PCC values were computed on the test dataset SCOP499 (Table 4). It shows that the proposed method, EAGERER, achieved the highest PCC values on alpha/beta family protein; it indicates that the alpha/beta family protein is easy to predict RSA values. The following is the alpha + beta family. Alpha family protein is harder to predict than beta family protein. Table 4 also shows that the proposed method achieved a higher PCC on all proteins.
Average Pearson correlation coefficient values on the different SCOP family datasets SCOP499. The best result is marked with the bold font.
| Method | Alpha | Beta | Alpha/beta | Alpha+beta | All group |
|---|---|---|---|---|---|
| SphereCona | 0.895 | 0.895 | 0.896 | 0.896 | 0.896 |
| SphereConb | 0.915 | 0.917 | 0.919 | 0.917 | 0.917 |
| EAGERER | 0.927 | 0.932 | 0.946 | 0.937 | 0.936 |
| Method | Alpha | Beta | Alpha/beta | Alpha+beta | All group |
|---|---|---|---|---|---|
| SphereCona | 0.895 | 0.895 | 0.896 | 0.896 | 0.896 |
| SphereConb | 0.915 | 0.917 | 0.919 | 0.917 | 0.917 |
| EAGERER | 0.927 | 0.932 | 0.946 | 0.937 | 0.936 |
SphereCon: using only the Cα atom coordinates with a parameter -bb.
SphereCon using the Cα atom coordinates and amino acid type with a parameter -Ca.
3.5 Case study
To illustrate the utility of our method, we performed a case study using the protein (PDB ID: 1u07, Chain ID: A) with PCC 0.921, which is of the same quality as the average PCC on the test dataset TS1199. Figure 4 shows that the RSA values predicted by our method is well correlated with the actual RSA values.
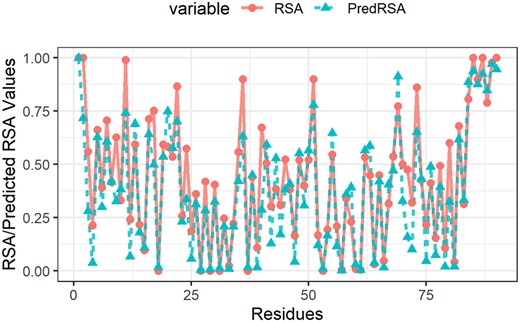
Actual RSA values (in red) and predicted RSA values (in blue) of protein ID (protein ID: 1u07 Chain ID: A)
4 Discussion
The SA is a key index to find the function of proteins. Several methods were proposed to estimate the SA. However, there are certain limitations in the practice. In this article, we proposed a novel method to estimate the RSA using the only Cα atom distance matrix and amino acid type.
The new method, EAGERER, was implemented using a deep learning method. To the best of our knowledge, it is the first method to estimate the SA using limited information with the deep learning model. The novel method achieved a higher Pearson correlation coefficient than other machine learning methods and other estimators of RSA, such as contact number (CN), half sphere exposed (HSE) and SphereCon on two test datasets. This method will be useful for estimating the accuracy of the protein structure and structure refinement.
The new method achieved the highest correlation on the alpha/beta family protein, and the lowest correlation on the alpha family protein. The algorithm benefits from the complexity of secondary structures than the monotonous secondary structures. We also noted that the new method achieved lower performance on proteins with short lengths. It may be caused by the features used. We only considered the 1D features, one-hot encoding and 2D features, residue–residue distance. The shorter proteins are too short to capture useful distances for our model. In the future, we will design a new model to improve the estimation of the RSAs for shorter proteins.
The variable size of the protein sequence is a big challenge for protein data learning using deep learning models. Our model was carefully designed to address this issue. In particular, the pooling layers in the CNN block in the algorithm were removed, while the output of the last residue block retained the same width and height. This provides a useful way to better deal with proteins of varying sizes to enable the deep learning network to mine the protein data.
The novel method is available at https://github.com/cliffgao/EAGERER.
Funding
This work was supported by the National Natural Science Foundation of China (NSFC) [11701296], the Natural Science Foundation of Tianjin [18JCQNJC09600], Key Laboratory for Medical Data Analysis and Statistical Research of Tianjin (KLMDASR), Natural Science Foundation Project of Hebei [F2019402078].
Conflict of Interest: The authors declared no conflicts of interests.
Data availability
All datasets are available at https://github.com/cliffgao/EAGERER.

