


Abstract
Identifying variant forms of gene clusters of interest in phylogenetically proximate and distant taxa can help to infer their evolutionary histories and functions. Conserved gene clusters may differ by only a few genes, but these small differences can in turn induce substantial phenotypes, such as by the formation of pseudogenes or insertions interrupting regulation. Particularly as microbial genomes and metagenomic assemblies become increasingly abundant, unsupervised grouping of similar, but not necessarily identical, gene clusters into consistent bins can provide a population-level understanding of their gene content variation and functional homology.
We developed GeneGrouper, a command-line tool that uses a density-based clustering method to group gene clusters into bins. GeneGrouper demonstrated high recall and precision in benchmarks for the detection of the 23-gene Salmonella enterica LT2 Pdu gene cluster and four-gene Pseudomonas aeruginosa PAO1 Mex gene cluster among 435 genomes spanning mixed taxa. In a subsequent application investigating the diversity and impact of gene-complete and -incomplete LT2 Pdu gene clusters in 1130 S.enterica genomes, GeneGrouper identified a novel, frequently occurring pduN pseudogene. When investigated in vivo, introduction of the pduN pseudogene negatively impacted microcompartment formation. We next demonstrated the versatility of GeneGrouper by clustering distant homologous gene clusters and variable gene clusters found in integrative and conjugative elements.
GeneGrouper software and code are publicly available at https://pypi.org/project/GeneGrouper/.
Supplementary data are available at Bioinformatics online.
1 Introduction
Physically proximate groups of genes, called gene clusters, are present in many microbial taxa (Medema et al., 2015). Gene clusters can include genes that form biosynthetic pathways or efflux, secretion or signaling systems, for example (Chen et al., 2020; Li et al., 2015; Medema et al., 2015; Price et al., 2006; Williams and Whitworth, 2010). Some gene clusters are arranged into one or multiple operons (Brandis et al., 2019). More broadly, microbial genomes are under constant gene flux, driven by gene gain, loss and rearrangements (Karcagi et al., 2016; Price et al., 2006; Tetz, 2005). The interaction of these two evolutionary forces makes identification of functional, conserved gene clusters across different genomes challenging, but when possible can allow for inferences of the gene cluster’s functionality, stability, phylogeny and taxonomic distribution (Axen et al., 2014; Brandis et al., 2019).
Several different, partially overlapping approaches have been used previously for the identification and classification of gene clusters. Generally, these identify one or more gene clusters either in single genomes (Cao et al., 2019; Martínez-García et al., 2015; Moller and Liang, 2017; Xie et al., 2018) or simultaneously in a set of genomes (Darling et al., 2010; Horesh et al., 2018; Medema et al., 2013; Svetlitsky et al., 2019; Tang et al., 2015; Veltri et al., 2016; Winter et al., 2016, 3). For the latter, some methods place gene clusters into bins demonstrating a baseline level of similarity (Cao et al., 2019; Svetlitsky et al., 2019; Winter et al., 2016) while others return homology scores relative to the query gene cluster (Horesh et al., 2018; Medema et al., 2013). A challenge when applying these methods to large numbers of gene clusters across multiple genomes is that many conserved gene clusters will display little variation in gene content, but that variation may nevertheless be biologically significant—for example, an insertion disrupting key genes in a biosynthetic operon (Brandis et al., 2019; Zangelmi et al., 2021). Existing approaches that search for a specific gene cluster architecture may miss these by penalizing insertions or deletions and not including functionally related gene clusters undergoing gene loss. Approaches that search for all gene clusters in a set of genomes prior to their binning, when only a handful of gene clusters are being investigated, may encounter issues with accuracy or scalability. These features have become especially important recently, since the number of microbial isolate genomes now exceeds 100 000, and that count is being rapidly overtaken by metagenomic assemblies (Pasolli et al., 2019).
A population-level understanding of gene cluster content can help to identify which genes are typically located in a gene cluster, and which are variable, providing hints as to their joint functionality. We thus developed GeneGrouper to identify, quantify, contextualize and visualize the degree of similarity for gene clusters that contain a queried gene of interest in a (potentially large) population of user-supplied genomes. It is designed to work on many thousands of genomes and is suitable for use, even at scale, on a personal computer.
We demonstrate the utility of GeneGrouper by comparing its unsupervised clustering accuracy with existing tools in the identification of two distinct gene clusters, the 23-gene catabolic microcompartment Pdu gene cluster found in Salmonella enterica LT2 and the four-gene MexR/MexAB-OprM Resistance–Nodulation–Division (RND)-type efflux pump gene cluster from Pseudomonas aeruginosa PAO1 in 435 genomes (Cheng et al., 2011; Poole et al., 1996). These genomes were drawn from six taxa: S.enterica, P.aeruginosa, Klebsiella pneumoniae, Citrobacter, Enterobacter and Clostridium. Taxa were selected based on prior evidence for carriage of either LT2 Pdu or PAO1 Mex gene clusters, or unrelated gene clusters with multiple homologs to either pduA and/or mexB (Axen et al., 2014; Connolly et al., 2018; Kalnins et al., 2020; Li et al., 2015). The LT2 Pdu gene cluster was selected to test whether GeneGrouper could detect and accurately bin a large gene cluster that contains multiple paralogs (i.e. pduA, pduJ and pduT), present in multiple phylogenetically distinct genomes (i.e. S.enterica, K.pneumoniae and Citrobacter) while avoiding the inclusion of other separate microcompartment gene clusters present in all six genera that share some orthologs (Axen et al., 2014; Connolly et al., 2018; Kalnins et al., 2020). The PAO1 Mex gene cluster (mexR, mexA, mexB and oprM) encodes for a regulator and an RND efflux pump that has multiple homologs present within a genome and across virtually all Gram-negative species (Li et al., 2015). The PAO1 Mex gene cluster is distinguished by its MarR-type proximal repressor, MexR, in P.aeruginosa. The PAO1 Mex gene cluster was selected to test whether GeneGrouper could specifically detect a short gene cluster with multiple homologs within a species, and across all five Gram-negative taxa in our collection of genomes.
After benchmarking, GeneGrouper was used to examine the diversity and distribution of gene-complete and -incomplete LT2 Pdu gene clusters in 1130 S.enterica genomes. Using GeneGrouper’s visual and tabular outputs, we identify a novel pseudogene present in a subset of otherwise gene-complete LT2 Pdu gene clusters. This pseudogene was validated in vivo, with its loss of functionality negatively impacting microcompartment formation.
2 Implementation
GeneGrouper is written in Python 3 and uses the Biopython and scikit-learn libraries for sequence processing, clustering and analysis (Buitinck et al., 2013; Cock et al., 2009). Multithreading is implemented via the multiprocessing library (McKerns et al., 2012). GeneGrouper calls on BLAST+, mmseqs2-linclust and MCL for sequence detection and orthology clustering (Camacho et al., 2009; Enright et al., 2002; Steinegger and Söding, 2017). Visualizations are generated using R packages gggenes and ggtree (Wilkins and Kurtz, 2020; Yu et al., 2017).
2.1 Input and pre-processing
GeneGrouper requires two inputs: genome files and a translated seed gene sequence (Fig. 1A and B). Genome files must be in GenBank file format like those from the NCBI Refseq database (O’Leary et al., 2016). All genome files have coding sequence features extracted and stored in an SQLite database. A BLAST database is constructed from all extracted amino acid sequences.
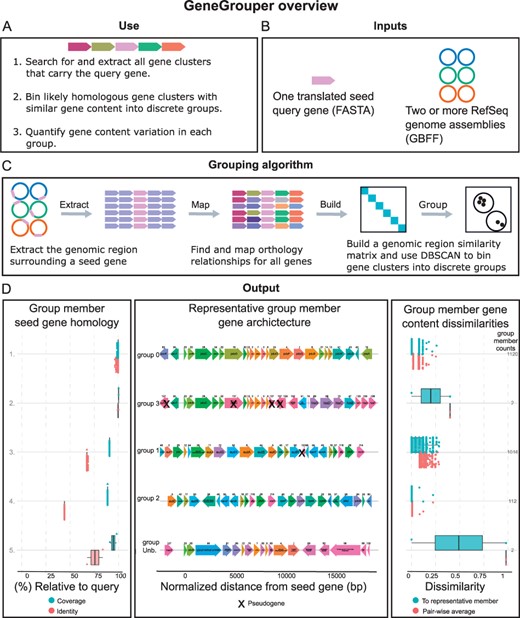
Overview of the GeneGrouper algorithm for gene cluster identification and grouping. (A, B) Basic operation of GeneGrouper, which uses a specified gene seed to query all related clusters from a set of microbial genomes and bin them into homologous groups. (C) GeneGrouper algorithm overview for gene cluster grouping. The genomic region surrounding the seed gene is extracted, and all genes within the region are mapped to their orthologous families. Orthology results are in turn mapped back to all genes, on which the DBSCAN algorithm is run to identify groups of similar gene clusters across genomes by Jaccard dissimilarity. (D) Overview of GeneGrouper results, using the LT2 Pdu gene cluster search in 1130 S.enterica genomes with PduA as the query. Four groups of gene clusters are generated (labeled 0–3). The main output consists of three parts. The left panel shows the seed gene coverage and amino acid identity of each member of that group relative to the initial translated query gene. The middle panel shows the representative architecture of each GeneGrouper group (anchored on the start of each seed gene homolog). ‘Group Unb.’ contains all gene clusters that DBSCAN leaves unbinned into any discrete group. Genes are shown with RefSeq gene name, or product annotation if this is not available. Numbers above genes indicate internal ortholog family identifiers. The right panel shows the Jaccard dissimilarity of each group's members. Dissimilarities are presented for each member relative to the group representative shown in the middle panel, and also its average pair-wise dissimilarity to all other members in the group. On the right-hand side of the right panel are the counts of all members that belong to that group
2.2 Seed homology searching
A BLASTp search for the translated seed gene is performed using user-specified identity and coverage thresholds (default 60% identity and 90% coverage), with higher values of either corresponding to stricter homology requirements (Fig. 1C). The genomic region surrounding the seed gene (default 10 000 bp upstream and downstream) is extracted. Users have the option to provide their own upstream/downstream values to select for distances that specifically encompass the gene cluster of interest. In instances where extracted regions overlap, the region with the lowest E-value is chosen. The genomic position of hits and the amino acid sequences within the defined genomic region are written to a seed gene-specific SQLite database. All sequences within the defined genomic region are stored as a FASTA file.
2.3 Orthology inference and assignment
GeneGrouper assigns orthology to all sequences extracted from the defined genomic region using a standard all-versus-all BLAST search followed by Markov graph clustering of E-values (Bayliss et al., 2019; Emms and Kelly, 2019; Hu and Friedberg, 2019; Li et al., 2003). Specifically, during the pre-processing phase, amino acid sequences are clustered using mmseqs2 linclust to generate a set of representative amino acid sequences in FASTA format (Steinegger and Söding, 2018). An all-versus-all BLAST search, where each representative amino acid sequence is BLAST-ed against every other representative amino acid sequence to produce an E-value, is performed. The resulting E-values are then used as input for Markov graph clustering with MCL (Enright et al., 2002). MCL is run over multiple inflation values, a parameter that impacts the granularity of inferred orthologous sequence clusters (Enright et al., 2002; Li et al., 2003). Increasing inflation values will typically yield more clusters with fewer numbers of sequences. GeneGrouper selects the lowest inflation value containing the highest count of unique orthologous sequence clusters by default. The MCL and mmseqs2 linclust ortholog cluster assignments are transferred to every sequence and stored (Fig. 1C).
2.4 Genomic region grouping
Pair-wise Jaccard distances of gene content are calculated for all genomic regions (Fig. 1C) (Buitinck et al., 2013). The DBSCAN algorithm is then run using a fixed minimum cluster size value over increasing epsilon values, which specify the radius of the cluster undergoing expansion (Ester et al., 1996). For each epsilon value, the number of clusters, noise, silhouette score and Calinksi-Harabasz score are calculated (Caliński and Harabasz, 1974). The epsilon value demonstrating the best separation of clusters (defaulting to the highest Calinksi-Harabasz score) is selected. The previously constructed Jaccard distance matrix is subsetted for genomic regions within each DBSCAN cluster (hereon referred to as groups and specified with the prefix ‘group’). The pair-wise mean dissimilarity for each member of a group is calculated. Within each group, the member with the lowest pair-wise mean dissimilarity is selected as the group representative.
2.5 Outputs
Tabular outputs containing the group, region identifier, mean group dissimilarity and relative dissimilarity to the group representative are generated. All gene regions that could not be assigned to any group are placed in group ‘un-binnable’. Three main visualizations are produced: the gene cluster architecture for each group representative along with population-level metadata (Fig. 1D), the percentage of genomes with at least one gene cluster in a per group, and the number of genomes searched and the number of genomes with at least one gene cluster total. For each group, users can generate an additional visualization that displays the count, dissimilarity and structure of each unique gene cluster architecture within that queried group (Supplementary Fig. S3). A phylogenetic tree containing each group’s representative seed sequence can also be produced. This output uses MAFFT followed by FastTree to create a phylogenetic tree and ggtree for visualization (Katoh and Standley, 2013; Paradis and Schliep, 2019; Price et al., 2010; Revell, 2012; Yu et al., 2017). Each tip label is annotated with the group identifier.
3 Experimental methods
3.1 Bacterial strain generation
Modifications to the Pdu operon of S.enterica serovar Typhimurium LT2 were made using the λ Red recombineering method developed by Thomason et al. (2014). In this method, a cat/sacB selectable insert is PCR amplified containing upstream and downstream homologous overhangs corresponding to the target gene locus. The selectable marker is inserted into the desired locus and subsequently knocked out, as in the case of the ΔA ΔJ double knockout strain and ΔN single knockout strain, or replaced with a modified open reading frame, as in the case of the ΔN::N* frameshift mutation. Note that for the ΔN::N* frameshift, a gBlock Gene Fragment from IDT was used. For gene knockouts, 30 bp is left upstream of the downstream open reading frame to avoid polar effects. All knockouts and modifications were sequence verified using Sanger sequencing performed by Quintara Biosciences.
3.2 GFP encapsulation assay
To visualize changes to microcompartment formation and morphology, a GFP encapsulation assay was used as previously described (Nichols et al., 2019). Modified S.enterica serovar Typhimurium LT2 were transformed with an inducible fluorescent reporter construct, pBAD33t-ssD-GFPmut2. This plasmid contains an open reading frame that has an N-terminal signal sequence sufficient for targeting the fluorescent reporter, GFPmut2, to the lumen of microcompartments. Transformed strains were first streaked from glycerol stocks to single colonies on LB plates supplemented with 34 µg/ml chloramphenicol (incubated at 37°C for 16 h after streaking). Single colonies were selected and used to inoculate 5 ml LB liquid cultures supplemented with 34 µg/ml chloramphenicol, which were grown for 16 h at 37°C, 225 RPM. These starter cultures were subsequently used to subculture 5 ml LB expression cultures supplemented with 34 µg/ml chloramphenicol, 0.02% (w/v) L-(+)-arabinose and 0.4% (v/v) 1,2-propanediol. Expression cultures were grown for 6 h at 37°C, 225 RPM before imaging.
Cells were imaged using phase contrast and fluorescence microscopy on a Nikon Eclipse Ni-U upright microscope, 100X oil immersion objective, Andor Clara digital camera and NIS Elements Software (Nikon). Cells were prepared by placing 1.47 µL of the expression culture onto FisherbrandTM frosted microscope slides and cleaned 22 mm × 22 mm, #1.5 thickness coverslips (VWR Cat# 16004-302). For GFP fluorescence micrographs, the C-FL Endow GFP HYQ bandpass filter was used and images were acquired with an 80 ms exposure. Digital micrographs were processed using ImageJ (Schneider et al., 2012).
4 Results and discussion
4.1 GeneGrouper benchmarking and comparisons overview
Two separate analyses were performed to benchmark GeneGrouper. In the first analysis, GeneGrouper, MultiGeneBlast and CSBFinder were used to search for two gene clusters: the 23-gene LT2 Pdu and four-gene PAO1 Mex gene clusters (Fig. 2A, Table 1) in a set of 435 genomes drawn from six taxa (Supplementary Table S1). For each tool, each gene cluster was manually labeled for being either gene-complete (100% of expected genes present in the gene cluster), gene-incomplete (<100–75% genes present) or ‘unrelated’ (<75% genes present), to the query gene cluster architecture. Afterwards, the overlaps and discrepancies in gene clusters identified were examined. In the second analysis, the number of complete, incomplete or unrelated LT2 Pdu or PAO1 Mex gene clusters in each of GeneGrouper’s groups was manually calculated to verify that groups were composed of gene clusters with similar gene content. Afterward, we used GeneGrouper’s automated grouping as predictors for whether genomes were carrying complete or either complete or incomplete LT2 or PAO1 Mex gene clusters. The precision and recall of these predictions were compared with the manually obtained complete, incomplete and unrelated labelings from the first analysis. Overall, we find the accuracy of predictions made by GeneGrouper’s unsupervised classifications is comparable to or greater than those obtained using manual classification methods with existing tools.
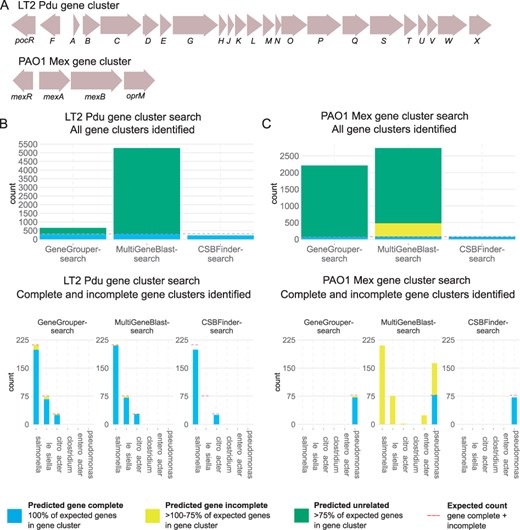
GeneGrouper cluster search and completeness comparisons with alternative approaches. (A) The canonical LT2 Pdu and PAO1 Mex gene cluster architectures used for precision and recall comparisons. Single letter abbreviations indicate a pdu prefix. (B, C) The counts of all gene clusters identified by each evaluated search method for these two gene clusters. Red dashed line indicates the expected counts of complete and incomplete gene clusters in the dataset. (D, E) Counts of all gene clusters identified by each search method, separated by taxa. Red line is again the expected count (per taxon, when greater than zero)
Genes, and the gene clusters they represent, used for gene cluster searches and comparisons in this study
| Gene name | Species | Gene cluster namea | Gene cluster length | Accessionb |
|---|---|---|---|---|
| pduA | Salmonella enterica | LT2 Pdu | 23 | P0A1C7 |
| mexB | Pseudomonas aeruginosa | PAO1 Mex | 4 | P52002 |
| pstS | Escherichia coli | Pst | 5 | P9WGU1 |
| traC | Salmonella enterica | T4SS | 15 | P18004 |
Internal gene cluster name used.
UniProt accession ID.
4.2 Comparison of LT2 Pdu and PAO1 Mex gene cluster identification using different tools
435 chromosomal-level assembly genomes drawn from S.enterica, K.pneumoniae, P.aeruginosa, Citrobacter, Enterobacter and Clostridium were downloaded from the NCBI Refseq database on March 23, 2021 (Supplementary Table S1) (O’Leary et al., 2016). These taxa were selected based on prior evidence for carriage of either LT2 Pdu or PAO1 Mex gene clusters, or unrelated gene clusters with multiple homologs to either pduA and/or mexB (Axen et al., 2014; Li et al., 2015). The high assembly quality was chosen to minimize the chance of detecting genes or gene clusters or incomplete gene clusters resulting from incorrect assemblages or fragmentation. For the detection of the LT2 Pdu gene cluster, GeneGrouper was run using the translated S.enterica LT2 PduA sequence as a seed, and a genomic search space of 2000 bp downstream and 18 000 bp upstream that encompassed the two genes downstream and 22 genes upstream of pduA. PduA was selected as the seed because it is a member of the pfam00936 protein family, which is the hallmark indication of BMC (bacterial microcompartment) loci (Axen et al., 2014). For the detection of the PAO1 Mex gene cluster, the P.aeruginosa PAO1 MexB sequence was used as a seed with a uniform search space of 3000 bp upstream and downstream to capture all genes upstream and downstream of mexB while allowing for potential insertions. For both searches, a ≥30% identity and ≥80% coverage threshold was used to capture potentially distant functional seed homologs. The orthology assignments for each gene in the LT2 Pdu or PAO1 Mex gene clusters were then used to score a gene cluster's completeness relative to the orthology assignments of the LT2 Pdu gene cluster from S.enterica LT2 (GCF_000625775) or the PAO1 Mex gene cluster from P.aeruginosa PAO1 (GCF_000148745).
MultiGeneBlast was run in search mode with default settings on each individual genome, using an input FASTA file that contained all the translated gene sequences belonging to either LT2 Pdu or PAO1 Mex gene clusters. BLAST results for each identified gene cluster were filtered such that each individual query gene was matched to its single best hit. Each gene cluster was then scored for completeness as above.
CSBFinder inputs were pre-processed prior to gene cluster searching, as required by its implementation. The proteomes for all six taxa were generated by clustering with mmseqs2 linclust with default settings (Steinegger and Söding, 2018). Afterwards, orthology identification was performed using OrthoFinder with default settings (Emms and Kelly, 2019). Genomes with orthology assignments were then converted into the CSBFinder format. The orthology assignments for each gene present in either the LT2 Pdu or PAO1 Mex gene clusters were converted to a ‘patterns’ file and used to search all genomes for the respective gene clusters using default settings and then scored for completeness as above.
The expected total count of predicted complete and incomplete LT2 Pdu gene clusters (316) was based on prior evidence for their existence as a single copy in S.enterica, K.pneumoniae and Citrobacter spp. (Fig. 2B). Between all three approaches, 224–308 complete and 5–20 incomplete LT2 Pdu gene clusters were predicted (Fig. 2D) (Axen et al., 2014). Complete LT2 Pdu gene clusters were predicted in 93.8–99% of S.enterica, 89.2–96.4% of Citrobacter spp. and 0–93.4% K.pneumonia genomes. GeneGrouper and MultiGeneBlast had comparable predicted counts of complete and incomplete LT2 Pdu gene clusters, with GeneGrouper identifying fewer complete and more incomplete LT2 Pdu gene clusters. CSBFinder had the most conservative results and did not identify any K.pneumoniae genomes carrying an LT2 Pdu gene cluster.
We next searched the same set of genomes for the presence of the PAO1 Mex efflux pump operon and its proximal regulator, MexR. The expected total count (78) was based on prior evidence, where it is expected to be present in a single copy in only and all P.aeruginosa genomes (Li et al., 2015). All approaches predicted between 92.3% and 100% of P.aeruginosa genomes to carry the PAO1 Mex gene cluster, with no other taxa predicted to carry the complete gene cluster (Fig. 2C and E). CSBFinder only identified complete gene clusters. GeneGrouper identified three incomplete PAO1 Mex gene clusters, all in P.aeruginosa. MultiGeneBlast identified 397 incomplete PAO1 Mex gene clusters, distributed throughout P.aeruginosa, S.enterica, K.pneumoniae, Citrobacter and Enterobacter.
Our standardized labeling method for qualifying complete/incomplete/unrelated LT2 Pdu or PAO1 Mex gene cluster showed all tools compared similarly in the counts of predicted complete gene clusters. CSBFinder reported lower numbers of complete or incomplete gene clusters in phylogenetically distant genomes. This is likely due to conservative orthology assignments in its pre-processing step using OrthoFinder. MultiGeneBlast had higher numbers of incomplete gene clusters detected for PAO1 Mex gene clusters. This discrepancy is likely attributable to the BLAST-based scoring system that predicts a gene hit regardless of identity and coverage, resulting in potential pseudogenes counting toward a gene cluster’s completeness metric. Taken together, these results demonstrate that GeneGrouper’s gene cluster search method identifies gene clusters that are either complete or incomplete gene clusters in the range of the expected count.
4.3 Accuracy of GeneGrouper automated gene cluster binning
GeneGrouper uses an unsupervised learning approach to aggregate each individual gene cluster into discrete groups. Each group should contain gene clusters that have similar, but not necessarily solely identical, gene content, over the inputted upstream/downstream bp distance. Therefore, a group will likely contain both complete and incomplete gene clusters, but not unrelated gene clusters as those will be assigned their own group(s). We tested whether this was the case by identifying the distribution of gene complete, incomplete or unrelated gene clusters in all groups. We then compared the accuracy of the automated labeling with that of the manual labeling of gene clusters using the GeneGrouper, MultiGeneBlast and CSBFinder search outputs.
The LT2 Pdu gene cluster was searched for in all genomes with GeneGrouper using the same parameters as before. GeneGrouper assigned 654 gene clusters to four different groups and had 15 gene clusters that were un-binnable and placed in group ‘Unb’ (group un-binnable) (Table 2, Supplementary Fig. S1A and B). The completeness of each gene cluster for the LT2 Pdu gene cluster was assessed as before. When separated by group assignment, all complete and incomplete LT2 Pdu gene clusters, but no unrelated gene clusters, were placed in group 0 (Fig. 3A). We calculated the accuracy of using gene clusters from GeneGrouper group 0 for predicting the presence of complete, or either complete or incomplete, LT2 Pdu gene clusters in all 435 genomes. This was done by labeling all gene clusters in group 0 as true for being complete, or either complete or incomplete, and measuring the precision and recall compared to a ground truth dataset. For comparative purposes, the precision and recall for the manually labeled GeneGrouper, MultiGeneBlast and CSBFinder search outputs, that include all detected gene clusters from each search output, was also measured (Fig. 3C).
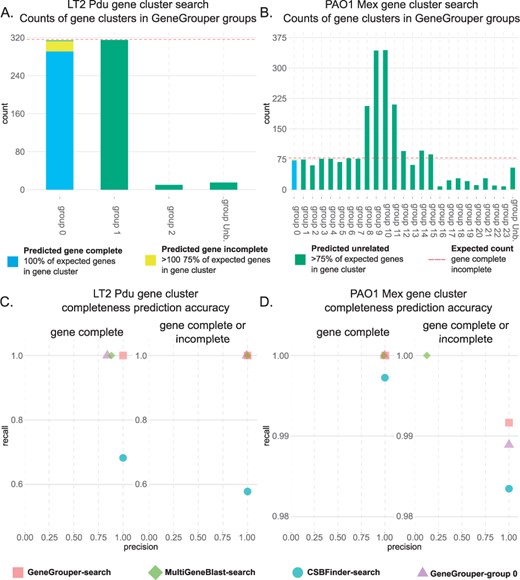
GeneGrouper unsupervised gene cluster grouping accuracy. (A, B) Counts of gene clusters identified by GeneGrouper separated by assigned groups. Red dashed line indicates the expected counts of complete and incomplete gene clusters in the dataset. (C, D) Precision and recall scores for all methods evaluated. The ‘search’ suffix indicates that each individual gene cluster was manually labeled for completeness prior to comparison with ground truth dataset. The GeneGrouper-group 0 method labeled all gene clusters within that group as true for being complete, or either complete or incomplete, prior to comparison with ground truth dataset
Search parameters and processing time for all GeneGrouper gene cluster searches in this study
| Gene cluster namea | Upstream–Downstream search length (bp) | Seed identity (%)/coverage (%)/hit count | Total gene clusters found | Total groups | Total unclustered gene clusters | Genomes with hit | Dataset | Run time (h:m:s)b,c |
|---|---|---|---|---|---|---|---|---|
| LT2 Pdu | 2000–18 000 | 30/80/unlimited | 654 | 4 | 15 | 324 | 435 mixed genomes | 00:01:48 |
| PAO1 Mex | 3000–3000 | 30/80/unlimited | 2214 | 24 | 54 | 423 | 435 mixed genomes | 00:03:22 |
| Pst | 8000–8000 | 15/70/1 | 394 | 5 | 16 | 394 | 435 mixed genomes | 00:00:54 |
| T4SS | 20 000–20 000 | 15/70/unlimited | 81 | 3 | 26 | 59 | 435 mixed genomes | 00:00:37 |
| LT2 Pdu | 2000–18 000 | 30/80/unlimited | 2252 | 4 | 2 | 1128 | 1130 Salmonella genomes | 00:04:12 |
Internal gene cluster name used.
hours:minutes:seconds.
Run on a 2.2Ghz Intel i7 quad core processor with 16 Gb of DDR3 RAM.
GeneGrouper group 0 showed high precision and recall for prediction of complete or either complete or incomplete LT2 Pdu gene clusters. The precision was lower for the prediction of only complete LT2 Pdu gene clusters compared with complete or incomplete gene clusters. This was expected as GeneGrouper’s grouping method placed gene complete and incomplete LT2 Pdu gene clusters into the same group. MultiGeneBlast demonstrated similar recall scores but over-predicted the number of complete LT2 Pdu gene clusters, resulting in a lower precision score. CSBFinder had high precision but lower recall due to a lack of detection of true LT2 Pdu gene clusters in all K.pneumoniae genomes in the dataset. Taken together, these results demonstrate GeneGrouper’s automated grouping method can accurately bin related complete and incomplete gene clusters into discrete groups.
PAO1 Mex gene clusters were searched for using GeneGrouper as previously described, identifying 2214 gene clusters contained within 25 groups (Table 2, Supplementary Fig. S2A and B). All gene clusters were labeled as predicted complete, incomplete or unrelated. When separated by group assignment, results showed that group 0 contained all complete and incomplete, but no unrelated, gene clusters (Fig. 3B). The sole exception was a predicted incomplete PAO1 Mex gene cluster placed in group ‘Unb’ containing other un-binnable gene clusters. The precision and recall for GeneGrouper group 0 in predicting complete or either complete or incomplete PAO1 Mex gene clusters was measured as previously described (Fig. 3D). Precision and recall were greater or equal to 0.98 for both categories, with GeneGrouper group 0 missing four instances of true incomplete PAO1 Mex gene clusters. The first was in ‘gUnc’, which had a truncated mexR, and the other three had a mexB pseudogene and were thus not detected during the initial BLAST search. Other tools performed similarly. A notable exception was the 0.12 precision score for the prediction of gene complete or either gene complete or incomplete PAO1 Mex gene cluster by MultiGeneBlast. This low score is likely to due to difficulties in homology score-based methods in differentiating between closely related, but distinct gene clusters, when all components are not present. These results indicate the GeneGrouper grouping assignments can differentiate between highly similar gene content and identify specific RND efflux pump components.
4.4 Application: distribution and diversity of full and partial Pdu gene clusters in S.enterica
Although S.enterica is known to carry the LT2 Pdu gene cluster, it is unclear how full and partial LT2 Pdu gene clusters are distributed within the species, and whether unique insertions, deletions or outright losses of the gene cluster have occurred and propagated. This is of interest because even in the presence of interruptions, functional LT2 Pdu gene cluster variants may still exist, and these disruptions can thus inform as to which genes may not be necessary. We used GeneGrouper to search for the LT2 Pdu gene cluster in 1130 complete or chromosomal-level genome assemblies from the RefSeq database downloaded on March 23, 2021 (Supplementary Table S2) (30). The S.enterica LT2 PduA sequence was used as a seed to search and cluster the gene content for a genomic region of 2000 bp downstream and 18 000 bp upstream of any pduA homolog (Table 2).
The search returned four distinct groups with distinct gene clusters and two total unclustered gene clusters, which were visualized using GeneGrouper’s visualization command (Fig. 1B). GeneGrouper reports the Jaccard dissimilarities of each region within a cluster relative to the region representative so that differences in gene content can be efficiently quantified and assessed. Group 0 contained the S.enterica LT2 strain LT2 Pdu gene cluster, which had zero dissimilarity with the representative region of the cluster. In total, this cluster contained 1120 regions with a 0 and 0.076 Jaccard dissimilarity at the 50th and 95th percentiles, respectively. These low dissimilarities indicated that group 0 had very little variation in gene content relative to its representative region.
To examine the variability in gene content within group 0, GeneGrouper’s group inspection command was run to visualize the count of identical occurrences of each gene cluster (Supplementary Fig. S3A and B). Thirty-five separate identical gene clusters were present, the majority of which had all 23 LT2 Pdu genes. The tabular output was queried to reveal that of all gene clusters identified, 920 (81.4%) carried all 23 LT2 Pdu genes, 10 (0.88%) did not have a LT2 Pdu gene cluster identified, and the remaining 200 (17.6%) had predicted LT2 Pdu gene clusters with between one and five pseudogenes. Interestingly, gene clusters carrying a pduN pseudogene but otherwise complete were the most common incomplete gene cluster observed (Fig. 4A).
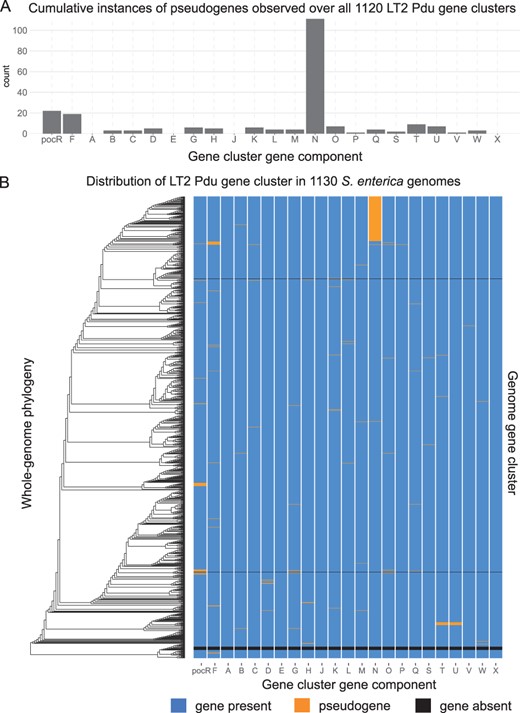
Whole-genome phylogenomic analysis of LT2 Pdu gene cluster completeness in 1130 S.enterica genomes. (A) Cumulative count of pseudogene occurrences identified by GeneGrouper in 1120 LT2 Pdu gene clusters. PduN had a particularly high frequency of pseudogene occurrence. (B) Comparison of these genomes' whole-genome phylogeny (as determined by PhyloPhlAn 3.0 using the provided 400 gene marker database) with LT2 Pdu gene cluster composition and completeness in each genome
To examine the phylogenetic relationships between genomes and pduN pseudogene carriage, a whole-genome phylogeny of all 1130 genomes was created using PhyloPhlAn 3.0 and the provided 400 marker gene database. The resulting tree was visualized with ggtree along with a heatmap for each Pdu component extracted from GeneGrouper’s tabular output (Asnicar et al., 2020; Yu et al., 2017). We found that genomes with pduN pseudogenes were present almost entirely in the same section of the phylogenetic tree (Fig. 4B). This is a surprising finding, as PduN is a necessary component for proper Pdu microcompartment formation (Cheng et al., 2011). PduN is a member of the BMC vertex protein family (pfam03319), which are necessary for capping the vertices of BMCs and imparting the standard polyhedral morphology (Cheng et al., 2011; Tanaka et al., 2008; Wheatley et al., 2013). Absence of PduN leads to malformed and elongated microcompartment structures and disrupted growth on the substrate 1,2-propanediol (Cheng et al., 2011). The pduN mutation found in strain S.enterica Ty2 (GCF_000007545.1) contained a nucleotide deletion at position 68 that resulted in a frame-shift mutation (Supplementary Fig. S4).
The effects of this nucleotide deletion on microcompartment formation were tested in S.enterica LT2. To determine the effect of the PduN frameshift and resulting pseudogene seen in our analysis, strains containing this frameshift (denoted ΔN::N*) were generated and compared with strains containing the intact Pdu gene cluster (WT), a full PduN deletion (ΔN) and a negative control lacking the essential pfam00936 genes pduA and pduJ (ΔAΔJ) (Fig. 5) (Kennedy et al., 2021). Microcompartment formation was tested using a GFP encapsulation assay, in which GFP is targeted to microcompartments using an N-terminal signal sequence sufficient for microcompartment targeting (Fan and Bobik, 2011; Nichols et al., 2020). We found that strains expressing the pduN pseudogene (ΔN::N*) exhibited aberrant microcompartment morphologies similar to those observed in the pduN knockout strain (ΔN), indicating improper microcompartment assembly due to a loss of vertex capping. This phenotype is distinct from the bright fluorescent puncta throughout the cytoplasm in the WT strain, indicative of normal microcompartment assembly and morphology, as well as the ΔAΔJ negative control containing polar bodies, indicative of aggregation. These results demonstrate the utility of GeneGrouper in rapidly identifying pseudogenes that dramatically alter the functionality of BMC gene clusters.
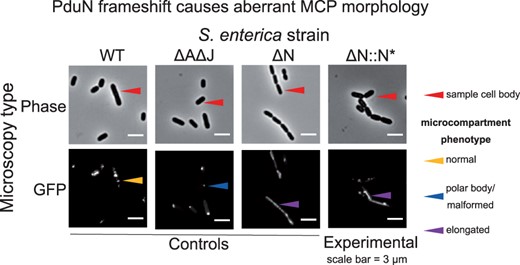
pduN pseudogene results in aberrant microcompartment morphology. Phase contrast and GFP fluorescence microscopy images of various Salmonella strains expressing ssD-GFP (GFP tagged with the signal sequence from PduD). Row labels indicate micrograph type, and column labels indicate bacterial strain. GFP fluorescence images depict fluorescent, cytosolic puncta indicative of microcompartments (MCP) in the wild-type (WT) strain. Fluorescent polar bodies in the pduA pduJ double knockout strain (ΔA ΔJ) indicate improper compartment formation. Elongated fluorescent structures in the pduN knockout (ΔN) and pduN frameshift (ΔN::N*) indicate improper vertex capping
4.5 Additional gene cluster searches using GeneGrouper
To demonstrate the applicability of GeneGrouper to other gene cluster types and use cases, we searched for two additional seed genes in our dataset of 435 genomes (Tables 1 and 2). The Pst gene cluster (pstSCAB) which regulates the uptake of inorganic orthophosphate (Mandal and Kwon, 2017) is present in many Gram-negative and positive bacteria. It encodes for a four-component phosphate ABC-transporter and is adjacent to the negative phosphate regulon regulator, phoU (Fischer et al., 2006). GeneGrouper was used to investigate whether distant or proximal homologs of the Escherichia coli Pst gene cluster were present in the dataset. Identity and coverage cutoffs of 15% and 70%, respectively, were used to detect distant seed homologs, and an upstream/downstream distance of 8000 bp was selected to encompass all expected members of the Pst gene cluster and possible insertions (Table 2). Only the best BLAST hit from each genome was kept.
A total of 394 gene clusters were found and subsequently binned into five groups (Supplementary Fig. S5A and B). Interestingly, S.enterica, K.pneumoniae and Enterobacter spp. had similar gene cluster architectures, even between groups, with the main difference being upstream gene content. This likely drove their binning into different groups as the core Pst gene cluster content was identical. Interestingly, the Pst gene cluster has been described in Clostridium and verified to be an ortholog of the E.coli Pst gene cluster (Fischer et al., 2006). In this search, only one Clostridium genome had a Pst gene cluster identified and (uniquely) left unclustered, suggesting that the Pst gene cluster may not be carried by all Clostridium. Another unexpected finding was that only 62.8% of P.aeruginosa genomes carried a homolog of pstS in a conserved gene cluster assigned to group 0. However, gene clusters in this group lacked other members of Pst and instead were associated with type II secretion genes. This context suggests that the pstS gene in group 0 may serve a different functional role compared pstS found in the functionally verified Pst gene cluster in E.coli (Korotkov et al., 2012; Sun et al., 2016).
In another example use case, we searched for gene clusters containing traC, a type IV secretion system (T4SS) gene found in integrative and conjugative elements (ICEs) (Table 2) (Beker et al., 2018). ICEs have highly variable gene content across both cargo genes and the components necessary for integration and conjugation (Johnson and Grossman, 2015; Wallden et al., 2010). A 20 000 upstream/downstream genomic range was used, which is on the lower end of ICE sizes (shown to range in size from 37 to 143 kb) to capture conserved conjugation components (Liu et al., 2019). Clustering returned 81 separate gene clusters binned in three different groups, and 26 gene clusters left unassigned (Supplementary Fig. S6A and B). Expectedly, there was high dissimilarity within groups, as transferred ICE are hotspots of gene gain, loss and recombination (McFarland et al., 2021; Oliveira et al., 2017). One group, group 1, exhibited low mean dissimilarity and was present in both S.enterica and K.pneumoniae genomes, suggesting these genomes carry the same ICE. Group 0 was found in 46% of all K.pneumoniae genomes, raising the possibility of a particular mobile or ancient ICE acquisition. These search results demonstrate the utility of GeneGrouper in understanding genomic regions with highly variable gene content.
5 Conclusions
We demonstrate that GeneGrouper is a simple and accurate tool for identifying gene clusters containing a common gene in a large number of genomes and binning them into discrete, relevant groups. GeneGrouper’s automated grouping of gene clusters showed high precision and recall for the prediction of gene complete and incomplete LT2 Pdu and PAO1 Mex gene clusters and performed similarly to or better than existing tools. An advantage of GeneGrouper’s output is that gene clusters with similar, but not necessarily exact, gene content are grouped together, allowing for population-level comparisons of similar gene clusters. This feature allows to better understand and contextualize the combination of ancestral and fixed, versus recent or neutral, variation in a gene cluster of interest across the microbial tree of life.
In an example application, GeneGrouper was used to determine whether the LT2 Pdu gene cluster was present in 1130 complete S.enterica genomes and, if so, how complete the gene cluster was. Analysis of GeneGrouper groups showed incomplete LT2 Pdu gene clusters most commonly contained pduN pseudogenes, compared with the other 22 components of the gene cluster. We further probed the consequences of pseudogene formation in pduN and found that the pduN pseudogene results in formation of distinct, aberrant microcompartment structures similar to those observed in a pduN knockout strain. This was surprising given PduN’s necessary role in microcompartment formation (Cheng et al., 2011), and the potential 1,2-propanediol catabolic capacity of strains with pduN pseudogenes warrants further investigation.
There exist some limitations in our approach, primarily the guaranteed absence of gene clusters that do not have the seed gene and the presence of incomplete gene clusters from genomes with fragmentary assemblies. In addition, some genomic regions that contain the gene cluster but have dissimilar surrounding gene content can be binned into different groups if the genomic distance is too high. In this case, user-guided refinement of the upstream/downstream search distance to more specifically encompass the desired gene cluster can solve this issue. Despite these limitations, GeneGrouper’s automated binning provides users with biologically relevant groups of similar gene clusters in minutes (Table 2), much faster than existing tools and with similar or higher accuracy. GeneGrouper’s comparative approach to gene cluster analysis has the potential to save time in situations where researchers are choosing model gene clusters and want to determine which genes are typically present. This can help to prevent erroneous conclusions if studies are performed on a gene cluster containing unique genetic features compared with its homologs across a microbial population. GeneGrouper can also help to identify unusual gene content in similar gene clusters for further investigation of these variants' functional consequences.
Acknowledgements
The authors extend our gratitude to all users that helped test GeneGrouper. This research was supported in part through the computational resources and staff contributions provided for the Quest high performance computing facility at Northwestern University which is jointly supported by the Office of the Provost, the Office for Research, and Northwestern University Information Technology.
Funding
This work was supported by the Searle Leadership Fund (E.M.H.), Biotechnology Training Program (A.G.M.); Army Research Office [W911NF-19-1-0298 to D.T.-E.]; National Science Foundation Graduate Research Fellowships Program [DGE-1842165 to N.W.K.]; and National Institute of Health, National Institute of Diabetes and Digestive and Kidney Diseases [R24DK110499 to C.H.].
Conflict of Interest: none declared.

