


Abstract
The hourglass model is a popular evo-devo model depicting that the developmental constraints in the middle of a developmental process are higher, and hence the phenotypes are evolutionarily more conserved, than those that occur in early and late ontogeny stages. Although this model has been supported by studies analyzing developmental gene expression data, the evolutionary explanation and molecular mechanism behind this phenomenon are not fully understood yet. To approach this problem, Raff proposed a hypothesis and claimed that higher interconnectivity among elements in an organism during organogenesis resulted in the larger constraints at the mid-developmental stage. By employing stochastic network analysis and gene-set pathway analysis, we aim to demonstrate such changes of interconnectivity claimed in Raff’s hypothesis.
We first compared the changes of network randomness among developmental processes in different species by measuring the stochasticity within the biological network in each developmental stage. By tracking the network entropy along each developmental process, we found that the network stochasticity follows an anti-hourglass trajectory, and such a pattern supports Raff’s hypothesis in dynamic changes of interconnections among biological modules during development. To understand which biological functions change during the transition of network stochasticity, we sketched out the pathway dynamics along the developmental stages and found that species may activate similar groups of biological processes across different stages. Moreover, higher interspecies correlations are found at the mid-developmental stages.
Supplementary data are available at Bioinformatics online.
1 Introduction
Despite the large variety of morphology and anatomy in species across different phyla, some developmental stages of different species have been noticed to be similar in comparative embryogenesis studies. Researchers have been searching for patterns by comparing different developmental processes and hypothesizing how those patterns might have emerged (Irie and Kuratani, 2014).
Those similarities not only include the similar basic body plan shared among species in a phylogenetic group but also include some sets of homologs, such as homeobox genes (hox genes), which have been discovered to control similar developmental processes in species across different phyla (Quiring et al., 1994). The similar expression patterns of hox genes provide a genetic explanation for morphological similarities, allowing embryologists to link the developmental process and the diversity of life. Hox genes have been found to regulate and control one or multiple body parts and segments of embryogenesis (Svingen and Tonissen, 2006). The expression patterns of those regulators were found to be highly conserved in space and time during development, and the patterns were shared among different species in bilateral animals (Švorcová, 2012).
Inspired by the collinearity of hox gene clusters, the hourglass model was proposed by Duboule (1994) and extended by Raff (1996). The model suggested that species tend to be more similar around the middle of the developmental process. Those stages in the mid-developmental process are referred to as phylotypic stages, located during the period of formation of an organism’s body plan. Based on the model, the mid-developmental stages were hypothesized to be under larger constraints compared to the early and late developmental stages (Raff, 1996).
The hourglass model was later supported by transcriptomic analysis using methods of gene expression correlation (Kalinka et al., 2010) and phylostratigraphy analysis (Domazet-Lošo and Tautz, 2010). Further studies have extended those analyses and ideas to species in different phyla, including vertebrate (Irie and Kuratani, 2011), angiosperm (Quint et al., 2012), nematode (Levin et al., 2012) and fungi (Cheng et al., 2015). Besides the comparison of species within a phylum, several studies have examined the gene expression patterns during development among species covering different phyla (Gerstein et al., 2014; Levin et al., 2016; Li et al., 2014). However, those cross-phyla research findings of similarities and differences of developmental patterns have been inconsistent, if not contradictory (Gildor and Ben-Tabou de-Leon, 2018).
According to the hourglass model, the selective pressure on phylotypic stages is higher than the pressure on other stages (Švorcová, 2012). However, mechanisms behind the emergence of the hourglass patterns remain largely unknown. One detailed explanation could be traced back to Raff's hypothesis (Raff, 1996). Raff suggested that the hourglass pattern might be due to the dynamic of interconnections among different parts of an embryo during development (Fig. 1A). During the early stages, global axes are determined within an embryo, and their formations are flexible since those axes are global. When an embryo enters the phylotypic stages, the construction of a body plan requires coordination of different biological elements. This results in high communications among those elements. During the late stages, different biological modules are formed, and those modules are developed only partially independent from each other; hence, the connections within each module are under fewer constraints from previous interactions among the biological elements. To date, there has been little agreement over studies of Raff's connectivity hypothesis from molecular perspective.
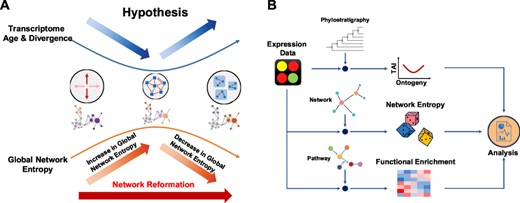
Overview of the hourglass model and analysis work flow in this study. (A) The graphical illustration of hourglass hypothesis and the results of network and pathway analysis. Based on Raff’s hypothesis, there are more connections among different biological modules in an organism during the mid-developmental stages. The trajectories of network entropy calculated in our results has an anti-hourglass pattern, indicating that the signal promiscuity reaches to the highest during the phylotypic stages. This pattern not only supports Raff’s hypothesis but also suggests a network reformation during the mid-developmental stages. In addition, the pathway analysis reveals the degree of conservation for the activity of each biological pathways across different species. Together with our results in network stochasticity, we proposed the systematic changes in network connection and pathway dynamics. (B) Schematic view of analysis workflow. The gene expression data of each species is analyzed with additional information. With the ranks by gene age (phylostrata), we calculated transcriptomic age index (TAI) proposed by previous studies. Using a gene-associated network, the network entropy was measured. With pathway gene sets, we performed GSVA analysis for functional enrichment
By integrating gene expression across development and network structure from protein–protein interactions, the hypothesis has been challenged by Comte et al. (2010). By calculating network centrality measurements in protein–protein interactions, the authors showed that there is no evidence that the molecular interactions are significantly higher during the phylotypic stages of zebrafish development. On the other hand, previous in silico simulations of the developmental process have shown that the hourglass pattern could emerge from layers of gene regulatory networks (Akhshabi et al., 2014). Moreover, previous studies using gene expression information have also come to inconsistent conclusions on a cross-kingdom comparison of developmental processes (Gerstein et al., 2014; Levin et al., 2016). Therefore, a more detail examinations of the hypothesis from molecular perspective is needed.
Our study reexamines the Raff’s connectivity hypothesis by integrating the network and pathway analysis in studying time-series gene expression data (Fig. 1B). The intent of this study is not to provide yet another way of defining a similarity measure among species but to trace the systematical changes over the ontogeny process and hence to search for possible explanations behind developmental models in comparative embryology. We first used the concept of information diffusion in a network (Gómez-Gardeñes and Latora, 2008). Few studies have applied the idea of information diffusion in evolutionary developmental biology before, but we notice that this concept is suitable to test Raff’s hypothesis in the changes of interconnectivity. We calculated the network entropy for each sample to measure the dynamic of connections throughout the developmental process. From our results, we were able to show that a biological system undergoes a systematic change in interconnections during mid-developmental stages.
Inspired by the association between changes of signaling promiscuity and systematic shifts of molecular pathway activities (Banerji et al., 2013; Li et al., 2013; Teschendorff et al., 2014), we further performed gene set variation analysis (GSVA) to compare the trend of system entropy rate and the dynamics of pathway activities. The GSVA scores quantify the relative pathway activity using the concept adopted from the gene set enrichment analysis (Hänzelmann et al., 2013). One of the main benefits of pathway-centric approaches for cross-species comparison is to avoid mapping the orthologs across species with large evolutionary distances, which may be a difficult task as these distances increase (Heger and Ponting, 2007). Comparing the network entropy and different pathway activity profiles, we found that the mid-developmental transition correlates with the shift of pathway activities from genetic information processing to metabolism.
2 Materials and methods
2.1 Genomic phylostratigraphy
The concept of phylostratigraphy is to classify genes based on their evolutionary history. The phylostratigraphy maps of different species were summarized in Supplementary Figure S2. The phylostratigraphy of each species, except Caenorhabditis elegans, was obtained from previous studies, including Arabidopsis thaliana (Quint et al., 2012), Coprinopsis cinerea (Cheng et al., 2015), Drosophila melanogaster, Danio rerio (Neme and Tautz, 2013), Mus musculus (Neme and Tautz, 2013) and, Homo sapiens (human) (Neme and Tautz, 2013). Since there were few studies in constructing phylostratigraphy of C. elegans, the phylostrata of C. elegans genes were assigned using two methods, respectively. One was acquired by accessing the evolutionary history of each gene from Protein Historian (Capra et al., 2012), and another one was built following the method of Chen et al. (2014), by stratifying the homologs based on the taxonomy tree from NCBI taxonomy and NCBI HomoloGene data (version 68, Apr 2014) (NCBI Resource Coordinators, 2015). The phylostrata were assigned to the taxonomic ranks of C. elegans by their phylogenetic order.
2.2 Transcriptomes of developmental processes
The gene expression data were obtained from previous studies, including A. thaliana (Xiang et al., 2011), C. cinerea (Cheng et al., 2015), C. elegans (Li et al., 2014), D. melanogaster (Li et al., 2014), D. rerio (Domazet-Lošo and Tautz, 2010) and M. musculus (Xue et al., 2013). The raw expression data were normalized by quantile normalization for microarray and TMM normalization for RNA-seq. To compare the phylotypic stages, developmental stages were separated into three parts: early, middle and late stages according to the morphology during developmental processes and to previous studies (Cheng et al., 2015; Domazet-Lošo and Tautz, 2010; Gerstein et al., 2014; Li et al., 2014; Quint et al., 2012). The partition of developmental stages was listed in Supplementary Tables S1–S6.
2.3 Transcriptome age index
2.4 Pathway information and function association network
The gene sets corresponding to different pathways and biological processes were obtained from KEGG (Release 78.1). The pathway association network was constructed by linking the reference pathways downloaded from KEGG. Each reference pathway was linked to a set of orthologs, denoted as KO entries in the database. In the network, each node is a pathway, and each edge represents highly overlapped between two pathways connected. The overlap score was determined by the Jaccard distance, and two nodes which overlap score falls in top 5% of all pairs of nodes were connected by edge.
2.5 Gene association network
The gene association network of each species was downloaded from STRING (version 10). To obtain high confidence interactions, we filtered out the edges with scores lower than 0.7.
2.6 Network entropy analysis
The network entropy analysis was performed to obtain the entropy of each gene in the gene association network by integrating expression profile. In this analysis, only the largest connected component was used to perform the network entropy. The details of the analysis were according to previous studies for calculation of network entropy (Banerji et al., 2013; Teschendorff et al., 2014, 2015; Teschendorff and Severini, 2010; West et al., 2012).
2.7 Gene set variation analysis
For each stage of a species, a pathway activity score was assigned to each pathway of a species. The details of the analysis were described as previous study (Hänzelmann et al., 2013).
2.8 Time peak index
2.9 Activity conservation score
The significance of GSVA score of each pathway was assessed using permutation tests. For each sample, the genes were permutated 100 times and a distribution of GSVA scores for each pathway was acquired by calculating scores from all permutated samples. The one-tailed P-values of original scores were calculated and adjusted for multiple testing. A pathway was determined to be significant if its adjusted P-value is less than 2.5%. For each developmental stage, a significant pathway was classified as active if it was within right 2.5% tail and repressed if it was within left 2.5% tail during the permutation test.
To determine whether a pathway was active or repressed in early, middle and late stages of each species, a pathway was classified as active or repressed if more than half of the stages contained significant scores. For each stage, a pathway was assigned one if it was active; negative one if it was repressed; and zero if none of the above number held. Each pathway was then assigned a conservation score by summing up the labels in the six species. An activity conservation score ranged from negative six to six. A pathway was considered highly conserved in its activity level if its conservation score was far apart from zero and lowly conserved if the score was closed to zero.
2.10 Evolutionary conservation of developmental stages
The evolutionary conservation of each developmental stage was estimated following the method published previously (Li et al., 2020,) to avoid the problem of phylogenetic association during the pairwise comparisons of developmental stages from multiple species (Dunn et al., 2018,). However, instead of using the expression values of orthologs, we used pathway activity scores for calculating a distance (expDist) of each combination of developmental stages from different species. For each level of species comparison in the phylogenetic tree (Supplementary Fig. S1), we calculated expDist of pathway activity profiles for all possible stage combinations following the method published in Li et al. (2020) and the stage combinations with the lowest 1% of expDist among the combinations were selected. The average count of the selected stages for each species was then referred as the Ptop score. Different thresholds of the expDist for Ptop calculation has been tested and the global trend of the Ptop values are similar under different thresholds and the signals are smoother across the development process under less stringent conditions. To estimate the variation of Ptop values, we applied bootstrapping with 1000 iterations during the expDist calculation to estimate the distribution of Ptop score for each stage in each species. To reduce the computational cost, one million random stage combinations were selected for calculation instead of evaluating the level of conservation for all possible stage combinations during the estimation of evolutionary conservation in Opisthokonta and Eukaryota.
3 Results
3.1 Network entropy follows inverse hourglass pattern
To study the Raff’s hypothesis of the hourglass pattern formation (Raff, 1996), we performed network analysis of sequential ontogenetic stages and compared the dynamics of network stochasticity with the profile of transcriptional age index (TAI) in each species. Transcriptomic data and phylostratigraphy information of six species were collected from previous studies to repeat the TAI calculation (Supplementary Figs S1 and S2). Our TAI calculation has shown that the hourglass patterns of TAI are observed in all species except for C. elegans (Supplementary Fig. S3). The patterns of transcriptomic age profile in most species are consistent with previous studies (Cheng et al., 2015; Domazet-Lošo and Tautz, 2010; Quint et al., 2012). While the trajectories of TAI have waists around the mid-developmental stages for A. thaliana, C. cinerea and M. musculus, the trajectories of C. elegans, D. melanogaster and D. rerio fluctuate largely and do not have waists with the TAIs calculated using different transformations of gene expression data (Liu and Robinson-Rechavi, 2018). The TAI profiles of all six species were collected and served as the template of the hourglass pattern when comparing with the profiles of network stochasticity.
We found that the network entropy measured on weighted gene association networks reveals an inverse hourglass pattern in most of the species within this study (Fig. 2, Supplementary Fig. S4). The network entropy begins rising in the early developmental stages and reaches its highest point around the mid-developmental stages. The network entropy then decreases after the middle of embryogenesis and continues to decrease in the late developmental stages. Since the network entropy of each developmental stage is defined by the sum of Shannon entropy of each gene weighted by stationary probabilities in a weighted gene association network, the relative changes of network entropy represent the rewiring of the gene association network. Therefore, this anti-correlation with the TAI trajectory in different species development not only supports Raff’s hypothesis but also suggests a network reformation during mid-developmental stages.
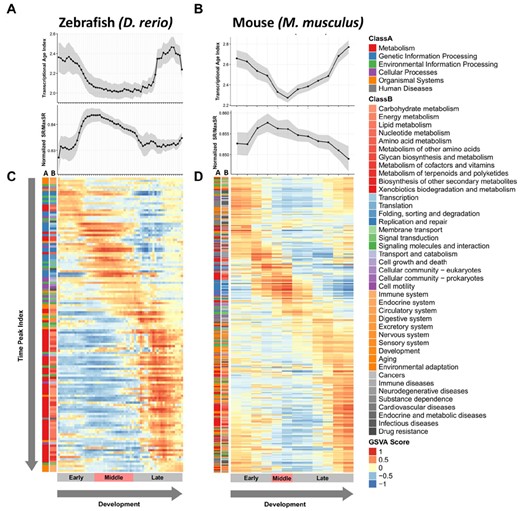
Changes of transcriptional age index, network entropy and pathway activities along the development of fish and mouse. The transcriptional age index (TAI), network entropy (normalized SR/MaxSR) and pathway activities (GSVA score) calculated for each developmental time point are aligned based on the developmental stages. The pathways are sorted based on their time peak indices (Supplementary Fig. S8). To acquire the pattern of pathway activation order, the categories of each pathway are provided beside the activity matrices. (A, B) Alignment of transcriptional age index and network entropy across the developmental stages of zebrafish and mouse. (C, D) Heatmap of GSVA scores for each pathway in each developmental stage of zebrafish and mouse. The stages are grouped into three different developmental phases: Early, Middle and Late, based on previous studies (see Section 2)
3.2 Cross-species comparisons using biological pathway activities support the hourglass model
We then shifted our focus from network stochasticity to pathway activities, attempting to dissect the dynamics of biological systems behind the anti-hourglass pattern of network entropy. We studied the pathway activity kinetics by computing GSVA scores based on the gene expression profile for each developmental stage (Fig. 2, Supplementary Fig. S5).
Previous studies such as Levin et al. (2016) examined the similarity of developmental processes using the expression values of orthologs mapped from species across large evolutionary distances. We assessed the comparative transcriptome analysis using the pathway activity profiles instead of gene expression values, and the similarity of different developmental stages is shown in Supplementary Figure S6. The pattern of pathway correlation matrix between D. melanogaster and C. elegans is similar to the matrix obtained from gene expression data (Gerstein et al., 2014).
Although the mid-developmental stages seem to have higher correlations in our pairwise species comparisons, Dunn et al. (2018) has shown that the phylogenetic relationships among species may violate the independent assumptions in cross-species comparison tests of developmental stages, and thus, introduce unwanted bias when applying simple pairwise comparisons of those stages. To avoid this issue, we further estimated evolutionary conservation (Ptop score, see Materials and Methods) of developmental stages across different species based on pathway activity scores and their phylogenetic relationship (Supplementary Fig. S1). As shown in Figure 3, mid-developmental stages are more conserved than other stages in A. thaliana and C. cinerea. However, we did not observe hourglass-like conservation in C. elegans and D. melanogaster, which have higher conservation signals at both early proliferation and gastrulation stages. In D. rerio, the Bilateria signals are higher during the mid-developmental and late-developmental stages. When comparing with more species, most gastrulation and segmentation stages show relatively higher Ptop scores than other stages. In M. musculus, the mid-developmental stages are more evolutionary conserved in Bilateria, and the peak widens and slightly shifts from organogenesis toward gastrulation in Opisthokonta and Eukaryota. We also observed that the scores rise at the late development stage before born in Bilateria and Opisthokonta. For species like A. thaliana, C. cinerea, D. rerio and M. musculus, our results provide another molecular support for the hourglass model from the perspective of biological pathway kinetics.
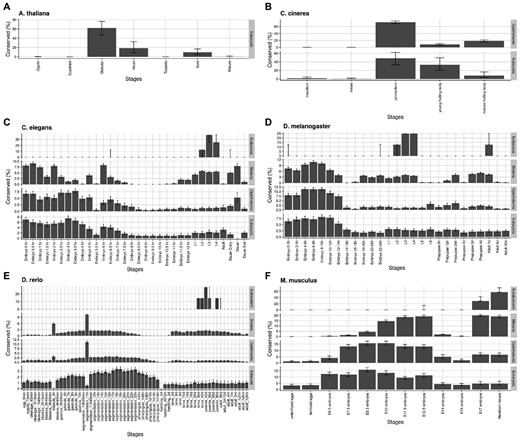
Evolutionarily conserved developmental stages from similarity of pathway activity scores. Evolutionary conservation of developmental stages was estimated across different levels based on the evolutionary tree of the six species included in this study (Supplementary Fig. S1): (A) A. thaliana, (B) C. cinerea, (C) C. elegans, (D) D. melanogaster, (E) D. rerio, and (F) M. musculus. The level of evolutionary conservation for each stage is estimated by a percentage of the stage most (top 1%) conserved stage-combinations (Ptop) (see Section 2). The distributions of Ptop score for each stage were estimated using bootstrapping and the medians of the scores were plotted across the developmental stages. The error bars represent the 25% and 75% quantiles of the estimated distribution for each stage
To further trace and compare growth trajectories in high-dimensional space, the GSVA scores of each developmental time point were projected to a lower dimension using PCA. By labeling the stages on the projected data points, we observed circular patterns in dimension reduction plots over sequential developmental stages in species such as A. thaliana, C. cinerea, D. rerio and M. musculus (Supplementary Fig. S7). In other species like C. elegans and D. melanogaster, such circular patterns are not as obvious. For example, the pattern of C. elegans development in the project space is not as continuous as that of other species but appears to be more discrete during the transition from embryo stages to larva stages and the transition from larva stages to the adult stage.
3.3 The conserved pattern in pathway activity profiles shows different pathways tend to activate in certain phases of development across different species
Our results in cross-species comparisons show that different biological functions dominate the pathway activity profiles in different stages (Fig. 2, Supplementary Fig. S5). Examining the pathway kinetics, we found that some pathways prefer to activate during the early stages, mid-developmental stages or late stages. Based on these observations, we compared one pathway to others within each ontogeny process and summarized these relative orders by computing the time peak index of each pathway.
We applied the time peak index method (Olsen et al., 2010) to rank the biological pathways based on the time points where they have higher activities. As shown in Supplementary Figure S8, many pathways activated in early and middle stages were related to transcription and translation, while most late activated pathways belonged to nutrient utilization. This pattern seems to be conserved across different species.
The results of the ranked time peak index reveal that different species, even with large evolutionary distances, may have a similar order of some pathways’ activation and repression. To perform cross-species comparisons of such pathway activation orders under the hourglass model, we defined the degree of evolutionary conservation for each biological pathway using permutation tests. Grouping each sequence of developmental stages into early, middle and late ontogeny phases for every species (Supplementary Tables S1–S6), we summarized the pathway activity results for all six species across different Kingdoms. Each pathway in a given developmental phase is assigned with an activity conservation score (ranged from negative six to positive six), which represents how conserved a pathway activity pattern is across species in our study. The sign of scores indicates whether a pathway tends to be upregulated or downregulated in a given phase. The scores are then visualized on the pathway association network constructed based on KEGG reference pathways (Fig. 4).
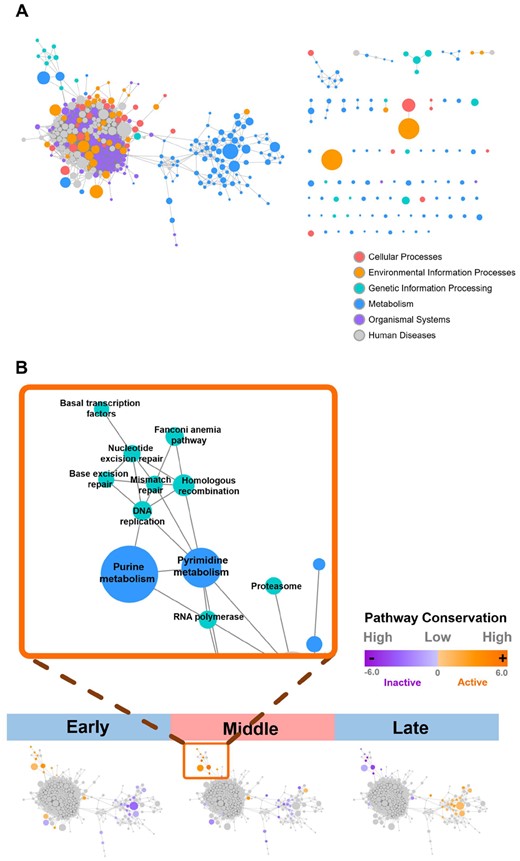
(A) Functional association network of KEGG reference pathways and (B) activity conservation scores of different pathways. The developmental stages were first grouped into early, middle and late phases and then activity conservation scores of pathways were calculated for common pathways for each phase. The absolute values of conservation scores (ranged from negative six to six) represented the degree of the conservation in pathway activities among different species and the sign of scores indicated whether a pathway tends to be activated or repressed during a developmental stage. The scores were visualized on the pathway association network constructed based on KEGG reference pathways
The results of activity conservation scores show that during development, genetic information pathways and related metabolic pathways such as purine and pyrimidine metabolism tend to be turned on in the early phase. The activity conservation scores of those pathways are highest during mid-developmental stages and drop in the late phase. The pattern observed is consistent with the findings in previous studies (Cheng et al., 2015). Many metabolic pathways, on the other hand, are downregulated in many species in the early phase of ontogeny. Moreover, the number of upregulated metabolic pathways related to nutrition processes rises during the mid-developmental phase and becomes dominant in the late ontogeny (Fig. 4).
4 Discussion
Evolutionary developmental biology has been widely investigated to understand how the evolutionary process shapes morphology diversity and species diversity. Previous studies in phylostratigraphy have suggested the existence of an hourglass model from a molecular perspective (Cheng et al., 2015; Neme and Tautz, 2013; Quint et al., 2012). In this study, we expand this finding by integrating the idea of network entropy in our cross-species comparison of developmental processes. We further analyzed the kinetics of biological pathways to provide biological interpretations behind the systematical changes during each ontogeny phase. Combining together the network and pathway analysis, here we report how randomness in network connectivity and activities of biological process change over development. The integration of gene expression and other biological information allow us to avoid ortholog mapping across species with long evolutionary distances and to perform cross-kingdom functional analysis in comparative embryology. The major limitations in this study are the number of the stages collected in our dataset and the currently available annotations of gene interactions and gene sets.
Our results from network analysis indicate that network entropy increases before mid-developmental stages and drops after these stages, exactly opposite to the trajectories of transcriptional age indices. The anti-correlations between network stochasticity and transcriptomic evolutionary age substantiated the Raff's interconnection hypothesis, stating that the high and complex connections during mid-development stages might result in larger developmental constraints, leading to evolutionary conservation of those stages (Fig. 1A). Furthermore, our results show that the pattern of network entropy is more robust than TAI under different transformation methods applied to gene expression values (Supplementary Figs S3 and S4). Since the dynamic changes of network entropy have been shown to indicate global changes of signaling flux and thus, to reflect transitions of a system, we next calculated the pathway activities of each developmental stage.
In our study, we used the GSVA method to study the pathway dynamics. Except for C. elegans and D. melanogaster, the hourglass-like conservation pattern emerged as we included more species in the stage comparisons of evolutionary conservation levels based on pathway activity profiles. Our observation supports the idea that such evolutionary tendency of phenotype conservation at the mid-developmental stages are not only specific to the animal kingdom. When comparing the kinetics of one pathway to another within each developmental process, the time peak indices of all pathway activities suggest that a common pattern in pathway dynamics may exist across different species. To acquire the pathway activity patterns across different species, each GSVA score is tested using the permutation test and summarized in the early, middle and late phases of development. With pathway dynamics, we were able to compare developmental stages among different species from different perspectives. The patterns found were further compared with those from previous cross-species comparisons using gene expression information (Gerstein et al., 2014; Levin et al., 2016).
Our results of pathway conservation scores supported the idea mentioned in Cheng et al., 2015. Calculating the mean expressions of the KEGG gene sets through each stage of development, the authors stated that the information processing might play a pivotal role in the waist of the hourglass model and the activities of metabolic pathways would rise in the late phase of development. However, a previous study has proposed that descriptive statistics easily produce results biased to noise and variation of gene expression and hence may not be robust to the choice of data preprocessing (Piasecka et al., 2013). To address this problem, we applied a functional scoring method to compare different developmental time points. Our study not only extends the idea in Cheng et al. (2015) but also achieves a more detailed understanding of the pathway dynamics throughout development. By analyzing the conservation of pathways’ activation and repression, we have captured a mosaic pattern in the transition of metabolic pathways during mid-developmental stages (Fig. 4).
However, some patterns we report in the pathway analysis differ from those identified in the hourglass model (Irie and Kuratani, 2011). While the hourglass model suggests a diverging pattern during the late ontogeny phase, a converging pattern is found in the cross-species comparisons using pathway activity profiles, resulting in a dual-phase pattern where higher correlations appeared in mid- and very late-developmental stages (Supplementary Fig. S6). Our results in ranked time peak index and pathway conservation score further suggest that such high similarities at the very late ontogeny phase are due to the domination of metabolic pathways in pathway activity profiles (Fig. 4, Supplementary Fig. S8). Combining the results of network and pathway analysis, we further hypothesize that the drop of network entropy may result from the maturation of an embryo, resulting in a major shift of pathway profiles from genetic information processing into nutrition utilization (Fig. 4). It might be worthwhile to directly address this relationship in future studies to better understand the detailed connections between the systematical changes in the dynamics of network connectivity and those in biological pathway activities. Furthermore, a more extensive taxon sampling can help confirm the generality of network conservation in cross-phyla or cross-kingdom comparisons.
5 Conclusion
In summary, we analyzed the developmental processes for different species across different kingdoms and phyla using time-series transcriptomes with their gene network structures and biological processes. The dynamic of network stochasticity suggests a network reformation during phylotypic stages. The comparisons of pathway activities further confirm the conservation of mid-developmental stages across species with large evolutionary distances. Together with the changes in network connectivity, our results in pathway dynamics suggest that the genetic information processing may be highly involved in the network reformation, and the nutrition metabolism dominates after the network reformation.
Acknowledgements
The authors thank the editor and reviewers for their constructive comments and suggestions.
Funding
This work was supported by the Ministry of Science and Technology [MOST 106-2320-B-002-053-MY3, MOST 107-2221-E-010-017-MY2, MOST 109-2221-E-010-011-MY3, MOST 109-2320-B-002-017-MY3]; and the Higher Education Sprout Project [NTU-109L8837A and 110L8808] in Taiwan.
Conflict of Interest: none declared.
References
Chen,C.-Y. et al. (2014) Dissecting the Human Protein-Protein Interaction Network via Phylogenetic Decomposition. Sci. Rep., 4, 7153.
Irie,N. and Kuratani,S. (2014) The developmental hourglass model: a predictor of the basic body plan? Development, 141, 4649–4655.

