


ABSTRACT
Mapping of chromatin accessibility landscapes in single-cells and the integration with gene expression enables a better understanding of gene regulatory mechanisms defining cell identities and cell-fate determination in development and disease. Generally, raw data generated from single-cell Assay for Transposase-Accessible Chromatin sequencing (scATAC-seq) are deposited in repositories that are generally inaccessible due to lack of in-depth knowledge of computational programming.
We have developed ShinyArchR.UiO, an R-based shiny app, that facilitates scATAC-seq data accessibility and visualization in a user-friendly, interactive and open-source web interface. ShinyArchR.UiO is an application that can streamline collaborative efforts for interpretation of massive chromatin accessibility datasets and allow for open access data sharing for wider audiences.
https://Github.com/EskelandLab/ShinyArchRUiO and a demo server with a hematopoietic tutorial dataset https://cancell.medisin.uio.no/ShinyArchR.UiO
Supplementary data are available at Bioinformatics online.
1 Introduction
Assay for Transposase-Accessible Chromatin with high throughput sequencing (ATAC-seq) is a powerful method for the assessment of genome-wide chromatin accessibility (Buenrostro et al., 2013) and can be explored at a single-cell resolution (Buenrostro et al., 2015; Cusanovich et al., 2015). A variety of software packages exist, but no uniform analysis has been developed for scATAC-seq data (Baek and Lee, 2020). Analysis of Regulatory Chromatin in R (ArchR) is a comprehensive package for scATAC-seq analysis (Granja et al., 2021) that allows for integration with single-cell RNA-seq using Seurat (Satija et al., 2015; Stuart et al., 2019). Tools for sharing scATAC-seq data are currently very scarce, and there are no open-source tools based on the analysis performed using the ArchR software toolkit. Here, we present ShinyArchR.UiO, a tool written in R, that adapts preprocessed ArchR data for online visualization and sharing.
2 Workflow and outputs
We have made the source code for ShinyArchR.UiO open to the public and the code can easily be customized for other scATAC-seq applications. The plots generated can be saved as high-quality figures in png, tiff or pdf format.
3 Visualization of scATAC-seq data
We have used a down sampled tutorial dataset (Granja et al., 2021) to illustrate the features of ShinyArchR.UiO which can be explored on our server (Fig. 1, Supporting Figs S1 and S2).
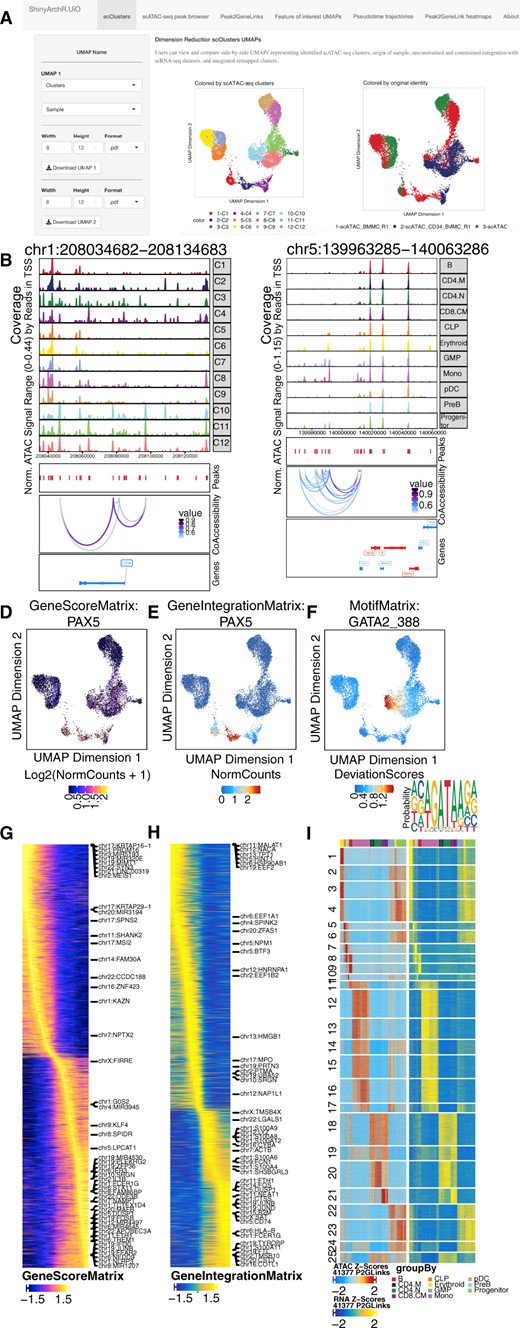
ShinyArchR.UiO have different web interfaces where the user can compute and plot scATAC-seq data. Users can select and explore: a) Five different UMAPs side-by-side. b) PlotBrowser of scATAC-seq clusters with peaks and co-accessibility. c) Peak2GeneLinks browser with peaks and co-accessibility. Side-by-side feature comparisons of d) GeneScoreMatrix, e)GeneIntegrationMatrix and f) MotifMatrix with motifseq logo and downloadable list of motif positions. Trajectory heatmaps including g) GeneScoreMatrix, and h) GeneIntegrationMatrix. i) Peak2GeneLink heatmaps of gene scores (left) and gene expression (right). Color bars above each heatmap represent the cell clusters as detailed below
3.1 Key features of ShinyArchR.UiO
The user can: (i) Perform multidimensional reduction UMAP plot of original samples, scATAC-seq clusters and clusters from cross-platform linkage integration with scRNA-seq generated by ArchR. (ii) Explore plot browser tracks grouped by original samples or scATAC-seq clusters with an adjustable window of 250 KB distance from the center of selected gene of interest with corresponding peaks and coaccessibility. (iii) View coaccessibility of integrated peaks and tracks in constrained remap clusters based on Peak2GeneLink analysis. (iv) Compare single-cell enrichment based on GeneScore, GeneIntegration or Motif Matrix UMAPs for selected genes side-by-side, generate a motif seqlogo for selected transcription factors and download genome-wide list of motif positions. (v) Visualize four different ArchR defined pseudotime trajectory heatmaps. (vi) Explore Peak2GeneLink heatmap on scATAC-seq and scRNA-seq modality.
3.2 Basic usage
ShinyArchR.UiO uses preprocessed ArchR HDF5 formatted objects stored on disk and generates the ShinyArchR.UiO for visualization of the scATAC-seq metadata (Fig. 1). This process can be executed in two steps: (i) Download or git clone https://github.com/EskelandLab/ShinyArchRUiO. (ii) Provide a path to saved arrow file folders (Saved-ArchRproject) obtained from ArchR analysis in global. R and name given to trajectory analysis in the getTrajectory function of ArchR, see SI (2) for more details.
Running ShinyArchR.UiO from command line:
R -e
"shiny::runApp('∼/ShinyArchR.UiO'
,launch.browser = TRUE)"
Or open app. R or global. R file, press Run App button on R Graphical User Interface.
3.3 Advanced usage
ShinyArchR.UiO can be run locally or be made available to be hosted on an open-source shiny-server, offering features such as apps behind firewalls (RStudio Team). We have made an open-source R-based tool for visualization of scATAC-seq data including integration with complementary scRNA-seq for a broader range of users than experienced computer scientists. The ShinyArchR.UiO web interface allows the user to easily explore chromatin opening across the genome at a single-cell level for improved insight into complex biological data.
Acknowledgements
We thank the Department for Research Computing, UiO for help with the Shiny server for ShinyArchR.UiO demo and Emily L. B. Martiensen, Hallvard A. Wæhler, Leslie Foster and Sakshi Singh for testing ShinyArchR.UiO on different operating systems.
Author contributions
A.S. and A.A. developed the code with scientific input and tests performed by M.R. and R.E. R.E. and A.S. wrote the manuscript with input from M.R.
Funding
This work was partly supported by the Research Council of Norway through its Centres of Excellence funding scheme [262652]. University of Oslo supported open access publication.
Conflict of interest: none declared.
References
RStudio Team (
Author notes
Present addresses: Department of Cancer Immunology, Institute for Cancer Research, Oslo University Hospital, Norway and KG Jebsen Centre for B-Cell Malignancies, Institute for Clinical Medicine, University of 0379 Oslo, Norway.

