


Abstract
Electrostatic force is an essential component of the total force acting between atoms and macromolecules. Therefore, accurate calculations of electrostatic forces are crucial for revealing the mechanisms of many biological processes. We developed a DelPhiForce web server to calculate and visualize the electrostatic forces at molecular level. DelPhiForce web server enables modeling of electrostatic forces on individual atoms, residues, domains and molecules, and generates an output that can be visualized by VMD software. Here we demonstrate the usage of the server for various biological problems including protein–cofactor, domain–domain, protein–protein, protein–DNA and protein–RNA interactions.
The DelPhiForce web server is available at: http://compbio.clemson.edu/delphi-force.
Supplementary data are available at Bioinformatics online.
1 Introduction
DelPhi is a software package capable of calculating electrostatic potential distribution (Li et al., 2012; Rocchia et al., 2002). Recently we have developed DelPhiForce tool, which uses DelPhi to calculate electrostatic forces (Li et al., 2017). It was demonstrated that DelPhiForce can be used to study binding mechanisms of protein complexes, including kinesin–tubulin, dynein–tubulin and barnase–barstar (Li et al., 2017).
In this work, we report the development of the DelPhiForce web server with the aim of calculating electrostatic forces between objects, including proteins, DNA/RNAs, small molecules, ions and other user-specified objects. The web server provides the resulting electrostatic forces in a downloadable file and visualizes them via 3Dmol (Rego and Koes, 2015).
2 Materials and methods
2.1 DelPhiForce algorithms
DelPhiForce uses the DelPhi program to generate a electrostatic potential distribution within a computational grid. Then a trilinear interpolation method is used to calculate the electrostatic potential at user-specified positions followed by numerical differentiation to obtain the corresponding electrostatic force(s). Details of the DelPhiForce algorithm are described in reference (Li et al., 2017) as well as provided in Supplementary Material. The input files for DelPhiForce web server are position-charge-radius (PQR) files, which can be generated using DelPhiPKa software at user specified pH values (Wang et al., 2015).
The DelPhiForce calculations are carried out using the following default parameter values: dielectric constants for water and protein are set to 80 and 2, respectively; salt concentration is 0.15 M; resolution of the grid box (scale) is 2 grids per Å; and molecular surface of proteins is generated by a water probe of radius 1.4 Å. Users are given the option to customize the salt concentration and the resolution of the grid box.
2.2 Architecture of the webserver
The DelPhiForce web server has two basic components—the user interface and the job backend. The webserver user interface is implemented using HTML. The users can upload the structures of the molecules and set the simulation parameters on the interface. The files and parameters are then sent to the computing backend on Palmetto supercomputer which then performs the force calculations.
Once the calculations are completed, the web server returns a file with the forces between user-specified entities. It also provides visualization of the structures via 3Dmol. The 3Dmol shows the backbone of the structures in cartoon style and the residue side chains in line style along with along with arrows presenting the electrostatic forces. Users are also able to zoom and rotate the canvas by scrolling and dragging the mouse and adjusting the background color for the best visualization. We also provide TCL file for download which can be visualized with VMD.
2.3 Structure preparation
Structures used for the demonstration were downloaded from the RCSB Protein Data Bank (PDB). The biological units of these structures were retained for the modeling. The PQR files were generated by DelPhiPKa (Wang et al., 2015) at pH = 7 and then used for DelPhiForce web server to calculate the electrostatic forces.
3 Results
Five cases are investigated to demonstrate the usage of DelPhiForce web server in different types of biomolecular interactions, including protein–protein, domain–domain, protein–DNA, protein–RNA and protein–ligand binding. An example of calculating pair-wise electrostatic energy is given in the Supplementary Material. Each case is outlined below.
Protein–protein interactions: Figure 1a shows the cell–cell recognition regions of mouse Protocadherin Gamma B7 (PDB: 5SZP) (Goodman et al., 2016) and illustrates the usage of DelPhiForce web server to study the role of electrostatic forces in protein–protein binding. The biological unit of ectodomain fragments is a homo-dimer. To better visualize electrostatic forces, we moved one ectodomain fragment 15 Å away from its partner along the line joining their mass centers and then calculated the corresponding electrostatic force. It can be seen that the total electrostatic force drives the ectodomain toward its binding partner indicating the dominant role of electrostatic forces in ectodomain homo-dimerization.
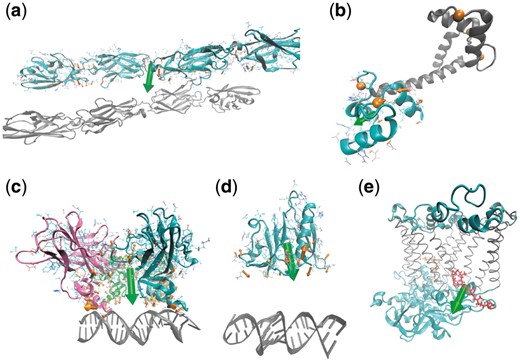
DelPhiForce web server usage. The total electrostatic force is shown using a green arrow and the forces applied on each residue are represented as orange arrows (The size of the arrows is adjusted for optimal visualization). (a) Structure of ectodomain fragments comprising cell–cell recognition regions of mouse Protocadherin Gamma B7. Two ectodomain fragments form a homo-dimer and are shown in different colors. (b) Structure of calmodulin in calcium loaded and peptide free states. N-terminal lobe, C-terminal lobe and calcium ions are colored in gray, cyan and orange, respectively. (c) Structure of p53 core domain in complex with DNA. The p53 core domain binds to DNA as a cooperative tetramer and each monomer is shown in a different color. (d) Structure of Bacillus anthracis ribosomal protein s8 in complex with an RNA aptamer. The Bacillus anthracis ribosomal protein s8 is shown in cyan and RNA is colored in gray. (e) Structure of photosynthetic reaction center from rhodobacter sphaeroides. The primary (QA) and secondary (QB) quinones are shown in orange and red, respectively. The transmembrane region of the reaction center is shown in green
Domain–domain interactions: this case illustrates the inter-domain interactions of calmodulin in calcium loaded and peptide free state (PDB: 5E1K) (Lin et al., 2016). The total electrostatic force keeps the two lobes of calmodulin apart, thus helping it to retain the open conformational state of calcium loaded calmodulin (Fig. 1b). Repeating these calculations at low pH (pH = 5.0) results in almost zero net electrostatic force, which is consistent with previous observation (Isvoran et al., 2007).
Protein–DNA/RNA interactions: two representative structures of protein–DNA and protein–RNA complexes were provided as inputs to DelphiForce web server to calculate the electrostatic forces (PDB: 4HJIE and 4PDB) (Chen et al., 2013; Davlieva et al., 2014). The binding proteins were moved 20 Å away from their partner DNA or RNA along the line joining their mass centers for better visualization. It can be seen that electrostatic forces point towards the corresponding DNA or RNA and drive the binding process (Fig. 1c and d). It should be appreciated that the force acting on the corresponding protein calculated at a distance of 20 Å away provides guidance and correct orientation.
Protein-cofactor binding: The photosynthetic reaction center protein was used as an example to demonstrate the electrostatic forces in protein-ligand binding (PDB: 1AIJ) (Stowell, 1997). The photosynthetic reaction center is a transmembrane protein involved in electron transfer process, and the secondary (QB) quinone drifts into the membrane after the electron/proton transfer is completed. The role of electrostatics is demonstrated in Figure 1e, where the green arrow indicates the electrostatic force acting on QB, indicating plausible direction of QB’s movement toward the lipid membrane (not shown).
Funding
This work was supported by a grant from National Institutes of Health [R01GM093937].
Conflict of Interest: none declared.
References

