


Abstract
Studies, mostly from the operations/management literature, have shown that the rate of human error increases with task complexity. What is not known is how many errors make it into the published literature, given that they must slip by peer-review. By identifying paired, dependent values within text for reported calculations of varying complexity, we can identify discrepancies, quantify error rates and identify mitigating factors.
We extracted statistical ratios from MEDLINE abstracts (hazard ratio, odds ratio, relative risk), their 95% CIs, and their P-values. We re-calculated the ratios and P-values using the reported CIs. For comparison, we also extracted percent–ratio pairs, one of the simplest calculation tasks. Over 486 000 published values were found and analyzed for discrepancies, allowing for rounding and significant figures. Per reported item, discrepancies were less frequent in percent–ratio calculations (2.7%) than in ratio–CI and P-value calculations (5.6–7.5%), and smaller discrepancies were more frequent than large ones. Systematic discrepancies (multiple incorrect calculations of the same type) were higher for more complex tasks (14.3%) than simple ones (6.7%). Discrepancy rates decreased with increasing journal impact factor (JIF) and increasing number of authors, but with diminishing returns and JIF accounting for most of the effect. Approximately 87% of the 81 937 extracted P-values were ≤ 0.05.
Using a simple, yet accurate, approach to identifying paired values within text, we offer the first quantitative evaluation of published error frequencies within these types of calculations.
Supplementary data are available at Bioinformatics online.
1 Background
Errors are part of the scientific experience, if not the human experience, but are particularly undesirable when it comes to reported findings in the published literature. Errors range in their severity from the inconsequential (e.g. a spelling error that is easily recognized as such) to those that affect the conclusions of a study (e.g. a P-value suggesting a key result is significant when it is not). Some may be detectable based upon the text, while others may not. This is particularly relevant in light of the recent concern regarding scientific reproducibility (Begley and Ioannidis, 2015; Collins and Tabak, 2014; Prinz et al., 2011). By understanding more about the types and nature of errors that are published, and what factors affect the rate of error commission and entry into the literature, we can not only identify ways to potentially mitigate them, but also identify where peer-review efforts are best focused.
Previous studies, mostly from the literature on management and operations research, have established that there is a baseline human error rate in performing tasks, one that generally increases with the complexity of the task, decreases with task-taker expertise, and decreases in proportion to the ability and motivation to re-examine work for errors (Allwood, 1984; Grudin, 1983; Mattson and Baars, 1992; Tsao, 1990; Wing and Baddeley, 1980). These studies have also found that people are generally worse at detecting errors made by others than they are in detecting their own errors, that errors of commission (e.g. calculating something wrong) are easier to detect than errors of omission (i.e. leaving important details out), and that errors in logic are particularly hard to detect (e.g. applying the wrong statistical test, or using the wrong variable in an otherwise correct formula) (Allwood, 1984).
Thus, when authors compile a body of work for publication, we would expect errors to occur at some baseline rate that is a function of task complexity, author expertise and re-examination of the compiled results. But in the context of peer-review and scientific publishing, there are several things not yet known. First, how does the number of co-authors affect the error rate? On one hand, more authors means more people potentially checking for errors, but it’s also possible that coordinating content authored by multiple people may increase the overall complexity of the task (e.g. a corrected error may accidentally be changed back in later edits or authors may assume someone else must be checking calculations and therefore not look as closely). One prior study found no relationship between P-value error rate and having two authors double-checking statistics, but was field-specific (six psychology journals) and only examined one versus two authors rather than the effects of the total number of authors (Veldkamp et al., 2014). Second, how effective is peer-review at catching errors? It is generally believed that journal impact factor (JIF) correlates with the rigor of peer-review scrutiny, but this has not been quantitatively established, nor is it known how effective it is. There have been reports of journals with higher impact factors having higher retraction rates, and it has been argued that this, in part may be a consequence of the desire to publish the most striking results (Fang and Casadevall, 2011), but this could also be due to increased scrutiny. Third, do factors such as JIF or number of authors affect all error rates equally or does their impact depend on the type of error? Since expertise is a factor in detecting errors, it is possible that reviewers in some fields may be better at catching some types of errors and worse at others. Finally, what fraction of errors is systematic (i.e. multiple incorrect calculations of the same nature)? Systematic errors may be due to lack of expertise (e.g. not knowing how to perform a calculation) or may be due to the way calculations were set up (e.g. spreadsheets or programs referencing values encoded elsewhere rather than entering them directly). Systematically incorrect calculations would seem more likely to affect the overall conclusions of a study than random errors. And a high systematic error rate would also suggest that the scientific community would benefit from a standardized solution/procedure designed to eliminate it.
In previous studies we found that ∼12% of URLs were misspelled (Wren, 2004), and later ∼3% of Digital Object Identifiers (Hennessey et al., 2014). Similarly, we found slightly <1% of published National Clinical Trial IDs led to an error page (but were unable to quantify how many may have been erroneous IDs that led to the wrong clinical trial) (Wren, 2017). These errors were slightly unexpected because we thought authors would likely ‘cut and paste’ such items, but it emphasizes that we do not know the source of the errors nor can we assume that all authors will approach tasks the same way. Similarly, other studies have found errors in reference formatting (Aronsky et al., 2005) , and a recent large-scale automated survey of the psychology literature for P-value errors reported in APA style found 12.9% of papers had a grossly inconsistent P-value (error affecting significance at P ≤ 0.05) (Nuijten et al., 2015). Our first goal in this report was to quantify and contrast error rates in very simple calculations versus more complex calculations. Second, we wanted to see how additional scrutinizing factors such as rigor of peer-review and increasing number of authors per paper affected the probability of an error being published. Finally, we wanted to see whether error rates over time were relatively constant or if technological advances might be impacting them, either positively (e.g. increased availability and ease of software packages) or negatively (e.g. by lack of standardization).
To answer these questions, we focused on MEDLINE abstracts because they tend to contain the most important findings of a study and, thus, errors in the abstract are more likely of potential concern. We algorithmically scanned all MEDLINE abstracts to identify published percent–ratio pairs [e.g. ‘7/10 (70%)’], which are simple calculations requiring minimal expertise and for which tools (e.g. calculators) are ubiquitous. Complex calculations included the reporting of odds ratios (OR), hazard ratio (HR) and relative risk (aka ‘risk ratio’) (RR) estimates along with their 95% CI and P-values when provided (e.g. OR = 0.42, 95% CI = 0.16–1.13, P < 0.05). We extracted these pairs of reported values, recalculated them based on the full set of reported numbers, then compared the recomputed values with the reported ones, looking for discrepancies. We focused on extracting high-confidence patterns for this study, prioritizing a low false-positive (FP) rate over minimization of the false-negative (FN) rate. Although there are certainly more sophisticated methods that could be used to extract paired values, we found regular expressions worked quite well, particularly for the statistical ratios, and the primary focus of this study was on quantifying the rate by which erroneous calculations make it into the published literature, and the factors that influence the rate of published errors.
We did not want to count as ‘discrepancies’ any instances that could be attributable to rounding differences (up or down) in the recalculated values, so we based our calculations upon the number of reported significant figures in the primary item (OR/HR/RR). We allowed for rounding in the CI as well, calculating a range of possible unrounded CI values, and only counted it as a discrepancy if it fell outside all possible rounding scenarios. We divided errors into three categories based on the log10 magnitude of discrepancy between the reported and re-calculated values: Potentially minor (>1% and <10%), potentially serious (≥10% and <100%) and potentially egregious errors (≥100%). We also identified ‘boundary violations’, which were those in which the ratio point estimator appeared outside of its CI (which should never happen), as well as P-value errors in which the conclusion of significance would be changed at a level of P < 0.05, and P-values that were an order of magnitude off in the wrong direction (e.g. reported P = 0.001 but recalculated P = 0.01).
A list of all reported values and their recomputed counterparts that were extracted, along with their associated PubMed IDs and surrounding sentence context, are available as Supplementary Material S1–S3, along with higher resolution versions of Figures 1–5.
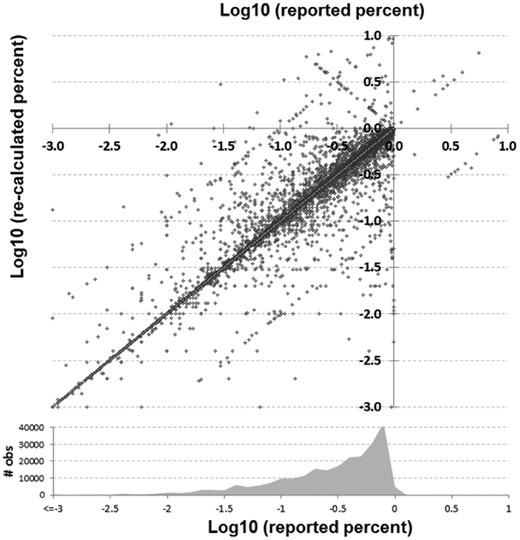
Comparison of reported versus recalculated percent–ratio pairs in log10 scale. A density plot of how many reported observations of each value is shown at bottom
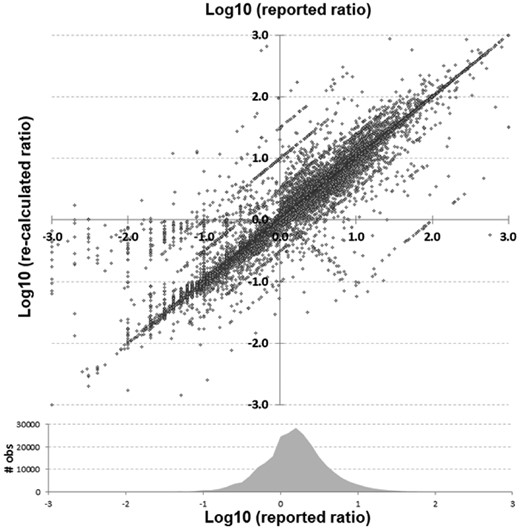
Statistical ratio (OR, HR and RR) scatterplot of reported versus re-calculated (based upon their reported CI) values in log10 scale. Shown at bottom is a density plot reflecting the number of observations within that range of reported values
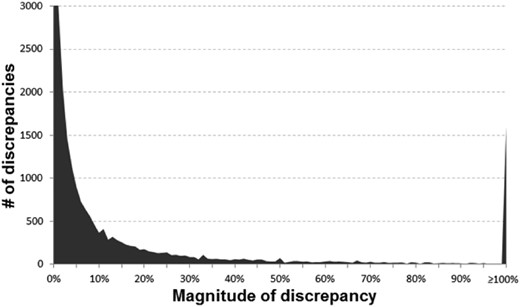
Histogram of the discrepancies identified (y-axis cutoff at 3000 to better show the tail of the distribution)
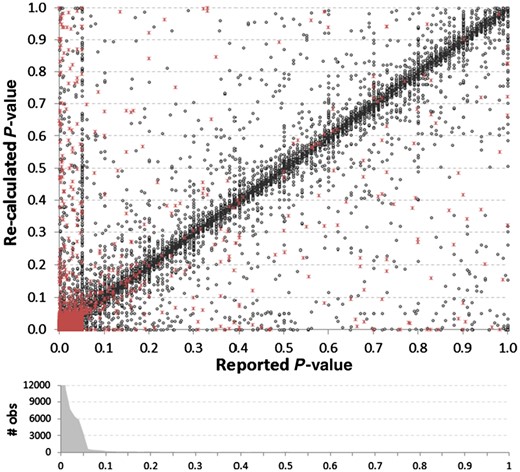
Comparison of reported P-values versus their recalculated values, based upon the reported 95% CIs. Red asterisks indicate instances where there was a discrepancy between the reported and recalculated ratio–CI, suggesting potential causality for a discrepancy. The density histogram shows the bias towards the reporting of low P-values, as 87% of all reported P-values were P ≤ 0.05. The histogram was truncated at 12 000 (36 420 reported P-values were ≤0.01). A vertical cluster of values can be seen where the reported P-value = 0.05
![Reported versus re-calculated P-values shown on a log10 scale with density histogram at bottom. The most dominant vertical lines match standard significance thresholds used in reporting P-values [e.g. −1.3 = log(0.05) and −2 = log(0.01)]](https://oup.silverchair-cdn.com/oup/backfile/Content_public/Journal/bioinformatics/34/10/10.1093_bioinformatics_btx811/5/m_bioinformatics_34_10_1758_f6.jpeg?Expires=1716441164&Signature=TfjCjlh~crhEkM2H6Olmzh~VBH25dwdIEu0YRR7aNt1~RePfKFlgE99RvsiLjLsjkes0Up0VYx4qJl5vcmtk6-eJZmPCM4PwUt9PPkApChefC6db1AVkxKN1HslrJDfLcyYST5EDG7nnWuUraq2pWdAYnsIGtcqFRAuU-HBJMYD-sdcBPsTkyxvwrvvL0eudSpXFDWZCly9MhkTxHE6HhpbkQsV0wV5wioUGq4QrUlUNRinOaVGseuh1XPvOrPjaquyoP1Rv-vG3V4mEVB1I3VWLD1kwTgojpRUZpbQbEL-zsMukz0lh~AXd54Ifiuy7krI8DWzuSc-XoMdsPgSqJw__&Key-Pair-Id=APKAIE5G5CRDK6RD3PGA)
Reported versus re-calculated P-values shown on a log10 scale with density histogram at bottom. The most dominant vertical lines match standard significance thresholds used in reporting P-values [e.g. −1.3 = log(0.05) and −2 = log(0.01)]
2 Materials and methods
The MEDLINE database was downloaded from NCBI (http://www.ncbi.nlm.nih.gov/) on April 26, 2016 in XML format and parsed to obtain the title, abstract, journal name and PubMed ID (PMID). JIFs were obtained online for the year 2013. The 5-year JIF was used, as it should better reflect long-term JIF than the regular 2-year JIF, but 2-year JIF was used when the 5-year was not available. A total of 82 747 JIFs could not be mapped for the 486 325 analyzable items extracted (17%). This is a limitation of the study, as many of the journals that could not be mapped appeared to be low-impact journals.
2.1 Algorithmic approach to find paired values for re-calculation and comparison
Each MEDLINE abstract was scanned for ‘analyzable items’ (i.e. percent–ratio pairs, OR/HR/RR with paired 95% CIs, and P-values). The error detection algorithm entailed a series of textual variability reduction steps (e.g. changing all instances of ‘less than’ to ‘<’), followed by a series of regular expressions to detect items of interest. For example, words that begin with parenthetical statements that include standard abbreviations [e.g. ‘(OR = )’or ‘(RR = ’)] or their full forms [e.g. ‘(Odds Ratio=’)] were then expanded to the next matching parenthesis, accounting for intermediate separators, and checked for the presence of a 95% CI or 95% CL (confidence limit) within. Then, a series of iterative filters reduced the widespread variability in reportable parameters [e.g. replacing CI(95) with 95% CI]. Additional heuristics were applied to screen out FPs. The scripts used to identify these values are at https://github.com/jdwren/ASEC and the sentence context, values, and recalculations themselves are provided as supplementary information.
2.2 Estimating the algorithmic error rate of extracting reported values
To estimate the algorithm’s FP rate, we first took a random sample of 500 extracted ratio–CI pairs and examined them manually. In this subset, there were no errors in extracting the ratio or the CI pairs (100% precision). There were 144 P-values within this subset, 2 not detected by the algorithm (FN) and 3 that had incorrect values extracted (which count as both FP and FN), giving P-value extraction a precision of 98%. Similarly, for 500 percent–ratio pairs, all values were extracted accurately (100% precision). It’s important to caution that because errors are sparse, this precision estimate is approximate and does not equate to 100% precision in identifying discrepancies. For example, if literature discrepancies occur at a rate of 2% and the algorithm has a 0.5% FP rate, then ∼20% (0.5%/2.5%) of the identified discrepancies will be FP. It is for this reason we chose to emphasize precision over recall and have also manually looked over all detected discrepancies ≥10% and removed errors we were able to spot before we began analysis. Within the 200 ratio–CI pairs with the highest discrepancies we only found 10 erroneously extracted values (5%). Thus, the per-item precision is close to 100%, and the per error precision is ∼95%.
Estimating the algorithmic FN rate is more difficult since ratio–CI reports are relatively sparse in the literature as a whole. However, they are more prevalent in the epidemiology literature, so we output a subset of 100 abstracts from the American Journal of Epidemiology and manually identified all references to HR, OR and RR. We did not count references to ‘adjusted’ ratios since we did not set out to extract those. Within the 100 abstracts manually examined, we found 94 ratio–CI pairs, and the algorithm identified 44 of them (47% recall). Of the 50 ratio–CI pairs not identified, 30 (60%) were instances where multiple pairs were reported as a list (e.g. ‘ORs = 4.3, 5.1, 6.2 and CIs=…’). A limitation of this evaluation method is that some journals may have or encourage specific styles of reporting ratio–CI pairs, which may in turn influence algorithmic accuracy. For percent–division pairs, the algorithm identified 18/47 (38% recall) of the manually identified instances.
2.3 Detecting percent–ratio errors
Ratios are often paired with percents [e.g. ‘… 11/20 (55%) of our patients…’] immediately proximal to each other in text. Correct identification of percent–ratio patterns had the largest error rate due to ratio–percent-like terms that were not actually numerator–denominator pairs (e.g. tumor grades, genotypes/ribotypes, visual acuity changes, and HPV types). We found looking for papers with every reported item detected as erroneous was an effective way to identify such exceptions and screen them out before the final run. We flagged such keywords to subject these instances to higher scrutiny, but there were simply too many instances to investigate all estimated errors in detail. Thus, in our list, it is possible some patterns may be counted as percent–ratio errors, but may be a field-specific means of denoting something else and we did not catch them. We also did not try to infer meaning. For example, if an author wrote ‘the sequences were 99% (1/100) similar’, it could be reasonably inferred that the 1/100 referred to the mismatches identified and not the similarity. However, such instances were rare and the general rule by far is that ratio–percent patterns like this are paired values, so it would be counted as a published error.
If the words preceding the ratio–percent pair indicated that it was greater than (e.g. ‘over’, ‘more than’) or less than (e.g. ‘under’, ‘less than’), then we excluded that pattern from analysis under the presumption that it was not intended to be considered an exact calculation. Although most instances of these phrases did not have discrepancies, which suggest the authors were merely indicating the number was rounded, we chose to err on the side of caution.
For ratio–percent pairs, one source of FPs that was extremely difficult to control for were anaphora-like references. That is, instances where the ratio preceding a percent is a subset of a larger number that was mentioned earlier in the sentence or abstract. For example, ‘We recruited 50 patients, but had to exclude ten of them, 6/10 (12%) because of prior illness and 4/10 (8%) because they were otherwise ineligible’—in this case the 12 and 8% refer to the 50 patients, not the ratios immediately preceding them. Because anaphora resolution is still a computationally difficult task, requires a different approach and cannot be properly benchmarked without a gold standard, and is relatively rare, we chose to estimate the number of FPs caused by anaphora rather than try to correct it.
2.4 Extracting ratio–CI pairs and associated values from text
OR, RR and HR reports most frequently followed the format ‘(R = X, 95% CI = L-U, P < C)’, where R is HR/RR/OR, X is the value for R, L is the lower CI boundary, U is the upper CI boundary, and C is the P-value (when given, which was ∼33% of the time). The delimiters used to separate the values frequently varied, as did the order of the variables. Commas within numbers containing less than four digits were presumed to be decimals for the purpose of calculation (e.g. ‘CI = 4, 6 − 7, 8’).
Point estimates of OR, HR and RR were re-calculated by log-transforming the reported two-sided 95% CI limits, then exponentiating the middle value. Standard statistical procedures for estimating such ratios (e.g. logistic regression) perform linearly into the log space, hence correct ratios should be equidistant from each log-transformed boundary of the two-sided CI (roughly 2 SD in the case of 95% CIs). As such, we relied upon the two reported CI limits for our calculations, assuming they were computed in log space and transformed back through exponentiation, hence positive. A number of reports had incomplete information such as no ratio being given despite the two CIs, only one CI limit provided (although surrounding context suggested two-sided analysis). Some had mathematically incorrect values such as the CI limits being negative, suggesting either they were log-transformed but not explicitly declared as such, or a statistical procedure unsuitable for estimating ratios (e.g. standard linear regression) was used in estimation. These types of occurrences were considered either formatting errors or errors of omission and were not included in our estimates of errors of commission based upon reported value recalculations.
2.5 Re-calculation of reported ratio–CI values
Difference values were furthermore only counted if the calculated value fell outside the buffer range allowed by rounding the CI both up and down to the next significant digit. For example, if the reported CI was 1.1–3.1, then the ratio value was recalculated using a CI of 1.05–3.05 (the lowest it could have been prior to rounding up) and maximum of 1.15–3.15 (the highest it could have been prior to rounding down). Only when the reported ratio fell outside the range between the lowest and highest recalculated ratio values was it counted as a discrepancy and was presumed to be the lesser of the two rounding possibilities.
2.6 Recalculation of P-values for ratio–CI pairs
For simplicity, we choose to ignore potential corrections for small samples such as using exact versions of the estimators or specialized tests for contingency tables (e.g. Fisher). Since the exact and the asymptotic tests should give similar results under ordinary situations, we compensated by increasing the difference threshold between the reported and recomputed P-value considered to be an error.
2.7 Determination of discrepancies that constitute an ‘error’ in P-values
One type of P-value error is when the evaluation of significance at P ≤ 0.05 is incorrect, whether reported as non-significant and re-calculated as significant or vice-versa. Magnitude discrepancies in P-values, in terms of whether or not it is potentially concerning, is probably best modeled in log terms, particularly since most tend to be very small numbers. For example, the difference between P = 0.001 and 0.002 might seem large when expressed as a percent, but would not likely be of concern in terms of how it might affect one’s evaluation of the significance. But an order of magnitude difference between a reported P = 0.001 and re-calculated P = 0.01 suggests that the level of confidence has been misrepresented even if the significance at P < 0.05 did not change. However, because there is also some point where order of magnitude differences also do not change confidence (e.g. P < 1 × 10⁻²⁰ versus P < 1 × 10⁻¹⁹), we limit order of magnitude analyses to values between P = 1 and P ≤ 0.0001. For the ratio–CI pairs extracted, this range represents about 98% of all reported P-values. Furthermore, under an assumption similar to rounding, P-value discrepancies are only counted as discrepancies if the recalculated value is higher when the authors report (P < X or P ≤ X). If it is lower, it is presumed the authors reported a ‘capped’ P-value to reflect precision limitations and all re-calculated values lower than this are counted as zero discrepancy. Similarly, if the authors report (P > X or P ≥ X) and the re-calculated value is higher, it is not counted as a discrepancy. However, when the P-value is reported as exact (P = X), all discrepancies are counted.
After extracting P-values, we found 15 were invalid; 8 were >1 and 7 <0, most of which appeared to be typos (e.g. the re-calculated P-values for those < 0 matched their absolute value). A total of 704 were exactly zero, which goes against standard P-value reporting conventions, but many had their decimal points carried out further (e.g. P = 0.000), suggesting a convention whereby the authors were indicating that the P-value was effectively zero, and that the precision of the estimate corresponded to the number of zeros after the decimal. So, in these cases, for analysis of discrepancies, we added a 5 after the final zero (e.g. P < 0.000 becomes P < 0.0005), and 92.7% of the re-calculated P-values were equal to or less than this modified number, suggesting it is a reasonable approximation. Also, 2308 ratios had one CI boundary exactly equal to 1, which suggests the possibility the significance calculation could have been with reference to one side of the interval only. Note that because a CI is used to illustrate the precision of the effect size estimate and not directly for testing, such reporting would be poor practice. Even from the point of view of constructing onesided CIs, since the interval limit is either 0 or infinity, replacing this with 1 will substantially reduce the interval confidence level.
For all values, when neither CI limit equals 1, the two-sided P-value is closer to the reported value 91% of the time. However, in cases with one CI limit equal 1, the two-sided recomputed P-value was closer than the one-sided recomputed P-value, to the reported P-value 63% of the time. So for the CI = 1 cases, if the one-sided recalculated P-value was closer to the reported value, we assumed it was a one-sided test and used the one-sided P-value for discrepancy calculations. But, in these cases, the assumption of the ratio being equidistant from both the CI boundaries in log space is no longer valid, and we lack part of the necessary information for recomputing the true value of the ratio, so these instances were removed from the analysis of discrepancies between reported and recomputed ratios.
2.8 Identifying systematic errors
Errors could be the result of a mistake not easily attributed to any single cause, or they could be systematic in nature. For example, a problem either in the setup of calculations or the expertise of the authors may lend itself to repeated errors. Modeling the error occurrence by a Poisson distribution, for each abstract we calculated the P-value of finding at least as many errors as observed, considering the total number of all analyzable items reported, just by random chance. Then from it, adjusting for multiple testing, we computed the false discovery rate (FDR) over all abstracts reporting items of the same type.
We estimated systematic errors by summing the true discovery rate (=1−FDR) over all abstracts with more than one analyzable item, yielding an approximation of how many abstracts had systematic errors, then dividing by the number of abstracts with more than one analyzable item. Note that, considering the rather low overall error rate occurrence, abstracts with single or no reported errors will end up having a FDR = 1 hence would not contribute to the sum anyway, matching the common sense expectation that errors in such abstracts are not systematic.
3 Results
A total of 486 318 analyzable items were identified within and extracted from 196 278 unique abstracts across 5652 journals. Figure 1 shows discrepancies between reported and re-calculated percent–ratio pairs, while Figure 2 gives an overview of the comparisons between all reported and recalculated statistical ratio–CI pairs, scaled to their log10 values.
In Figures 1 and 2, the main diagonal reflects instances where the recalculated values matched the reported (published) values. This is an important control, as one would expect errors to be infrequent relative to correct calculations. Most instances (92.4%) had a discrepancy of 1% or less. Certain types of errors are also evident in these plots—seen as lines that run both parallel and perpendicular to the main line. Recalculated values offset by a factor of 10 (±1.0 in the log scale) parallel to the main diagonal are errors whereby a decimal point was either omitted or misplaced in the ratio. The parallel lines ±0.5 in Figure 2 are most likely attributable to decimal omission or misplacement in one of the CIs. And the perpendicular line represents instances whereby the numerator and denominator were swapped. In at least one identified decimal error (PMID 25034507), there is what appears to be a note from an author on the manuscript that apparently made it into the published version by accident whereby they ask ‘Is 270 correct or should it be 2.70’ (it should have been 2.70). Figure 3 shows the distribution of discrepancies found in ratio calculations, illustrating that smaller errors are more likely to be published than large ones, although a spike in those ≥100% can be seen.
We find that discrepancies in items that require more proficiency to accurately calculate and report (ratio–CI pairs) were more frequent in the published literature than errors that required minimal proficiency (percent–ratio pairs). Table 1 summarizes the error rates for each calculation type by magnitude. Large discrepancies were less frequent in all categories than smaller discrepancies. Interestingly, despite the calculation of 95% CIs for HR, RR and OR entailing essentially the same procedure, their error rates differed. Abstracts without discrepancies tended to have significantly more authors and were published in significantly higher impact journals.
Reported values versus recalculated values across order-of-magnitude discrepancy ranges for each of the item types analyzed
| Reported versus re-calculated values | Discrepancy rates for: | |||
|---|---|---|---|---|
| pct-ratio | HR | RR | OR | |
| ≥100% discrepancy | 0.3% | 0.4% | 0.4% | 0.8% |
| ≥10% discrepancy | 1.2% | 2.4% | 2.9% | 3.5% |
| ≥1% discrepancy | 2.7% | 5.6% | 6.2% | 7.5% |
| P-value errors | — | 3.9% | 5.8% | 6.0% |
| Ratio outside CI | — | 0.4% | 0.4% | 0.6% |
| ‘Significant errors’a | 1.2% | 4.0% | 4.4% | 5.0% |
| Average number of authors, errors versus no errorsb | 2.6E-13 | 1.6E-05 | 6.4E-04 | 2.1E-09 |
| Average JIF, errors versus no errorsb | 8.6E-08 | 2.6E-32 | 7.8E-06 | 2.1E-38 |
| Analyzable items found: | 241 568 | 43 467 | 32 768 | 168 515 |
| Avg items/abstract: | 2.46 | 2.15 | 2.31 | 2.49 |
Note: ‘Ratio outside CI’ refers to instances in which the reported ratio is not within the 95% CI boundaries, which should never happen. ‘P-value errors’ include both those that flip significance at P ≤ 0.05 and those an order of magnitude off in the wrong direction.
Bolded items are to draw attention to the “bottom line” error rates.
Includes items with discrepancies ≥10%, ratios outside the CIs, and/or P-value errors.
t-test P-values for comparing the means of the number of authors and JIFs between papers with ≥10% discrepancy versus those with no discrepancy.
3.1 Reported versus recalculated P-values
A total of 81 937 P-values were extracted along with their ratio–CI pairs. The reported CIs were used to recalculate P-values using formula (2.1). Figure 4 shows a good general match between our re-calculated P-values and the reported P-values, focusing on the range 0–1. We found a total of 1, 179 (1.44%) re-calculated P-values would alter the conclusion of statistical significance at a cutoff of P ≤ 0.05. The errors were slightly biased towards reported P-values being significant and the recalculated not significant (55%) as opposed to those reported not significant and re-calculated significant (45%). Interestingly, 34% of items with P-values erroneously reported as significant had ratio–CI errors versus only 15% of items with P-values erroneously reported as non-significant, which can be visualized as a difference in the density of red dots, in the 0–0.05 narrow bands adjacent to the axes, in Figure 4. This suggests that authors may be less likely to question the validity of a result (i.e. double-check the calculations) when it reaches statistical significance than when it does not.
Figure 5 shows the same analysis, but in log10 scale, where certain features become evident (high-resolution figures are available in Supplementary Material S3). First, the tendency to round leads to a clustering of values within certain ranges. Second, the horizontal line of recalculated P-values that cluster at P = 0.05 are mostly due to cases in which one CI limit equaled 1, the null reference ratio (hence the recalculated two-sided testing P-value would implicitly equal 1–CI). Some of these cases might have been one-sided testing of reported CIs, whereby using 1 as CI limit implies a lack of interest in testing significance in that direction. However, if one-sided testing were frequent, we would expect to see a diagonal line parallel to the main one, but offset by 0.3, which would show the cases in which our recalculations (that presume a two-sided test was used) were exactly twice as high as the reported results. Since no such trend is evident, this suggests our assumption was valid.
In our analysis, we also characterize reported P-values off by at least one order of magnitude in the wrong direction (see Section 2). These are instances whereby the significance of the results may not change, but it could be argued the level of confidence was misrepresented or miscalculated. Rounding log10 values to the nearest tenth of a decimal (e.g. 0.95 becomes 1.0), we find 4.6% of reported P-values are off by at least one order of magnitude, and 1.0% are off by five or more orders of magnitude in the wrong direction. For further analysis, we group both significance-flipping errors (at P ≤ 0.05) and order of magnitude errors together into one ‘P-value error’ category.
3.2 Higher JIF and number of authors per paper inversely correlate with error rate
We used logistic regression to model the error rate variation in each item type based on the publishing journal’s impact factor (JIF) and number of authors respectively. Log odds ratio coefficients and their P-value for significance, resulting from fitting each of the two factors impact on error rate, one at a time, are shown in Supplementary Table S1. We find that papers published in journals with higher JIFs and with more authors tend to have significantly lower rates of published errors. However, JIF and number of authors per paper are not necessarily independent, so we also modeled joint dependence. We still see a strong JIF effect when conditioning on number of authors, but the error-reducing effect of author number only remains significant for percent–ratio and P-value calculations when conditioning on JIF. This suggests the effect of the number of authors on P-value error rates is largely explained by the tendency for papers with larger number of authors to be published in higher impact journals.
Curves showing error rate dependence on the two factors from this model are shown in Supplementary Figures S1A and S2A. When predicting the rate of reported errors based upon the JIF, we observe a fairly sharp decrease at lower JIF, which then begins to level off (Supplementary Fig. S1), suggesting a diminishing return rate on error reduction as JIF increases. Interestingly, the magnitude of the effect JIF has on error rates is similar for most error types (except RR). We find a similar trend for the effect of the number of authors per paper (Supplementary Fig. S2) that error rate inversely correlates with the number of authors per paper for all error types.
3.3 Error rates over the years
Error rate dependence on the year of publication per error type, modeled with logistic regression, is shown in Supplementary Figure S3. We find percent–ratio errors did not significantly change with time (P = 0.09), HR-CI errors are on the rise (P = 0.02), while the other error types are on the decline (RR–CI, P = 6.9E-10; OR–CI, P = 4.5E-10; and P-value errors, P = 1.3E-06). Similar patterns of error variation with time are seen after conditioning on number of authors and JIF (Supplementary Fig. S3B), suggesting the improvement in error filtering is attributed to something other than author inflation or changes in JIF. HR errors are a notable exception, where the significance of error rate rise with time falls from very significant (P = 0.0001) to almost not significant (P = 0.052) after conditioning. An explanation for this might be that papers dealing with HR calculation disproportionately appeared in higher-impact journals when HRs first started appearing in MEDLINE, and have since diffused into more mainstream journals.
3.4 Abstracts with multiple errors
We focus on calculating error rates on a per-item basis because the per-abstract and per-paper error rates (E) can easily be estimated by E = n(1−R) where n is the number of reported items of a certain type and R is their per-item error rate. However, this assumes errors are independent of each other, and some errors may be systematic. For example, if the authors set up a general calculation procedure in a spreadsheet incorrectly such that the wrong numerator/denominator was used in all calculations, that would propagate errors to most or all of the reported results that relied upon it. Calculating P-values and FDRs for abstracts with multiple reportable items (see Section 2), we estimated what fraction of errors might be systematic. Table 2 shows the results. Abstracts reporting percent–ratio pairs had the lowest fraction of systematic errors, which is expected since the complexity of calculations is low. Interestingly, RR had the highest fraction of abstracts with systematic errors (20.2%).
Estimation of the fraction of abstracts that contain systematic errors
| Category | %–ratio | P-value | HR | OR | RR |
|---|---|---|---|---|---|
| ≥1 item | 58 788 | 21 367 | 11 645 | 42 549 | 8318 |
| ≥1 errors | 2042 | 2533 | 601 | 3507 | 511 |
| % with ≥1 errors | 3.5% | 11.9% | 5.2% | 8.2% | 6.1% |
| No. of systematic errs | 137 | 310 | 87 | 525 | 103 |
| % systematic errors | 6.7% | 12.2% | 14.5% | 15.0% | 20.2% |
Note: The numbers shown are for the subset of abstracts that contained more than one of each item type analyzed.
Bolded items are to draw attention to the “bottom line” error rates.
4 Discussion
We find that the probability an error will make it into the published literature correlates with the complexity of the calculations and is mitigated by increasing JIF of the publishing journal and the number of authors per paper. Abstracts tend to report multiple calculations of the same mathematical/statistical nature, and papers even more, thus the odds of an error in each paper is proportional to the number of calculations of each type. It’s not clear whether the inverse correlation we see between JIF and error rates reflects the effect of increasingly rigorous peer-review, or higher impact journals tend to receive papers with fewer errors. If the correlation is primarily due to increasingly rigorous peer-review, then the error rates associated with the lowest JIF journals should best approximate the baseline error rate for each analyzed item type (i.e. error rate prior to peer-review). One limitation of the study is that 17% of the journal names did not map to JIFs. We also find that the more authors per paper, the less likely an error of the types analyzed will be published. Most studies to date have been concerned about the negative impacts of ‘author inflation’, but ours suggests that the upside is a reduced probability of errors.
Initially, we did not expect that error rates would significantly differ in the 95% CIs for OR, HR and RRs, because they essentially involve the same procedure and generally appear in similar medical journals and epidemiological studies. However, we cannot measure author error rates directly, only errors published after peer-review. And, as we have seen, each analyzed item type varied in the average number of authors per paper and average JIF in which it appears, so this may explain the differences in error rates for similar statistical procedures. Similarly, we were somewhat surprised to see some error rates changing with time, but this may be in part explained by increased availability of software to perform ratio–CI and P-value calculations.
The distribution in the magnitude of errors also shows that bigger errors are more likely to be noticed by either authors or reviewers than smaller errors. It’s not clear at what point one might question the overall conclusions of a paper based upon a discrepancy, but the larger the discrepancy, the more potentially concerning it is. And the fact that these discrepancies were found within the abstract, which usually recapitulates the most relevant findings of each paper, suggests they are more likely to be potentially problematic than had they been found in the full-text.
At least 1179 (1.44%) of recalculated P-values indicated that the assessment of statistical significance at P ≤ 0.05 was incorrect, at least based upon the values reported. The 12.9% error rate in P-values reported by Nuijten et al. (2015) was based on a per-full-text basis with an average of 11 P-values found per paper, whereas ours is on a per-item basis. If we presume our abstract-based per-item error rate of 1.44% extends to the probability of finding one erroneous item in the full paper, and that MEDLINE abstracts reporting at least one P-value also have an average of 11 per paper; then we would expect ∼14.7% of MEDLINE papers containing P-values to have one such error (0.985611 = 0.853). Thus, our estimates are quite consistent with their findings, and support the notion that there is simply a base error rate associated with each task that humans perform in constructing a reportable item.
The source of the errors is unknown, but in cases where recalculated values differed by a factor of 10, the obvious conclusion is that a decimal place was somehow forgotten or misplaced. In a minority of cases where the abstract is obtained through optical character recognition (OCR), the numbers may not be correctly recognized. For example, in PMID 3625970 (published 1987), it reads ‘896% (25/29 infants)’ in the MEDLINE abstract, but the scanned document online shows it actually reads ‘86% (25/29 infants)’. The rate of OCR error is unknown, but we don’t expect this would be a major confounding factor for this study. Electronic submission became widespread around 1997 and prior to this date, the number of errors ≥1% was 13.6% whereas it was 15% overall, suggesting that this period where OCR was more common does not have an appreciably higher error rate.
We have conducted this study using relatively conservative definitions of what constitutes a ‘discrepancy’, preferring to give authors the benefit of the doubt, particularly in cases where knowledgeable readers would understand that other factors (e.g. rounding, sig figs) might influence the precision of reported numbers and would be able to discern that a low-precision estimate on the threshold of significance is more problematic that one that is highly significant. However, it does lead to underestimation of the real error rate if adherence to field standards is the criteria for defining discrepancy. For example, 285 instances had a lower CI limit of exactly zero, which we assume is due to significant figure rounding, but it cannot be exactly zero. As a consequence, discrepancies within these items are generally higher (12.3 versus 7.0%) due to loss of precision.
By identifying paired values, we were able to reverse-engineer the calculations to identify potential discrepancies. With the exception of decimal discrepancies, we cannot say which of the paired values was incorrect. But having some way to double-check reported values is important for scientific reproducibility. Along those lines, this study focused on errors of commission (i.e. incorrect calculations) and not errors of omission (i.e. leaving out relevant details), and we did see many instances where ratio reports were missing key values, such as only reporting one CI, not mentioning the percentile of the CI, and not reporting the CI at all. And although one CI could be inferred from the other and 95% could be reasonably assumed as the default CI, this reduces the rigor and fidelity of attempts to reproduce the calculations.
4 Conclusion
This study is the first to estimate MEDLINE-wide rates of published errors within these five item types (HR, OR, RR, percent-division and P-values) within abstracts. We did not establish full-text error rates, but expect them to be similar, possibly even slightly higher because one might presume more attention is paid to the abstract. Because more items are reported in full-text papers, the per-paper error rate is expected to be significantly higher than the per-item rate reported here, presuming the paper contains such items.
The difficulty of a task is not always immediately obvious, but it correlates strongly with the probability that an error will be made, and it’s reasonable to expect that this phenomenon likely extends to all reportable item types that process raw data through procedures and calculations, not just the ones we analyzed here. It’s true for experimental procedures as well, but positive and negative controls mitigate the problem there, whereas statistical reporting does not normally include control calculations. We suggest that most of these errors are simply probabilistic and—to some degree—inevitable. However, as we show here, they can be detected algorithmically, which is fast and cost-effective and could be done prior to publication. Thus, there is an anticipated benefit to the continued development and refinement of automated methods of detecting such errors. We find straightforward regular expressions are quite accurate in detecting statistical ratios reports within text, which tend to have fairly standardized reporting structures, but are not as well-suited to identifying percent–ratio errors, where there is substantially more variation.
Minimizing published errors is a priority, not just to ensure public confidence in science and protect the integrity of our own reports, but because we rely upon published findings to establish facts that often serve as the foundation for our own hypotheses, experiments and conclusions. Ultimately, science in general will benefit from a better understanding of base error rates for common tasks humans perform when constructing reportable items, as this will help us understand where to best focus our efforts.
Acknowledgements
We would like to sincerely thank statisticians Julie Stoner, David Thompson and Courtney Montgomery for their critical reviews of this article, and Sierra Sallee for helping double-check algorithmic output quality.
Funding
This work was supported by the National Science Foundation [grant no. ACI-1345426] and the National Institutes of Health [nos. U54GM104938 and P20GM103636].
Conflict of Interest: none declared.
References

