


Abstract
Deciphering relevant biological insights from epigenomic data can be a challenging task. One commonly used approach is to perform enrichment analysis. However, finding, downloading and using the publicly available functional annotations require time, programming skills and IT infrastructure. Here we describe the online tool EpiAnnotator for performing enrichment analyses on epigenomic data in a fast and user-friendly way.
EpiAnnotator is an R Package accompanied by a web interface. It contains regularly updated annotations from 4 public databases: Blueprint, RoadMap, GENCODE and the UCSC Genome Browser. Annotations are hosted locally or in a server environment and automatically updated by scripts of our own design. Thousands of tracks are available, reflecting data on a variety of tissues, cell types and cell lines from the human and mouse genomes. Users need to upload sets of selected and background regions. Results are displayed in customizable and easily interpretable figures.
The R package and Shiny app are open source and available under the GPL v3 license. EpiAnnotator’s web interface is accessible at http://computational-epigenomics.com/en/epiannotator.
1 Introduction
Interpretation of large epigenomic datasets is usually context-dependent and associated to a genome assembly of interest. Unravelling relevant biological insights from such datasets can be a burdensome and time-consuming task. One common approach to overcome some of these difficulties is to perform enrichment analysis.
The recent increase in the use of new technologies designed for profiling epigenetic marks allows us to access large amount of methylation data from different repositories—ENCODE (ENCODE Project Consortium, 2004), the UCSC Genome Browser (Karolchik et al., 2003), the International Human Epigenome Consortium (Bujold et al., 2016), Roadmap Epigenomics (Bernstein et al., 2010), etc. (Fig. 1A). However, multiplication of sources for genomic and epigenomic datasets can complicate analysis and results interpretation.
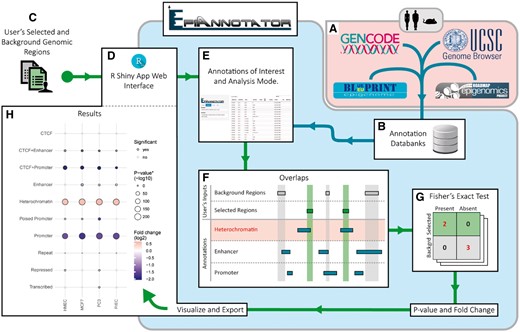
EpiAnnotator workflow example for an enrichment analysis performed with user’s selected and background genomic regions and annotations from EpiAnnotator’s databanks
2 Implementation
To address these potential difficulties, we developed the EpiAnnotator web service as an all-encompassing enrichment analysis tool in a logic of centralization and regular updates from large web resources (Fig. 1B). Thousands of annotations are accessible to researchers to enable them to conveniently conduct comparative enrichment analyses and generating rapidly their own results in the form of comprehensive publication quality figures. EpiAnnotator builds upon extensive bioinformatical tools dedicated to enrichment analysis on genetic and epigenetic data. The R package LOLA (Sheffield and Bock, 2016) provides enrichment analysis but lacks visualization. The widely used DAVID service (Huang et al., 2009) focuses on genes only and is not integrated with epigenomic repositories. DeepBlue (Albrecht et al., 2016) provides a programmatic interface for accessing such repositories but does not perform enrichment analysis. The Genomation toolkit (Akalin et al., 2015) and the EpiExplorer web service (Halachev et al., 2012) are suitable for summarization and visualization of genomic intervals but lack functionalities for enrichment analysis. Moreover, most of the tools described above require programming expertise from their users, whereas EpiAnnotator provides a user-friendly web interface relying on a Shiny app. Its functionalities are implemented in a back-end R package which utilizes the robust IRanges package from Bioconductor (Lawrence et al., 2013) to optimize the computation of region overlap.
3 Workflow
EpiAnnotator enrichment analysis commonly needs three sources of data: a BED file containing a set of selected genomic regions of interest, another BED file containing a set of background genomic regions (Fig. 1C), and annotations, i.e. reference sets of genomic regions. Both the selected and background genomic regions are uploaded by the user (Fig. 1D). Annotations are selected from the EpiAnnotator interface after specifying the databank to be used (Fig. 1E). In addition to the default collection of annotations, we provide access to the LOLA core and extended databases. Conveniently, users who focus on studies using the HumanMethylation450 or MethylationEPIC assay can upload sets of probe identifiers instead of their targeted CpG sites. Annotations are analyzed for overlap with the uploaded regions (Fig. 1F). Two options are available to the user: an enrichment analysis using Fisher’s exact test (Fig. 1G) or an overview of the data. The result of an enrichment analysis is a table listing number of overlapping regions, as well as fold changes and P-values. EpiAnnotator provides multiple visualizations through easily interpretable plots. As an example, Figure 1H shows a summary plot displaying the results of the enrichment analysis performed with selected and background genomic regions from Taylor et al. (2017) and annotation tracks from Taberlay et al. (2014). The border and size of the circles denote significance level of the overlap; degree of enrichment or depletion is represented by the fill color. EpiAnnotator’s interface has been designed to be compatible with both computer screen and smartphone displays.
4 Conclusion
A key element allowing EpiAnnotator to decrease the long-extended computation time to a few seconds, is the usage of pre-computed distances for the reference set of genomic regions hosted in EpiAnnotator’s databanks. The databases are updated every two months to provide users with the latest annotations. Using EpiAnnotator does not require any coding skills, gives access to thousands of annotations through a web interface and provides enrichment analysis results along with high quality figures.
Acknowledgement
We would like to thank Erik Bernstein for the outstanding IT support.
Funding
Y.A. was supported by DZHK (German Centre for Cardiovascular Research). This work was funded in part by the German Research Foundation (DFG), FOR 2674 and by the German Federal Ministry of Education and Research (BMBF), ICGC-Data Mining 01KU1505A.
Conflict of Interest: none declared.
References

